
Strong but Overbought: Technical Indicator Analysis and Short-term Trading Strategy for Yanzhou Energy (1171)
Combining the perspective from the [Hong Kong Stock Podcast] on February 10, Simon pointed out that Yanzhou Energy (01171) had shown impressive short-term performance recently, with the stock price continuously breaking new highs. During trading, it reached a peak of 12.91 yuan, nearing the 13-yuan mark, but there was no significant increase in trading volume, remaining consistent with previous levels—a feature investors should take note of. Market participants are widely watching to see if the upward trend continues and whether the stock can stabilize and break through the 13-yuan level. From a technical perspective, 13 yuan is a key resistance level for Yanzhou Energy. If this level is successfully breached, the stock could further rise to 14.1 yuan, which has also increased market attention toward Yanzhou Energy’s call warrants.
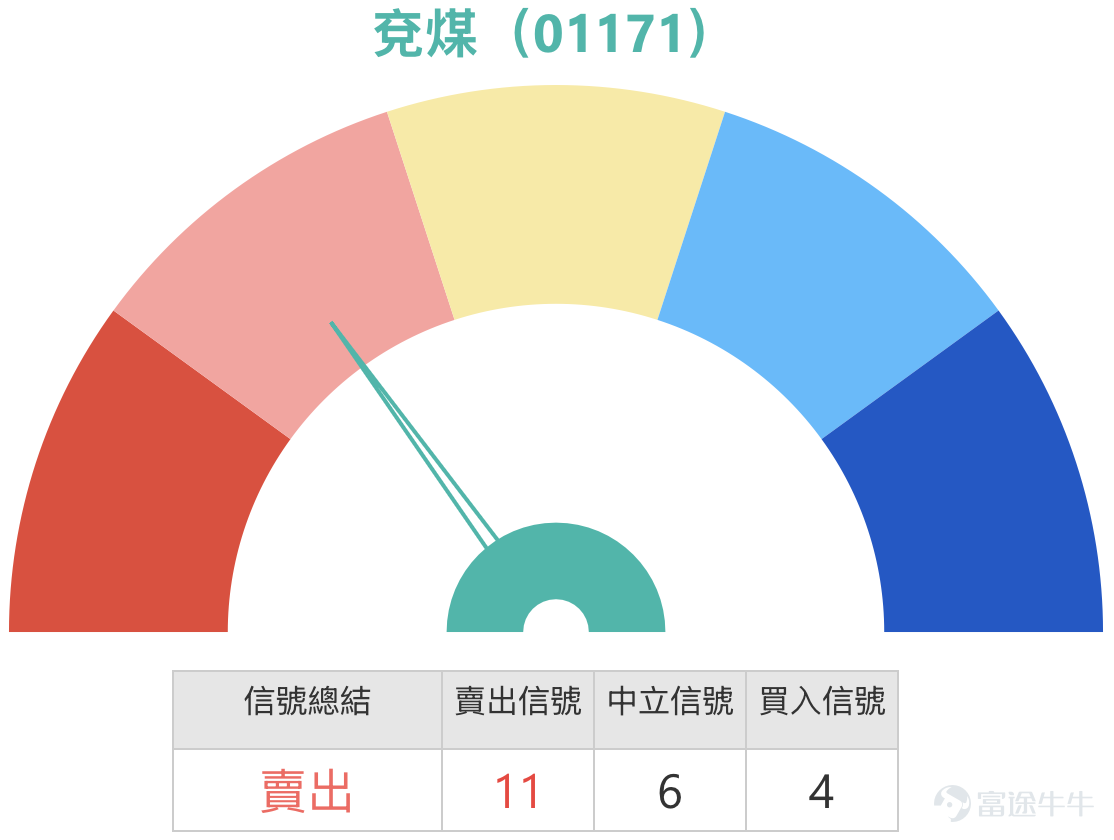
Based on the latest technical data analysis as of today, Yanzhou Energy closed at 13.66 yuan. Observing the technical indicators, the short-term trend shows strong momentum but is overbought. In terms of moving averages, the stock price is significantly higher than the 10-day moving average (13.29 yuan), the 30-day moving average (11.93 yuan), and the 60-day moving average (11.00 yuan), presenting a bullish alignment. However, the Relative Strength Index (RSI) is as high as 80, entering the 'overbought' zone. Both the Williams %R and Stochastic Oscillator are issuing 'sell signals,' with the overall technical indicator summary signaling a 'strong sell.' Notably, the VR Volume Ratio indicator is showing a 'buy' signal, while both the MACD indicator and Bollinger Bands are displaying 'buy' signals. Overall, although the stock remains in a strong uptrend channel, clear overbought signals suggest investors should be cautious about potential pullback risks.
In terms of support and resistance levels, based on the latest data, the primary support level for Yanzhou Energy is 12.8 yuan, with stronger support at 11.8 yuan. The immediate resistance level above is 14.1 yuan, which closely matches the 14.1-yuan resistance mentioned in the Podcast. If this level is effectively broken, the next resistance level will be 15.8 yuan. Investors formulating short-term strategies should focus on how the stock behaves above the 13-yuan level and whether it can break through the 14.1-yuan resistance with increased trading volume.
![Combining the perspective from the [Hong Kong Stock Podcast] on February 10, Simon pointed out that Yanzhou Energy (01171) had shown impressive short-term performance recently, with the stock price continuously breaking new highs. During trading, it reached a peak of 12.91 yuan, nearing the 13-yuan mark, but there was no significant increase in trading volume, remaining consistent with previous levels—a feature investors should take note of. Market participants are widely watching to see if the upward trend continues and whether the stock can stabilize and break through the 13-yuan level. From a technical perspective, 13 yuan is a key resistance level for Yanzhou Energy. If this level is successfully breached, the stock could further rise to 14.1 yuan, which has also increased market attention toward Yanzhou Energy’s call warrants. Based on the latest technical data analysis as of today, Yanzhou Energy closed at 13.66 yuan. Observing the technical indicators, the short-term trend shows strong momentum but is overbought. In terms of moving averages, the stock price is significantly higher than the 10-day moving average (13.29 yuan), the 30-day moving average (11.93 yuan), and the 60-day moving average (11.00 yuan), presenting a bullish alignment. However, the Relative Strength Index (RSI) is as high as 80, entering the 'overbought' zone. Both the Williams %R and Stochastic Oscillator are issuing 'sell signals,' with the overall technical indicator summary signaling a 'strong sell.' Notably, the VR Volume Ratio indicator is showing a 'buy' signal, while both the MACD indicator and Bollinger Bands are displaying 'buy' signals. Overall, although the stock remains in a strong uptrend channel, clear overbought signals suggest investors should be cautious about potential pullback risks.](https://nnqimage.futunn.com/sns_client_feed/1162342/20260224/web-1771917599892-aUue4jTuF0.png/big?area=1&is_public=true&imageMogr2/ignore-error/1/format/webp)
Regarding warrant products, let's first review the performance of previously mentioned products. On February 20, we monitored two Yanzhou Energy call warrants, both of which recorded significant gains in the following two trading days (as of February 22), fully demonstrating the characteristic of derivatives to capture volatility in the underlying stock. Among them, the Morgan Stanley Call Warrant (21662) $MSYKENR@EC2604A.C (21662.HK)$ rose 15% over two days, and the DBS Call Warrant (21863) $DSYKENR@EC2604A.C (21863.HK)$ rose 23%. Meanwhile, the underlying stock rose 2.22% over the same two days. Leveraging their inherent leverage, the call warrant products delivered higher return elasticity.
![Combining the perspective from the [Hong Kong Stock Podcast] on February 10, Simon pointed out that Yanzhou Energy (01171) had shown impressive short-term performance recently, with the stock price continuously breaking new highs. During trading, it reached a peak of 12.91 yuan, nearing the 13-yuan mark, but there was no significant increase in trading volume, remaining consistent with previous levels—a feature investors should take note of. Market participants are widely watching to see if the upward trend continues and whether the stock can stabilize and break through the 13-yuan level. From a technical perspective, 13 yuan is a key resistance level for Yanzhou Energy. If this level is successfully breached, the stock could further rise to 14.1 yuan, which has also increased market attention toward Yanzhou Energy’s call warrants. Based on the latest technical data analysis as of today, Yanzhou Energy closed at 13.66 yuan. Observing the technical indicators, the short-term trend shows strong momentum but is overbought. In terms of moving averages, the stock price is significantly higher than the 10-day moving average (13.29 yuan), the 30-day moving average (11.93 yuan), and the 60-day moving average (11.00 yuan), presenting a bullish alignment. However, the Relative Strength Index (RSI) is as high as 80, entering the 'overbought' zone. Both the Williams %R and Stochastic Oscillator are issuing 'sell signals,' with the overall technical indicator summary signaling a 'strong sell.' Notably, the VR Volume Ratio indicator is showing a 'buy' signal, while both the MACD indicator and Bollinger Bands are displaying 'buy' signals. Overall, although the stock remains in a strong uptrend channel, clear overbought signals suggest investors should be cautious about potential pullback risks.](https://nnqimage.futunn.com/sns_client_feed/1162342/20260224/web-1771917701172-ZOOrYQv95y.png/big?area=1&is_public=true&imageMogr2/ignore-error/1/format/webp)
Combining current support and resistance levels with the Podcast perspective, we further analyze products worth considering at the current price stage. For investors expecting Yanzhou Energy to stabilize above the HKD 13 level and challenge resistances at HKD 14.1 or even HKD 15.8, call warrants can be considered. HSBC call warrant (24441) has a strike price of HKD 13.51, closely linked to the key support at HKD 13 and resistance at HKD 14.1, offering an actual leverage of approximately 4.7x, characterized by ideal leverage and implied volatility. BNP Paribas call warrant (21298), with a strike price of HKD 13.5, offers about 4.5x leverage, the highest leverage with relatively low premium. Bank of China call warrant (21287) has a strike price of HKD 13.09, closer to the current share price, with a premium of 10.10%, implied volatility of 44.82%, and provides 4.31x leverage. UBS Group call warrant (23130)$UBYKENR@EC2608A.C (23130.HK)$also has a strike price of HKD 13.09, a premium of 10.65%, implied volatility of 46.9%, and offers 4.15x leverage.
Regarding the question raised in the [HK Stocks Podcast] about the layout of call warrants with a strike price of HKD 14, Simon pointed out that there are currently viable options on the market for call warrants with a strike price of HKD 14 or higher. These products have expiration dates around mid-May, which is about three months from now. However, considering Yanzhou Energy's substantial cumulative gains in this round, if the stock price adjusts or moves sideways subsequently, the time value decay of these short-term call warrants will accelerate. In comparison, call warrants with strike prices around HKD 15.5 or HKD 15.7 have expiration dates in July, about five months from now, providing a longer time frame. Even if the stock price moves sideways in the short term, the time value decay of these products would be relatively lower, offering stronger defense for investors. However, these products provide relatively lower leverage, around 5.1-5.2x. Investors can choose products based on their outlook on Yanzhou Energy’s future performance: if they believe the stock price will break through HKD 14 in the short term, they may opt for short-term, high-strike-price products; if they anticipate sideways movement or adjustments in the stock price, long-term products would be a better choice.
![Combining the perspective from the [Hong Kong Stock Podcast] on February 10, Simon pointed out that Yanzhou Energy (01171) had shown impressive short-term performance recently, with the stock price continuously breaking new highs. During trading, it reached a peak of 12.91 yuan, nearing the 13-yuan mark, but there was no significant increase in trading volume, remaining consistent with previous levels—a feature investors should take note of. Market participants are widely watching to see if the upward trend continues and whether the stock can stabilize and break through the 13-yuan level. From a technical perspective, 13 yuan is a key resistance level for Yanzhou Energy. If this level is successfully breached, the stock could further rise to 14.1 yuan, which has also increased market attention toward Yanzhou Energy’s call warrants. Based on the latest technical data analysis as of today, Yanzhou Energy closed at 13.66 yuan. Observing the technical indicators, the short-term trend shows strong momentum but is overbought. In terms of moving averages, the stock price is significantly higher than the 10-day moving average (13.29 yuan), the 30-day moving average (11.93 yuan), and the 60-day moving average (11.00 yuan), presenting a bullish alignment. However, the Relative Strength Index (RSI) is as high as 80, entering the 'overbought' zone. Both the Williams %R and Stochastic Oscillator are issuing 'sell signals,' with the overall technical indicator summary signaling a 'strong sell.' Notably, the VR Volume Ratio indicator is showing a 'buy' signal, while both the MACD indicator and Bollinger Bands are displaying 'buy' signals. Overall, although the stock remains in a strong uptrend channel, clear overbought signals suggest investors should be cautious about potential pullback risks.](https://nnqimage.futunn.com/sns_client_feed/1162342/20260224/web-1771917692689-WIPgbyWEA2.jpeg/big?area=1&is_public=true&imageMogr2/ignore-error/1/format/webp)
Interactive Question:
What do you think will be the short-term trajectory for Yanzhou Energy (01171)?
A) Stabilizing above the HKD 13 level and challenging the HKD 14.1 resistance
B) Facing pressure from overbought conditions, retreating to test the HKD 12.8 support level
Feel free to share your views in the comment section!
Please follow Jenny's HK Stock Options & Warrants for more in-depth analysis of the CBBC market!
#Yankuang Energy# #Hong Kong Stocks# #Technical Analysis# #Support Level# #Resistance Level# #Warrants# #Bull and Bear Certificates# #Time Value Decay# #Call Options# #Coal Sector#
Risk Disclaimer: The above content only represents the author's view. It does not represent any position or investment advice of Futu. Futu makes no representation or warranty.Read more
Comments
to post a comment