English
Back
Open Account
How to view the post-holiday market trend in Hong Kong stocks?

港股窩輪Jenny
joined discussion · Feb 24 09:16

[Warrant Perspective] Divergence in Hang Seng Index’s Short-Term Trend; Warrant Strategy Focuses on Low Premium, High Leverage Opportunities

On February 23, the overall sentiment in the Hong Kong stock market was optimistic, with financial stocks serving as the main driving force and technology stocks also showing strong performance. $Hang Seng Index (800000.HK)$
The index closed at 27,081.91 points, up 2.53% in a single day, with a trading volume of 172.963 billion yuan. The five-day volatility was 3.2%, and the trading volume was reasonably supportive.
From a technical perspective, the Hang Seng Index (HSI) is showing a gradual strengthening in its moving average structure. Key price levels and technical indicators present the following characteristics: The HSI closed at 27,081.91 points, which is higher than the MA10 (26,872.27 points), MA30 (26,862.58 points), and MA60 (26,354.52 points). Short-term moving averages are providing support, and the mid-term trend has slightly improved, but it still needs to be observed whether it can continue to hold above the moving averages.
On February 23, the overall sentiment in the Hong Kong stock market was optimistic, with financial stocks serving as the main driving force and technology stocks also showing strong performance. $Hang Seng Index (800000.HK)$ The index closed at 27,081.91 points, up 2.53% in a single day, with a trading volume of 172.963 billion yuan. The five-day volatility was 3.2%, and the trading volume was reasonably supportive. From a technical perspective, the moving average structure of the Hang Seng Index is gradually strengthening. The closing price of the index at 27,081.91 points is higher than the MA10 (26,872.27 points), MA30 (26,862.58 points), and MA60 (26,354.52 points). Short-term moving averages are forming support, with some improvement in the mid-term trend, but it remains to be seen whether it can consistently stay above the moving averages. The support levels for the Hang Seng Index are 26,633 points and 26,098 points, while the resistance levels are 27,525 points and 28,066 points. On the previous day (February 23), the index failed to break through the first resistance level at 27,525 points. Further attention should be paid to the strength of a potential breakout at this level. If there is a breakout with high volume, it may challenge 28,066 points next. The RSI indicator is at 53, in the neutral zone, showing no signs of overbought or oversold conditions. The MACD signal indicates a sell, slightly diverging from the upward movement of the Hang Seng Index. Multiple oscillation indicators show divergence: the CCI indicator signals a buy, while the rate-of-change indicator and VR volume ratio also indicate a buy. However, the Williams %R and stochastic oscillators remain neutral. Based on the market performance from the previous day...
The support levels for the HSI are at 26,633 points and 26,098 points, with resistance levels at 27,525 points and 28,066 points. On the previous day (the 23rd), it failed to break through the first resistance level of 27,525 points. Subsequent focus should be placed on the strength of breaking through this position. If there is strong volume to break through, it may further challenge the 28,066-point level.
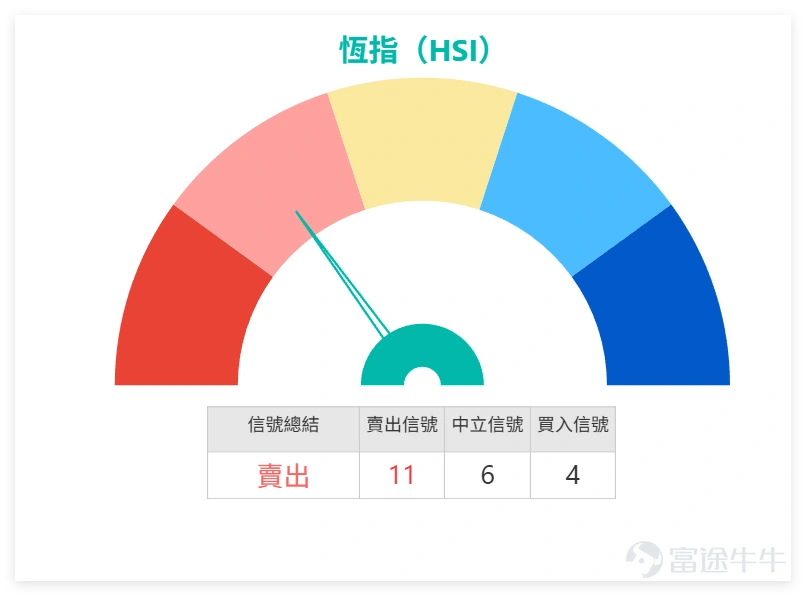
The RSI indicator is at 53, in the neutral zone, without any overbought or oversold signals. The MACD signal suggests a sell, forming a slight divergence from the upward movement of the HSI. Various oscillation indicators show mixed results: the CCI indicator gives a buy signal, as do the rate of change indicator and the VR trading ratio indicator, while the Williams %R and stochastic oscillators remain neutral.
On February 23, the overall sentiment in the Hong Kong stock market was optimistic, with financial stocks serving as the main driving force and technology stocks also showing strong performance. $Hang Seng Index (800000.HK)$ The index closed at 27,081.91 points, up 2.53% in a single day, with a trading volume of 172.963 billion yuan. The five-day volatility was 3.2%, and the trading volume was reasonably supportive. From a technical perspective, the moving average structure of the Hang Seng Index is gradually strengthening. The closing price of the index at 27,081.91 points is higher than the MA10 (26,872.27 points), MA30 (26,862.58 points), and MA60 (26,354.52 points). Short-term moving averages are forming support, with some improvement in the mid-term trend, but it remains to be seen whether it can consistently stay above the moving averages. The support levels for the Hang Seng Index are 26,633 points and 26,098 points, while the resistance levels are 27,525 points and 28,066 points. On the previous day (February 23), the index failed to break through the first resistance level at 27,525 points. Further attention should be paid to the strength of a potential breakout at this level. If there is a breakout with high volume, it may challenge 28,066 points next. The RSI indicator is at 53, in the neutral zone, showing no signs of overbought or oversold conditions. The MACD signal indicates a sell, slightly diverging from the upward movement of the Hang Seng Index. Multiple oscillation indicators show divergence: the CCI indicator signals a buy, while the rate-of-change indicator and VR volume ratio also indicate a buy. However, the Williams %R and stochastic oscillators remain neutral. Based on the market performance from the previous day...
Based on the market performance and technical indicators from the previous day, a comprehensive analysis of key blue-chip stocks is as follows:
Market sentiment that day leaned towards positivity, with all 10 blue-chip stocks closing higher, with an average increase of about 2.4%. The financial sector ( $CCB (00939.HK)$$ICBC (01398.HK)$$BANK OF CHINA (03988.HK)$ ) collectively rose, indicating that market confidence in financial stocks has somewhat recovered. Tech and consumer stocks (Tencent, AIA) also showed significant growth.
1、 $TENCENT (00700.HK)$ : As a tech leader, Tencent rose by 3.07% that day, showing outstanding performance. Although the stock price is still below the long-term moving average, its RSI rebounded after being in the oversold region, presenting a 'strong buy' suggestion technically, indicating possible short-term rebound momentum.
2、 $AIA (01299.HK)$ : The stock price surged by 4.07%, making it one of the best performers of the day. Although the technical indicators suggest a 'sell' signal, the stock price broke through the short-term moving average, showing strong buying interest in the market. Investors should pay attention to whether it can stabilize above the key moving average positions going forward.
3、 $PING AN (02318.HK)$ : As a representative of the financial insurance sector, Ping An rose by 3.19%, outperforming other stocks in the same sector. The stock price held steadily above various moving averages, showing relatively healthy technical conditions, indicating strong fundamental support.
From the perspective of technical indicators, the market showed some divergence that day:
1. Buy Signal: $HSBC HOLDINGS (00005.HK)$ Received a 'Buy' rating, indicating short-term positive technical outlook.
2. Neutral Signal: $CHINA MOBILE (00941.HK)$ and $PING AN (02318.HK)$ Rated as 'Neutral,' suggesting that the stock price may remain volatile in the short term.
3. Sell Signal: Except for Tencent, most other stocks (AIA, CCB (00939), $HKEX (00388.HK)$ , ICBC (01398), BOC, $CKH HOLDINGS (00001.HK)$ ) received a 'Sell' rating. This indicates that despite rising stock prices, there may be overheating risks technically or limited sustainability of short-term gains.
Overall, the market sentiment on February 23, 2026 was optimistic, with financial stocks acting as the main driving force and technology stocks performing well. However, technical indicators predominantly signaled 'Sell' or 'Neutral,' advising investors to cautiously assess short-term gains, closely monitor trading volume changes, and watch key technical levels to manage potential adjustment risks. Tencent's technical reversal signal deserves further observation and could present short-term trading opportunities.
Review of CBBCs and selected products:
First, let’s review the performance of some earlier bull and bear warrants products to see market opportunities over the past two days:
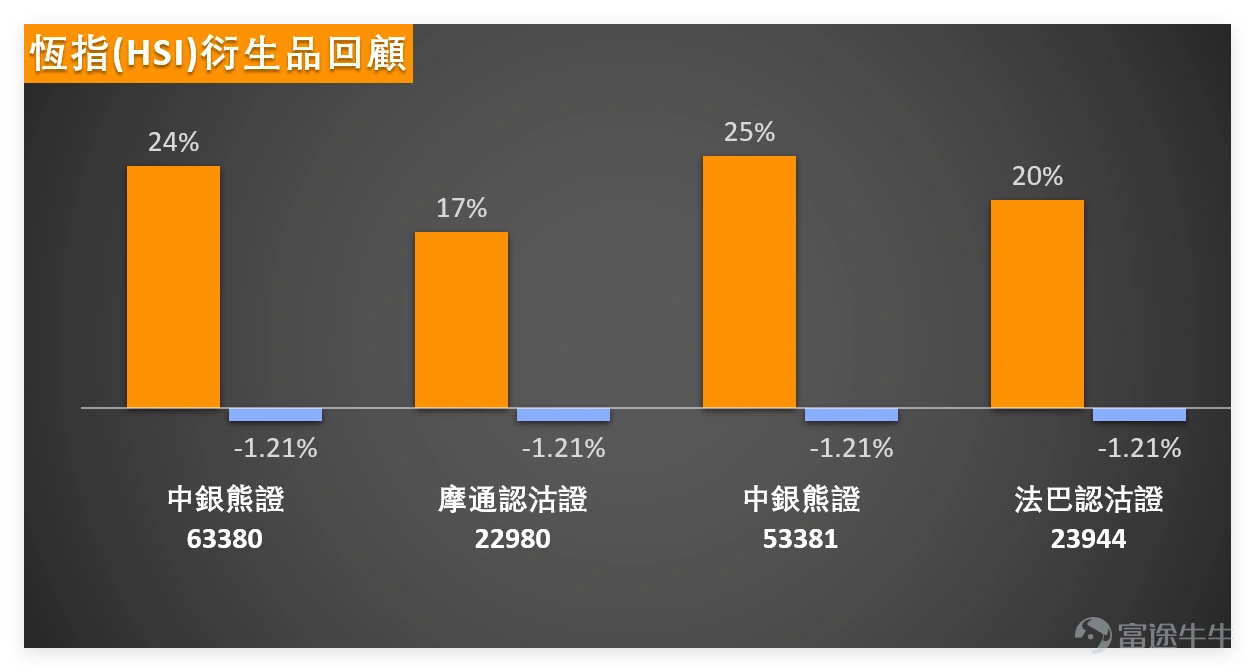
The four Hang Seng Index-related products recommended on February 12, 2026, all recorded solid gains two days later: $JP-HSI @EP2605B.P (22980.HK)$Up 17%, $BP-HSI @EP2605A.P (23944.HK)$Up 20%, BOC Bear Certificate ( $BI#HSI RP2803I.P (63380.HK)$$BI#HSI RP2803H.P (53381.HK)$ ) increased by 24% and 25% respectively, while the Hang Seng Index fell 1.21% during the same period. This shows that suitable CBBC products can effectively capture market volatility opportunities.
On February 23, the overall sentiment in the Hong Kong stock market was optimistic, with financial stocks serving as the main driving force and technology stocks also showing strong performance. $Hang Seng Index (800000.HK)$ The index closed at 27,081.91 points, up 2.53% in a single day, with a trading volume of 172.963 billion yuan. The five-day volatility was 3.2%, and the trading volume was reasonably supportive. From a technical perspective, the moving average structure of the Hang Seng Index is gradually strengthening. The closing price of the index at 27,081.91 points is higher than the MA10 (26,872.27 points), MA30 (26,862.58 points), and MA60 (26,354.52 points). Short-term moving averages are forming support, with some improvement in the mid-term trend, but it remains to be seen whether it can consistently stay above the moving averages. The support levels for the Hang Seng Index are 26,633 points and 26,098 points, while the resistance levels are 27,525 points and 28,066 points. On the previous day (February 23), the index failed to break through the first resistance level at 27,525 points. Further attention should be paid to the strength of a potential breakout at this level. If there is a breakout with high volume, it may challenge 28,066 points next. The RSI indicator is at 53, in the neutral zone, showing no signs of overbought or oversold conditions. The MACD signal indicates a sell, slightly diverging from the upward movement of the Hang Seng Index. Multiple oscillation indicators show divergence: the CCI indicator signals a buy, while the rate-of-change indicator and VR volume ratio also indicate a buy. However, the Williams %R and stochastic oscillators remain neutral. Based on the market performance from the previous day...
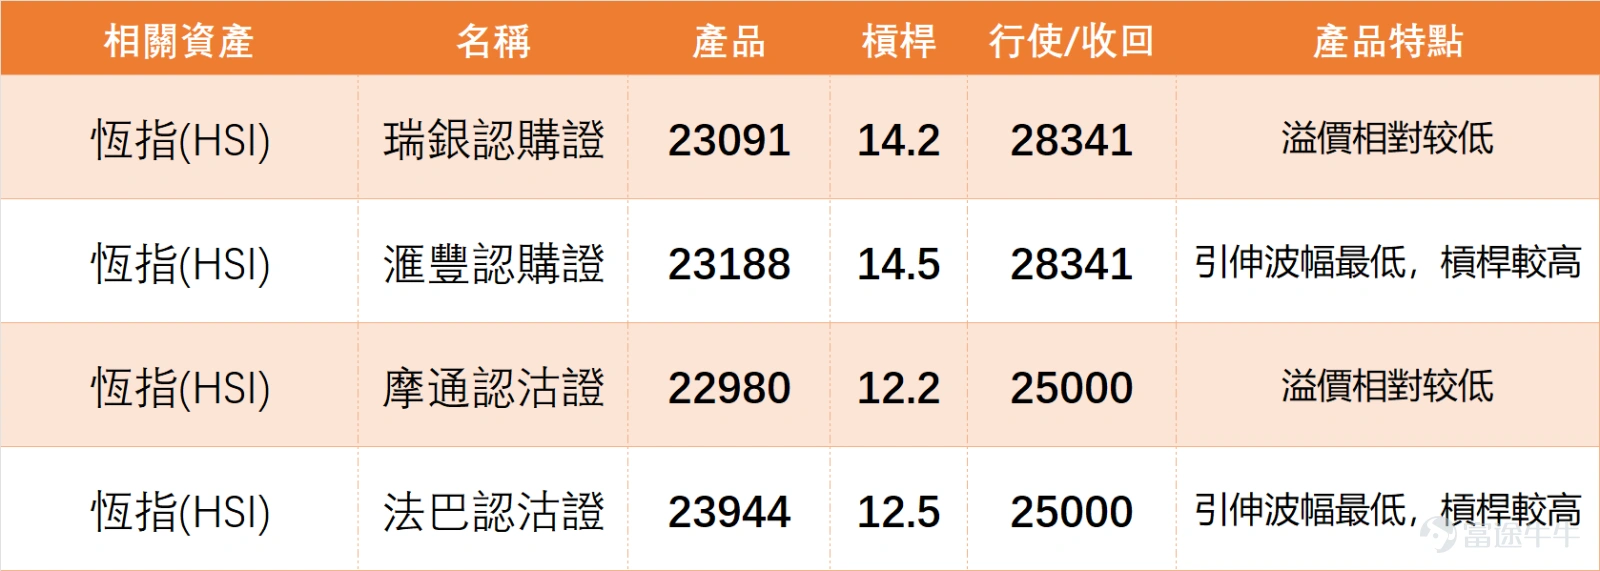
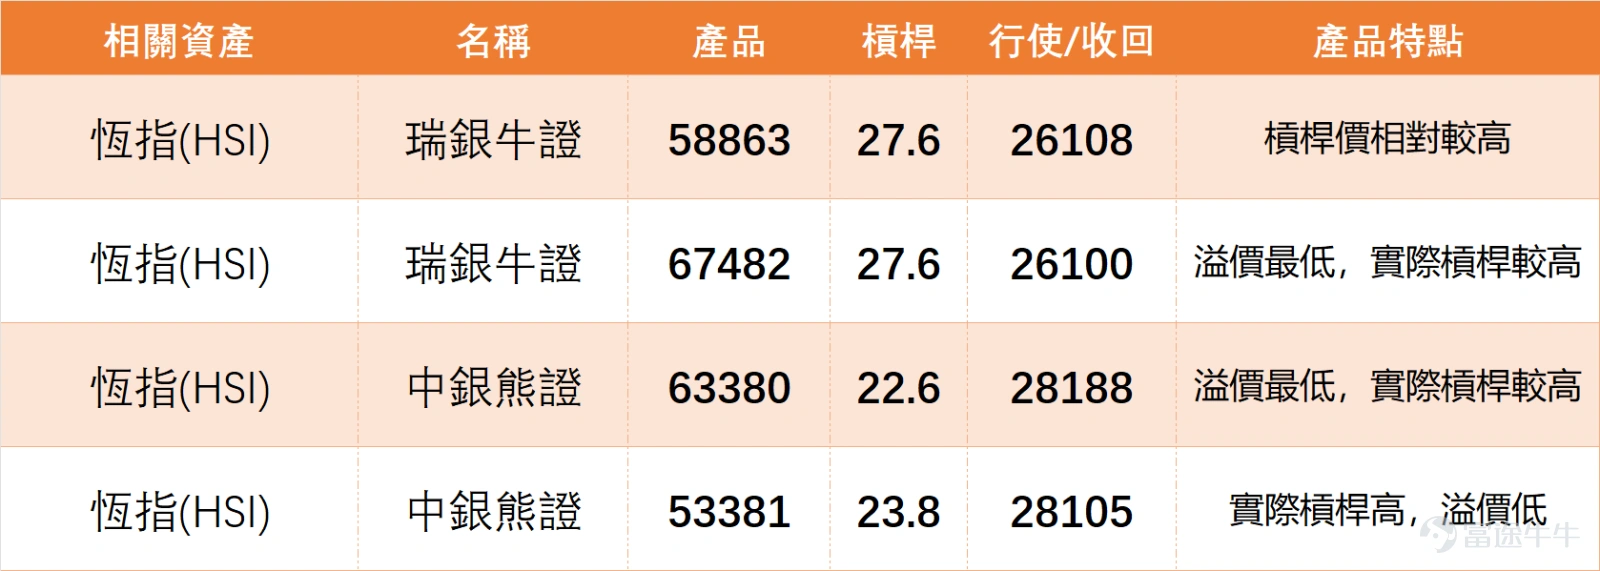
Today’s selection features 2 Hang Seng Index CBBC products (focusing on low premium and high leverage for investors' convenience). CBBC products carry leverage and higher risks; investors should choose according to their risk tolerance and proceed with caution:
1、 $UB#HSI RC28109.C (67482.HK)$ : Leverage 27.6, recovery price at 26,100 points; key feature is the lowest premium with relatively higher actual leverage, suitable for investors optimistic about a short-term breakout of the Hang Seng Index resistance level, with relatively controllable costs.
2、 $BI#HSI RP2803I.P (63380.HK)$ : Leverage 22.6, recovery price at 28,188 points; key feature is the lowest premium with relatively higher actual leverage, suitable for investors who believe the Hang Seng Index may not break through the resistance level in the short term and could see a pullback, but be mindful of recovery price risks.
On February 23, the overall sentiment in the Hong Kong stock market was optimistic, with financial stocks serving as the main driving force and technology stocks also showing strong performance. $Hang Seng Index (800000.HK)$ The index closed at 27,081.91 points, up 2.53% in a single day, with a trading volume of 172.963 billion yuan. The five-day volatility was 3.2%, and the trading volume was reasonably supportive. From a technical perspective, the moving average structure of the Hang Seng Index is gradually strengthening. The closing price of the index at 27,081.91 points is higher than the MA10 (26,872.27 points), MA30 (26,862.58 points), and MA60 (26,354.52 points). Short-term moving averages are forming support, with some improvement in the mid-term trend, but it remains to be seen whether it can consistently stay above the moving averages. The support levels for the Hang Seng Index are 26,633 points and 26,098 points, while the resistance levels are 27,525 points and 28,066 points. On the previous day (February 23), the index failed to break through the first resistance level at 27,525 points. Further attention should be paid to the strength of a potential breakout at this level. If there is a breakout with high volume, it may challenge 28,066 points next. The RSI indicator is at 53, in the neutral zone, showing no signs of overbought or oversold conditions. The MACD signal indicates a sell, slightly diverging from the upward movement of the Hang Seng Index. Multiple oscillation indicators show divergence: the CCI indicator signals a buy, while the rate-of-change indicator and VR volume ratio also indicate a buy. However, the Williams %R and stochastic oscillators remain neutral. Based on the market performance from the previous day...
Which of the two selected CBBC products do you prefer?
A. UBS Bull Certificate (67482) B. BOC Bear Certificate (63380) C. Neither (due to leverage risk) Come to the comment section and share your thoughts.
For more analysis, be sure to follow Jenny's daily updates on "HK Stock Warrants"!
Disclaimer: This article does not constitute any investment advice.
Market data, views, and analysis contained herein are subject to change without prior notice. We shall not be liable for any loss or damage caused by reliance on the information in this article. Technical analysis only shows whether certain technical conditions are met; asset performance should be comprehensively evaluated with additional information. Trading decisions should not be made solely based on this article. Please note that past performance is not indicative of future results.
#HongKongStocks #RealTimeAnalysis #WarrantsSelection #WarrantsStrategy #DerivativesHedging #HongKongWarrantsJenny #HangSengIndex #FinancialSector #TechnicalAnalysis
Risk Disclaimer: The above content only represents the author's view. It does not represent any position or investment advice of Futu. Futu makes no representation or warranty.Read more
Sob
1
461K Views
Report
Comments (2)
Write a Comment...
2
1