
China Life drops sharply by 4.95% after hitting a new high: Technical indicator divergence and moving average support structure
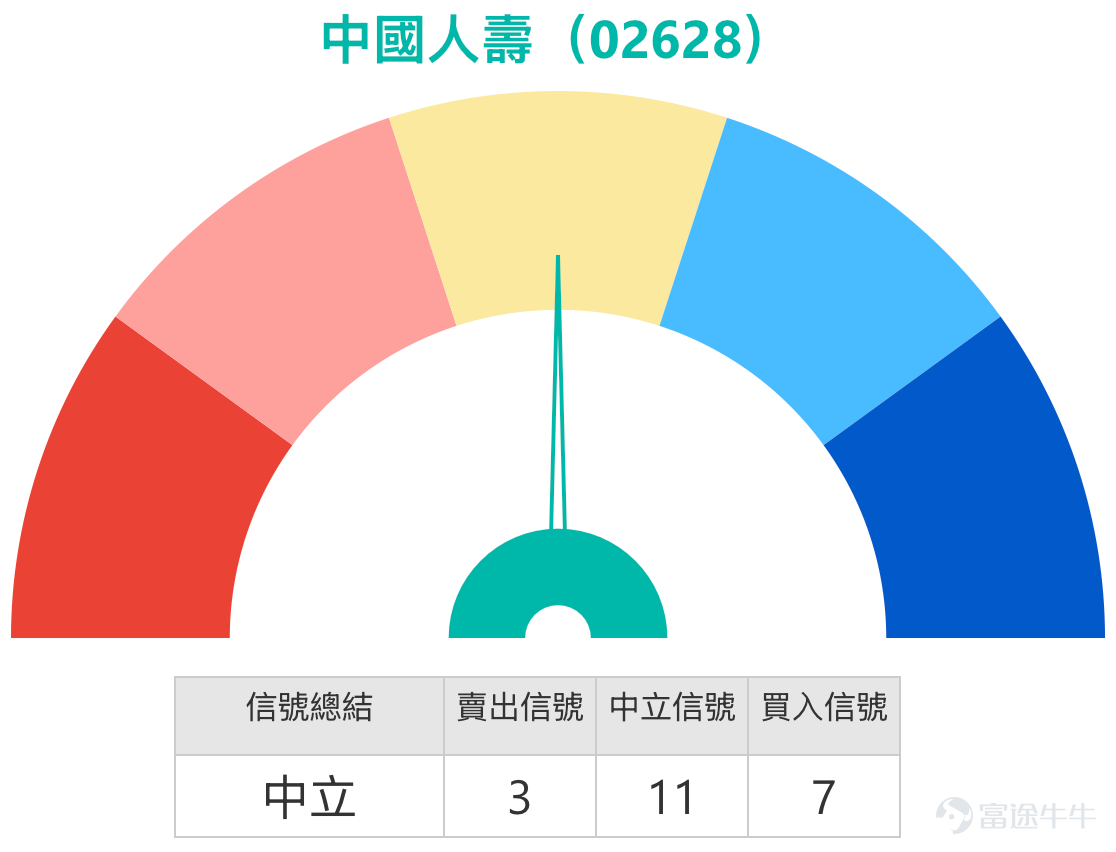
As of February 13, 2026, China Life (02628) shares closed at HKD 32.64, down 4.6%, showing a clear technical consolidation pattern after hitting a 52-week high. The technical data on February 13 indicates that China Life is presenting a clear 'indicator divergence' and 'moving average crossover' pattern. The share price stood at HKD 32.64, below the MA10 (HKD 34.27) but above the MA30 (HKD 33.09) and MA60 (HKD 30.31), reflecting weakening short-term momentum while the medium- to long-term upward trend structure remains intact.
Technical Analysis and Key Levels
Multiple oscillation indicators issued divergent signals: RSI was at 51, in a neutral position; Williams %R and the Stochastic Oscillator were in the oversold zone, with the CCI indicator clearly in the oversold region, issuing a buy signal. However, the VR trading ratio indicator showed a 'sell' signal, and MACD similarly issued a sell signal, as did the Bollinger Bands. The overall technical indicator signal is 'neutral', with a strength of 11, reflecting an intense tug-of-war between buyers and sellers at the current level.
In terms of support levels, the first support is seen at HKD 31.6, which is the key support area listed in the February 13 data and close to the round number level below the 30-day moving average of HKD 33.09. The second support is at HKD 30.1, corresponding to near the 60-day moving average of HKD 30.31. In terms of resistance levels, the first resistance is at HKD 34.5, which is near the pressure from MA10 and the resistance area listed in the February 13 data. The second resistance at HKD 36.1 is close to the 52-week high of HKD 36.16 hit on February 10, representing a key watershed for whether the short-term trend can break through.

Review of Warrants and Analysis of Bull-Bear Certificate Advantages
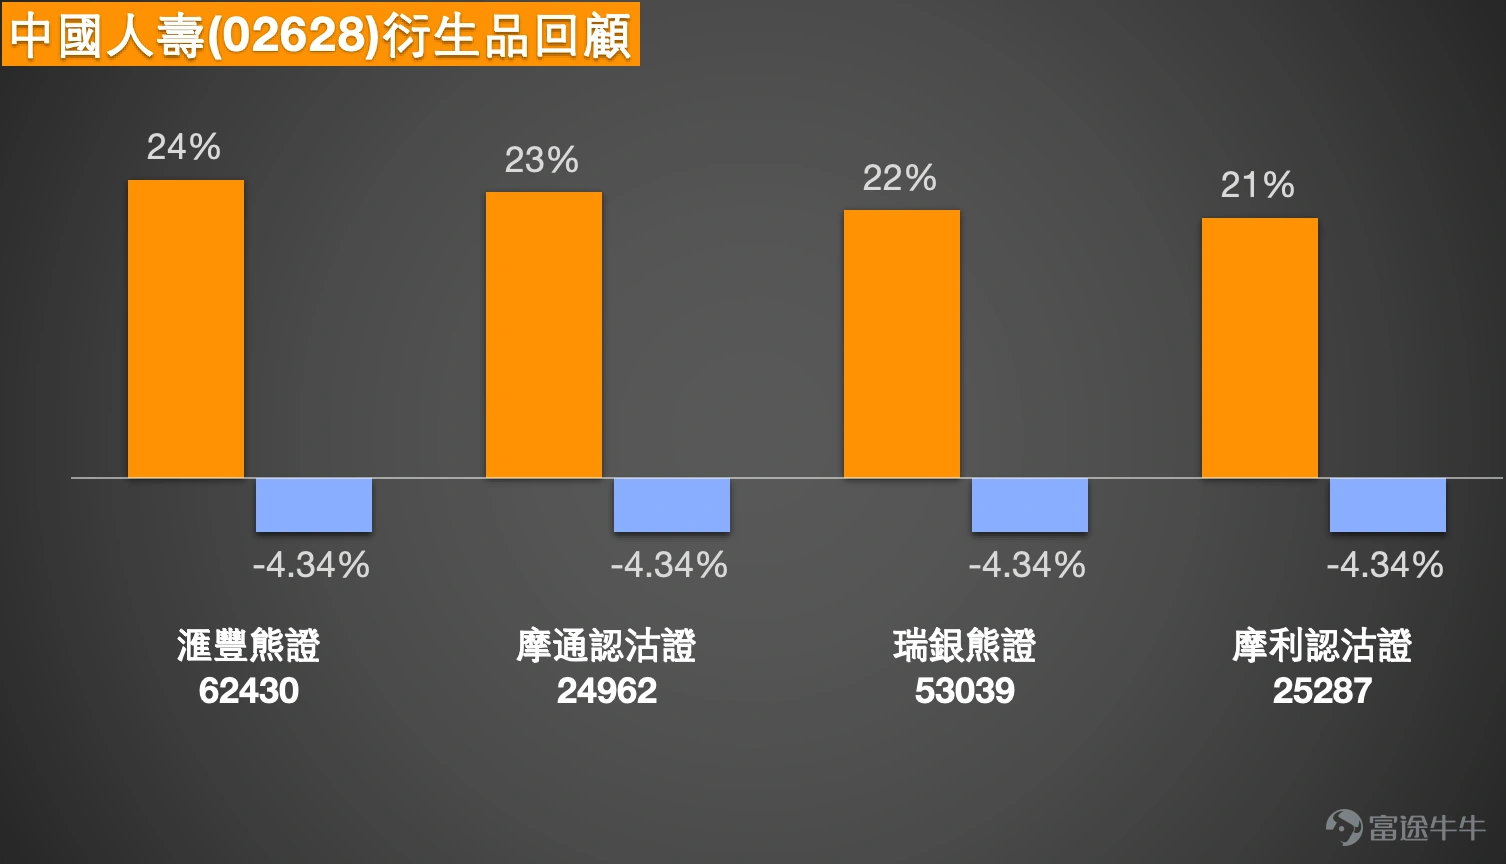
Reviewing the four bearish products mentioned on February 11, against the backdrop of the underlying stock falling 4.34% over the next two trading days, the performance of derivatives fully reflected their efficiency in tracking the underlying stock and leverage characteristics. HSBC Bear Certificate 62430 recorded a 24% increase, UBS Group Bear Certificate 53039 recorded a 22% increase, J.P. Morgan Put Warrant 24962 recorded a 23% increase, and Merrill Lynch Put Warrant 25287 recorded a 21% increase. This set of data clearly shows the fundamental structural differences between bull/bear certificates and warrants.
Current product deployment strategy
Considering the first support level at 31.6 yuan and the first resistance level at 34.5 yuan, those optimistic about a rebound may focus on mid-range bull contracts. HSBC's bull contract 67560 has a stop-loss price of 30 yuan, actual leverage of 9.9 times, and low premium; UBS Group’s bull contract 56355 also has a stop-loss price of 30 yuan, with the lowest premium and an actual leverage of 10.2 times. Both have stop-loss prices below the second support level of 30.1 yuan, providing a buffer distance of approximately 2.6 yuan, effectively reducing the risk of forced liquidation in volatile markets. For call warrants, Bank of China’s call warrant 23200 and UBS Group’s call warrant 22612. $UBCLIFE@EC2605A.C (22612.HK)$ The exercise price is the same at 35.02 yuan, close to just below the second resistance level of 36.1 yuan, with leverage reaching 6.7 times and 6.8 times respectively, and implied volatility being relatively ideal, making them suitable for capturing the rebound wave after the stock price stabilizes above 34.5 yuan and moves toward the 52-week high.
For bearish strategies, J.P. Morgan’s put warrant 24962 $JPCLIFE@EP2607A.P (24962.HK)$ has an exercise price of 28.24 yuan, corresponding to just below the second support level of 30.1 yuan, with leverage of 5.7 times; UBS Group’s put warrant 26032 has an exercise price of 28.86 yuan, with the highest leverage of 4.1 times among similar products, and a lower premium. If the stock price falls below the 31.6 yuan level, the leverage effect of these out-of-the-money put warrants will accelerate price movement. Among bear contracts, HSBC’s bear contract 68274 $HS#CLIFERP2803A.P (68274.HK)$ has a stop-loss price of 37 yuan, with the highest actual leverage of 6.8 times in its category. This stop-loss price is higher than the second resistance level of 36.1 yuan and the 52-week high of 36.16 yuan, maintaining sufficient buffer space, suitable for investors who expect the stock price to face resistance and continue a technical correction.

#LifeInsuranceStockPrice #TechnicalAnalysis #SupportAndResistanceLevels #Warrants #BullAndBearContracts #ExercisePrice #CCIOversold #MovingAverageSystem #PeerBuying #GoldenRatioRetracement
Interactive Questions:
What do you think about the short-term trend of Life Insurance stock?
A. First retesting the support level at 31.6 yuan
B. First rebounding to challenge the resistance level at 34.5 yuan
C. Consolidating narrowly around 32.5 yuan
Disclaimer: This article does not constitute any investment advice.
This article is for reference only and does not constitute any investment advice. The market data, opinions, and analysis contained herein may change at any time without prior notice. We are not responsible for any loss or damage caused by reliance on the information in this article. Technical analysis only shows whether certain technical conditions are met; a comprehensive assessment of asset performance should combine other data and should not solely rely on this article to make trading decisions. Please note that past performance is not indicative of future results. Follow Jenny's insights on Hong Kong stock warrants for more professional analysis.
Risk Disclaimer: The above content only represents the author's view. It does not represent any position or investment advice of Futu. Futu makes no representation or warranty.Read more
Comments
to post a comment