
English
Back
Open Account
港股窩輪Jenny
wrote a column · Feb 12 13:10

CATL strongly breaks through the moving averages, showing divergence signals on the technical side!

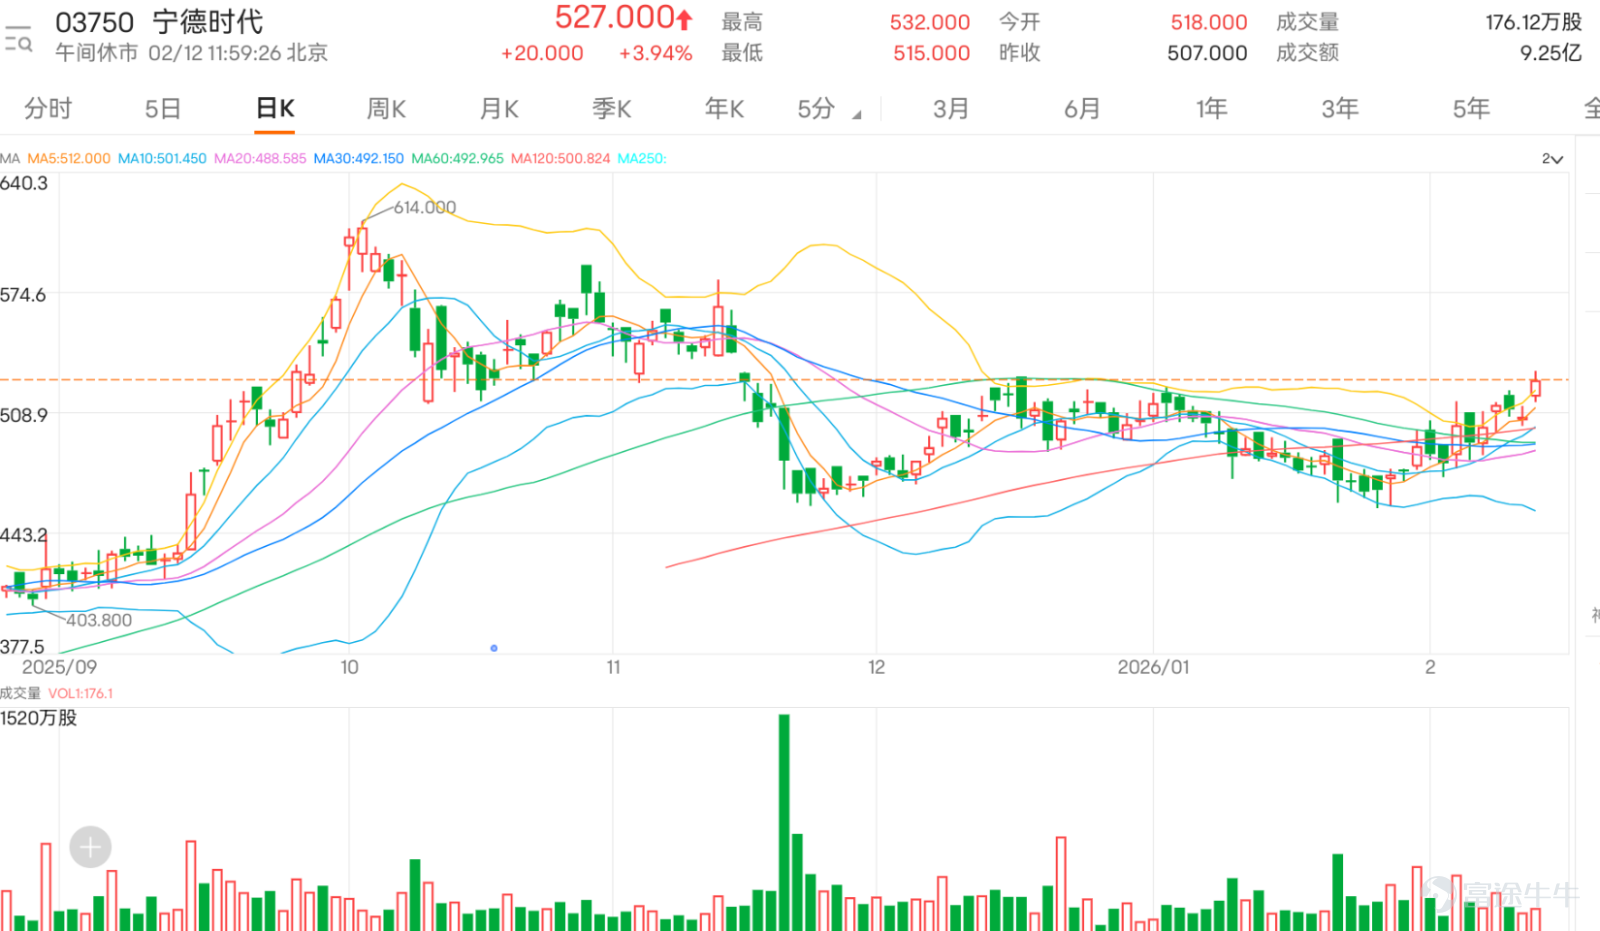
$CATL (03750.HK)$ The stock performed strongly today, with its price surging nearly 4%, closing at noon at 527 yuan, and even touching an intraday high of 532 yuan, setting a one-month record. From a technical perspective, the stock successfully broke above three key moving averages: MA10 (501.05 yuan), MA30 (492.02 yuan), and MA60 (492.90 yuan), indicating strong short-term momentum.
There are some interesting divergence signals in the technical indicators. The Stochastic Oscillator issued a buy signal, and the MACD also showed a buy signal, consistent with the stock's strong performance. However, the summary signal from the technical indicators suggests selling, with a strength of 8, reflecting some caution in the market. The RSI indicator is at 66, which, although still within the neutral zone, is approaching the overbought threshold of 70, and investors need to be mindful of short-term pullback risks.
In terms of key price levels, current support is set at 496 yuan (Support 1) and 477 yuan (Support 2), while resistance lies at 546 yuan (Resistance 1) and 569 yuan (Resistance 2). Currently, the stock price is only 4.4% away from Resistance 1 but has a buffer of 5.4% to Support 1, making the technical outlook overall positive.
The Williams %R indicator shows an overbought condition but gives a neutral signal, and the CCI indicator remains neutral as well. This divergence in technical indicators often indicates that the stock price may enter a consolidation phase. With a trading volume of 925 million yuan, market participation is quite active, providing liquidity support for future movements.
$CATL (03750.HK)$ The stock performed strongly today, with its price surging nearly 4%, closing at noon at 527 yuan, and even touching an intraday high of 532 yuan, setting a one-month record. From a technical perspective, the stock successfully broke above three key moving averages: MA10 (501.05 yuan), MA30 (492.02 yuan), and MA60 (492.90 yuan), indicating strong short-term momentum. There are some interesting divergence signals in the technical indicators. The Stochastic Oscillator issued a buy signal, and the MACD also showed a buy signal, consistent with the stock's strong performance. However, the summary signal from the technical indicators suggests selling, with a strength of 8, reflecting some caution in the market. The RSI indicator is at 66, which, although still within the neutral zone, is approaching the overbought threshold of 70, and investors need to be mindful of short-term pullback risks. In terms of key price levels, current support is set at 496 yuan (Support 1) and 477 yuan (Support 2), while resistance lies at 546 yuan (Resistance 1) and 569 yuan (Resistance 2). Currently, the stock price is only 4.4% away from Resistance 1 but has a buffer of 5.4% to Support 1, making the technical outlook overall positive. The Williams %R indicator shows an overbought condition but gives a neutral signal, and the CCI indicator remains neutral as well. This divergence in technical indicators often indicates that the stock price may enter a consolidation phase. With a trading volume of 925 million yuan, market participation is quite active, providing liquidity support for future movements...
Product Highlights
For investors optimistic about CATL's stock price breaking through the resistance level at 546 yuan, they may consider $UB-CATL@EC2606A.C (24783.HK)$and$BI-CATL@EC2606B.C (23687.HK)$. Both have an exercise price of 600.4 yuan, corresponding to a potential upside of around 15%, and offer a leverage effect of over 8 times, which can effectively amplify returns. Notably, these two call warrants have relatively low implied volatility, meaning the time value decays more slowly, making them suitable for holding until the stock price breaks through the target level—especially for investors expecting CATL’s price to trend upwards with some fluctuations.
If you believe the stock price will oscillate within the current range and test support levels, $SG#CATL RC2609A.C (59850.HK)$ is a good choice. Its recovery price is set at 468 yuan, below our second support level of 477 yuan, providing approximately 10% downside buffer space, effectively avoiding forced recovery risks. This bull certificate has a leverage ratio of 6.3 times and is among the lowest premium products in its category, offering clear cost advantages, making it suitable for investors who expect the stock price to rebound from support levels.
For investors who are bearish on the future market and believe that the stock price will fall below the first support level at 496 yuan, they might consider $UB#CATL RP2812A.P (59966.HK)$. Its recovery price is set at 550 yuan, about 5% higher than the current stock price, providing a certain degree of upward buffer. This bear certificate offers a high leverage ratio of 9.3 times, maximizing gains from falling prices, and also boasts the lowest premium advantage, highlighting its cost efficiency, making it ideal for investors expecting short-term adjustments in CATL’s performance.
$CATL (03750.HK)$ The stock performed strongly today, with its price surging nearly 4%, closing at noon at 527 yuan, and even touching an intraday high of 532 yuan, setting a one-month record. From a technical perspective, the stock successfully broke above three key moving averages: MA10 (501.05 yuan), MA30 (492.02 yuan), and MA60 (492.90 yuan), indicating strong short-term momentum. There are some interesting divergence signals in the technical indicators. The Stochastic Oscillator issued a buy signal, and the MACD also showed a buy signal, consistent with the stock's strong performance. However, the summary signal from the technical indicators suggests selling, with a strength of 8, reflecting some caution in the market. The RSI indicator is at 66, which, although still within the neutral zone, is approaching the overbought threshold of 70, and investors need to be mindful of short-term pullback risks. In terms of key price levels, current support is set at 496 yuan (Support 1) and 477 yuan (Support 2), while resistance lies at 546 yuan (Resistance 1) and 569 yuan (Resistance 2). Currently, the stock price is only 4.4% away from Resistance 1 but has a buffer of 5.4% to Support 1, making the technical outlook overall positive. The Williams %R indicator shows an overbought condition but gives a neutral signal, and the CCI indicator remains neutral as well. This divergence in technical indicators often indicates that the stock price may enter a consolidation phase. With a trading volume of 925 million yuan, market participation is quite active, providing liquidity support for future movements...
How do you interpret the current divergence in technical indicators for CATL? Would you choose to continue buying at the current price or wait for a pullback to the support level before taking a position?
Feel free to share your thoughts and trading strategies in the comment section, and don’t forget to check out other insightful analysis articles from the 'HK Stock Warrants Jenny' account!
#Ningde Era #03750 #Technical Analysis #Hong Kong Stocks #New Energy #Battery Stocks #Short-term Trading #Support and Resistance #RSI #MACD
Risk Disclaimer: The above content only represents the author's view. It does not represent any position or investment advice of Futu. Futu makes no representation or warranty.Read more
Thumbs Up
4
50K Views
Report
Comments
Write a Comment...
4
5