
How to view the post-holiday market trend in Hong Kong stocks?

[HKEX Podcast] Consolidated Viewpoints: Daily, Weekly, and Monthly Chart Resonance Breakout, Downside Risks Should Not Be Overlooked
COSL (2883) closed at HKD 9.69 today, up 1.25%. Yesterday (February 11), the stock hit a 52-week high of HKD 9.57 during trading and successfully broke through the upper Bollinger Band with strong turnover. However, while the price surged to new highs, multiple technical indicators showed divergence. [HKEX Podcast] also explicitly pointed out that 'price-volume divergence is emerging, upside potential is limited.' This article analyzes short-term trading perspectives on COSL based on technical data, the latest market dynamics, and warrant performance.
Technical Analysis: Hidden Concerns Behind the Breakout
Looking at key levels today, the first short-term resistance for COSL is at HKD 9.83, which serves as the last line of defense before the round-number level. A successful breakout would point to the next resistance at HKD 10.4. On the downside, the first support is at HKD 8.86, close to the 10-day moving average of HKD 8.91, forming the initial support zone for pullbacks. If this level fails, further downside could test deeper support at HKD 8.15.
However, a combination of technical indicators has issued strong warnings. According to February 11 data, COSL’s comprehensive technical indicator signal is 'sell' with an intensity of 10. Multiple oscillators are showing significant divergence: the Williams %R is in overbought territory and signaling a sell, the stochastic oscillator is also in overbought territory with bearish signals, and the CCI indicator, though neutral, has retreated from its peak. More importantly, the Rate of Change (ROC) indicator shows a 'top divergence, sell' signal. The Relative Strength Index (RSI) stands at 77, entering technically overbought territory. It’s worth noting that although the daily chart reflects a breakout, indicators like MACD, Bollinger Bands, and Ichimoku Cloud still maintain buy signals, suggesting the long-term trend remains intact. Nevertheless, short-term overbought pressures are building.
【Hong Kong Stock Podcast】Host Simon’s perspective aligns closely with this view. He pointed out that Hai Tian's trading volume today retreated slightly compared to yesterday, showing a 'volume-price divergence' trend; more notably, the company's share price has broken through the upper Bollinger Bands of the daily, weekly, and monthly timeframes—a rare technical phenomenon that historically often indicates an overly rapid short-term rally, with subsequent pullback risks not to be overlooked. In other words, while the share price is hitting new highs, the emotions of 'chasing highs' and 'caution' are simultaneously fermenting in the market.
Market News: Business expansion proceeding orderly, but stock price already reflects expectations
From a fundamental dynamics perspective, Hai Tian released multiple tender announcements on February 11, including laser drilling and slot processing contracting services for projects such as DF and QHD, along with purchases of equipment parts like drilling fluid hoisting slips, pipe handling machines, and top drives—all funded by corporate self-raising and already secured. These tenders are part of the company’s regular business expansion, reflecting normal operational rhythm, but their stimulating effect on the short-term stock price is limited—after all, the stock price rose nearly 20% from HKD 8 to HKD 9.57 over the past month, meaning some positive factors may have been priced in advance.
Warrant Product Review: Two-day gains demonstrate tracking capability
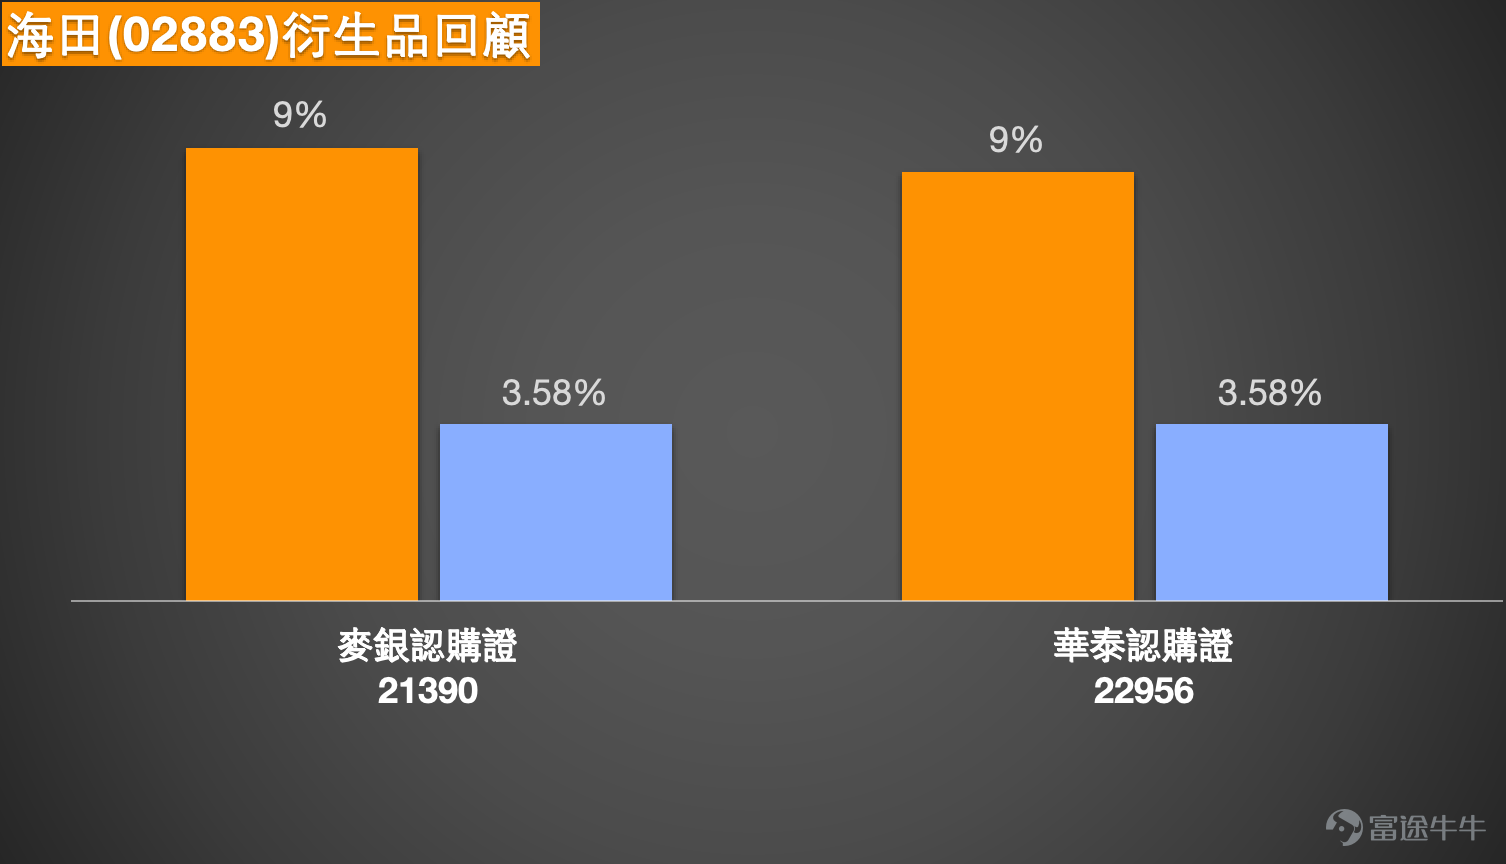
Reviewing the two Hai Tian warrants mentioned on February 9, their performance over the following two days clearly demonstrated the efficiency of derivative tracking. Huatai Call Warrant (22956) recorded a 19% increase during this period, while Maiyin Call Warrant (21390) rose 16%, compared to the underlying stock’s 6.93% gain. Through fixed leverage structures, these warrants provide investors with more flexible short-term trading tools. $HU-COSL@EC2612A.C (22956.HK)$$MB-COSL@EC2612A.C (21390.HK)$
![$CHINA OILFIELD (02883.HK)$ [Share Link: February 11 [HKEX Podcast] Hang Seng Index, Xiaomi, BYD, Ping An, COSL, Trip.Com] COSL (2883) closed at HKD 9.69 today, up 1.25%. Yesterday (February 11), the stock hit a 52-week high of HKD 9.57 during trading and successfully broke through the upper Bollinger Band with strong turnover. However, while the price surged to new highs, multiple technical indicators showed divergence. [HKEX Podcast] also explicitly pointed out that 'price-volume divergence is emerging, upside potential is limited.' This article analyzes short-term trading perspectives on COSL based on technical data, the latest market dynamics, and warrant performance. Technical Analysis: Hidden Concerns Behind the Breakout Looking at key levels today, the first short-term resistance for COSL is at HKD 9.83, which serves as the last line of defense before the round-number level. A successful breakout would point to the next resistance at HKD 10.4. On the downside, the first support is at HKD 8.86, close to the 10-day moving average of HKD 8.91, forming the initial support zone for pullbacks. If this level fails, further downside could test deeper support at HKD 8.15. However, a combination of technical indicators has issued strong warnings. According to February 11 data, COSL’s comprehensive technical indicator signal is 'sell' with an intensity of 10. Multiple oscillators are showing significant divergence: the Williams %R is in overbought territory and signaling a sell, the stochastic oscillator is also in overbought territory with bearish signals...](https://nnqimage.futunn.com/sns_client_feed/1162342/20260212/web-1770868223335-6SsHVTvhse.png/big?area=1&is_public=true&imageMogr2/ignore-error/1/format/webp)
Warrant Product Recommendations and Terms Analysis: Deployment logic behind the exercise price of HKD 8.83
Given Hai Tian’s current trend, there are limited call warrant options available for deployment, but existing products are highly correlated with technical price levels. The exercise prices for both Huatai Call (22956) and Maiyin Call (21390) are set at HKD 8.83, which is close to Hai Tian’s short-term first support level at HKD 8.86, making them slightly in-the-money terms. Among these, 22956 offers the lowest premium and implied volatility within its category, indicating relatively moderate time decay and appealing to cost-conscious investors. Meanwhile, 21390 provides 3.1x leverage—the highest among comparable products—with similarly low implied volatility. Both products have similar terms, but investors should note that the current stock price of HKD 9.57 is significantly above the HKD 8.83 exercise price, meaning both are in-the-money warrants heavily reliant on continued upside movement of the underlying stock—if the price fails to break through HKD 9.83 or even retreats to the support zone, the downside risk for the warrant prices must also be considered.
Interactive Q&A Session:
Do you think Hai Tian will first break through the resistance at HKD 9.83, or first retest the support at HKD 8.86?
A. First break through HKD 9.83
B. First test 8.86 yuan
C. Consolidate between the two levels
Feel free to leave a comment with your choice, and follow Jenny's HK stock options for more product comparison insights!
Friendly reminder: This article does not constitute any investment advice.
This article is for reference only and does not constitute any investment advice. The market data, opinions, and analysis contained herein may change at any time without prior notice. We are not responsible for any loss or damage caused by reliance on the information in this article. Technical analysis only shows whether certain technical conditions are met; a comprehensive assessment of asset performance should combine other data and should not solely rely on this article to make trading decisions. Please note that past performance is not indicative of future results. Follow Jenny's insights on Hong Kong stock warrants for more professional analysis.
#Haitian #CNOOC Services #02883 #Technical Analysis #Support and Resistance Levels #Warrants #Call Options #Premium #Hong Kong Stock Podcast #Volume-Price Divergence
Risk Disclaimer: The above content only represents the author's view. It does not represent any position or investment advice of Futu. Futu makes no representation or warranty.Read more

Comments
to post a comment
3