
How to view the post-holiday market trend in Hong Kong stocks?

[Warrant Perspective] The Hang Seng Index shows neutral indications across multiple metrics, with a high probability of short-term fluctuations.
On February 11, $Hang Seng Index (800000.HK)$
The overall market trended slightly upward, closing at 27,266.38 points with a gain of 0.31%, continuing its modest upward movement. However, trading volume showed a further decline, with total turnover amounting to 217.218 billion yuan. In our [Hong Kong Stock Broadcast], we commented on the Hang Seng Index: although the index recorded a small increase, the ongoing contraction in trading volume has become a potential concern for the market. The subsequent trend still needs close monitoring.
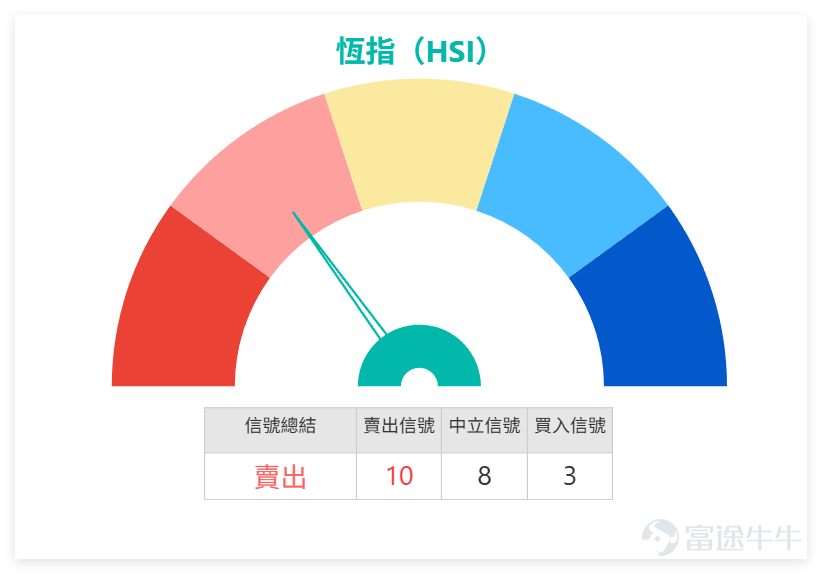
From a technical indicator perspective, the Hang Seng Index’s RSI is 59, indicating a neutral-to-strong region; several oscillators such as MACD, Williams %R, and Stochastic Oscillator all show neutrality, while the CCI signal also indicates neutrality. Bollinger Bands and Ichimoku Cloud give buy signals, but overall technical indicators suggest a sell signal with an intensity of 10.
![On February 11, $Hang Seng Index (800000.HK)$ The overall market trended slightly upward, closing at 27,266.38 points with a gain of 0.31%, continuing its modest upward movement. However, trading volume showed a further decline, with total turnover amounting to 217.218 billion yuan. In our [Hong Kong Stock Broadcast], we commented on the Hang Seng Index: although the index recorded a small increase, the ongoing contraction in trading volume has become a potential concern for the market. The subsequent trend still needs close monitoring. From a technical indicator perspective, the Hang Seng Index’s RSI is 59, indicating a neutral-to-strong region; several oscillators such as MACD, Williams %R, and Stochastic Oscillator all show neutrality, while the CCI signal also indicates neutrality. Bollinger Bands and Ichimoku Cloud give buy signals, but overall technical indicators suggest a sell signal with an intensity of 10. Overall, while the index shows some upward momentum in the short term, insufficient trading volume limits the height of the rebound. Going forward, it will be important to watch for breakouts at the resistance level of 27,704 points and the support level of 26,750 points. On February 11, blue-chip stocks showed divergent trends, with tech stocks mostly showing oversold signs, while some financial stocks faced pullback pressure. The specific technical patterns are as follows: 1. Tencent (00700): closed at HKD 548.00, below key moving averages (MA10: HKD 573.05, MA30: HKD 600.58), RSI at 28, indicating an oversold condition. Technical indicators suggest a buy signal with strength level 9, implying possible short-term rebound momentum. 2, China Mobile (00941)...](https://nnqimage.futunn.com/sns_client_feed/228620/20260212/web-1770859951888-ZXf63mWzYu.png/big?area=1&is_public=true&imageMogr2/ignore-error/1/format/webp)
Overall, while the index shows some upward momentum in the short term, insufficient trading volume limits the height of the rebound. Going forward, it will be important to watch for breakouts at the resistance level of 27,704 points and the support level of 26,750 points.
On February 11, blue-chip stocks showed divergent trends, with tech stocks mostly showing oversold signs, while some financial stocks faced pullback pressure. The specific technical patterns are as follows:
1. Tencent (00700): closed at HKD 548.00, below key moving averages (MA10: HKD 573.05, MA30: HKD 600.58), RSI at 28, indicating an oversold condition. Technical indicators suggest a buy signal with strength level 9, implying possible short-term rebound momentum.
2. China Mobile (00941): closed at HKD 78.45, with the stock price near MA10 (HKD 79.23), RSI at 44, showing neutral-to-weak conditions. Technical indicators suggest a strong buy signal with strength level 12, indicating robust technical support.
3. Meituan (03690): closed at HKD 88.85, with the stock price below MA10 (HKD 92.99) and MA30 (HKD 98.17), RSI at 26, indicating an oversold state. Technical indicators suggest a buy signal with strength level 11, increasing expectations for a rebound after being oversold.
4. Alibaba (09988): closed at HKD 160.10, with the stock price hovering near MA10 (HKD 161.94), RSI at 52, close to neutral. Technical indicators suggest a sell signal with strength level 8, implying a potential minor pullback in the short term.
Among the other blue chips, technical indicators for Hong Kong Exchange (00388) and Sunny Optical (02382) lean towards buying; China Construction Bank (00939) and HSBC Holdings (00005) lean towards selling; AIA (01299) and Geely Auto (00175) remain neutral. Overall market sentiment is cautious, with investors mostly adopting a wait-and-see attitude.
Review of Bull/Bear Warrants & Featured Products:
(1) CBBC Review:
Reviewing the two Hang Seng Index bull contracts recommended on February 5th, their short-term performance was impressive, with specific data as follows: BOC Bull Contract (64765) rose by 14% in two days, and BOC Bull Contract (64010) increased by 13% within the same period, while the Hang Seng Index only rose by 0.53%. This demonstrates the significant leverage effect of derivative products, and also reminds investors that derivatives carry higher volatility and require constant attention to risk.
(2) Warrant Product Selection:
Based on the Hang Seng Index trend and technical signals, we have selected two high-value derivative products, focusing on premium, implied volatility, and reasonable leverage for technical reference only:
1. Guotai Put Warrant (24312): Leverage 11.6, strike price 25100. The core advantage lies in having the lowest premium and implied volatility, offering strong cost controllability, making it suitable for investors who are cautiously optimistic about the short-term trend of the Hang Seng Index.
2. BOC Call Warrant (23128): Leverage 13.3, strike price 28341. It has the lowest implied volatility and higher leverage, offering excellent value for money, and is ideal for investors who expect the Hang Seng Index to break through resistance levels in the short term.
Risk Warning: Investors should note that higher leverage means higher risk in derivative investments. It is recommended to choose products based on your risk tolerance, closely track the underlying stock's movement and changes in technical signals, and adjust your trading rhythm accordingly.
The trading volume of the Hang Seng Index has shrunk. Do you think it will first test the resistance level at 27704 or the support level at 26750? Come share your thoughts in the comments section.
Disclaimer: This article does not constitute any investment advice.
This article is for reference only and does not constitute any investment advice. The market data, opinions, and analysis contained herein may change at any time without prior notice. We are not responsible for any loss or damage caused by reliance on the information in this article. Technical analysis only shows whether certain technical conditions are met; a comprehensive assessment of asset performance should be conducted using additional data. Decisions to trade should not be based solely on this article. Please note that past performance is not indicative of future results.
#HongKongStocks #RealTimeAnalysis #WarrantsSelection #WarrantsStrategy #DerivativesHedging #HangSengIndex #BlueChipStocks #TechnicalAnalysis
Risk Disclaimer: The above content only represents the author's view. It does not represent any position or investment advice of Futu. Futu makes no representation or warranty.Read more

Comments
to post a comment
1