
How to view the post-holiday market trend in Hong Kong stocks?

Tencent Technical Analysis: Buy Signal Emerges in Oversold Zone, Key Support Becomes Battleground for Bulls and Bears
The Hong Kong stock market showed volatility today, $Hang Seng Index (800000.HK)$ pressured to decline after the opening, but then regained upward momentum driven by gold and new energy vehicle stocks. However, the tech giant $TENCENT (00700.HK)$ However, it fell nearly 1% against the market trend, diverging from the broader market movement and drawing attention.
From a technical perspective, Tencent's stock fell against the market trend today, with its price moving further away from key moving averages. It has now clearly broken below the MA10, MA30, and MA60 lines, continuing a weak short-term technical outlook. Nevertheless, multiple oscillation indicators are showing ongoing oversold signals, building momentum for a potential rebound.
In terms of key technical indicators, the RSI is in the oversold region at 28, while the Williams %R indicator shows 'oversold status, neutral signal.' The stochastic oscillator clearly indicates 'in oversold territory, buy,' and the VR trading ratio shows 'oversold, possible bottom forming, buy.' These consistent signals suggest that although the stock price has fallen against the market trend in the short term, the technicals have entered oversold territory, making a technical rebound likely at any time.
Technically speaking, Tencent's current key support levels are located at HK$533 and $497, while resistance levels are near $577 and $606. As the stock price gradually approaches the first support level at $533, this position has become a focal point for both bulls and bears. If the price stabilizes here, it could trigger a technical rebound; otherwise, if this level is breached, the stock may further decline to the $497 support level.
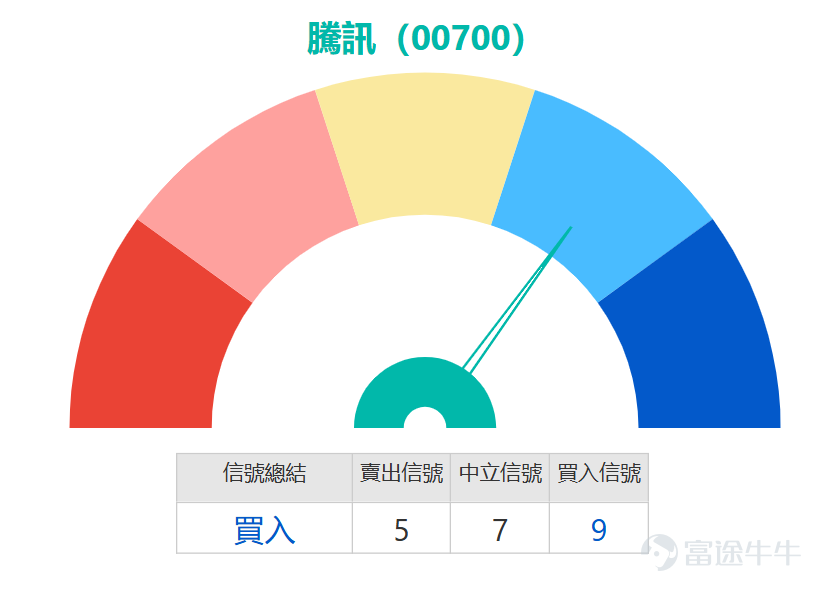
The overall technical indicators give a 'buy' signal with a strength of 9 out of 12 points. Multiple moving average signals indicate a 'strong buy' rating, supported by a 63% probability of an upward move, reflecting a 'buy on weakness' opportunity. Despite today’s counter-trend decline, the technical oversold signals have become even more pronounced, offering long-term investors a chance to buy at lower prices.


Product Review:
Looking back at February 9, 2026, Tencent shares fell by 2.05% over the next two days, during which UBS Group bear contracts $UB#TENCTRP2812L.P (58047.HK)$ rose by as much as 55% over the same period, $UBTENCT@EP2606A.P (21984.HK)$ while other products rose by 16%, and $BI#TENCTRP2812D.P (57847.HK)$and$BITENCT@EP2606A.P (23122.HK)$ gains were respectively 43% and 18%. All derivatives correctly reflected the underlying stock's downward trend, with leveraged bear contracts amplifying returns significantly.

Product Picks:
Selected call warrants:
For investors optimistic about Tencent's stock price rebound, it is recommended to consider $MSTENCT@EC2609A.C (14647.HK)$ , which offers 7.1x leverage with a strike price of 600.5 yuan. Not only does it have the lowest premium in the market, but its implied volatility is also relatively stable, making it highly cost-effective and suitable for medium-term positioning. If the stock price successfully breaks through the resistance level at 577 yuan, significant returns are expected. Another product worth considering is $HSTENCT@EC2609A.C (14683.HK)$ , also with a strike price of 600.5 yuan and offering 6.8x leverage. Its implied volatility is relatively low, making it suitable for investors with moderate risk appetites.
Selected Put Warrants:
For investors concerned about a further decline in Tencent’s stock price, it is recommended to focus on $BITENCT@EP2606A.P (23122.HK)$ , which offers 8.3x leverage with a strike price of 499.8 yuan. Not only does it have the lowest premium in the market, but its implied volatility is also relatively stable, making it suitable for hedging medium- to short-term downside risks. If the stock price falls below the support level at 533 yuan, this put warrant is expected to deliver significant returns. Another option is $UBTENCT@EP2606A.P (21984.HK)$ , also with a strike price of 499.8 yuan and providing 8x leverage. Its implied volatility is relatively low, making it suitable for investors with slightly lower risk tolerance.
Selected Bull Contracts:
For investors optimistic about Tencent's stock price rebound, it is recommended to focus on $UB#TENCTRC2607C.C (63303.HK)$ , which offers 24.8x effective leverage and a recovery price of 530 yuan. Not only does it have the lowest premium, but its effective leverage ratio is also relatively high, maintaining an appropriate distance from the support level at 533 yuan, thereby reducing the risk of forced recovery. Another choice is $JP#TENCTRC2609N.C (58313.HK)$ , with a recovery price of 531 yuan, offering 24.8 times actual leverage. The leverage price is relatively high, making it suitable for short-term investors with higher risk tolerance. If the stock price successfully holds above the 533-yuan support level and rebounds, these two bull contracts are expected to deliver substantial returns.
Bear Contract Picks:
For investors expecting Tencent's stock price to undergo an adjustment, we recommend paying attention to $JP#TENCTRP2812H.P (54580.HK)$ , which offers 8.7 times actual leverage with a recovery price of 618 yuan. Not only does it have the highest actual leverage ratio, but its premium is also at a relatively low level, maintaining an appropriate distance from the 577-yuan resistance level, resulting in a lower forced recovery risk, making it suitable for short-term trading. Another option is $BI#TENCTRP2812C.P (56551.HK)$ , with a recovery price of 614.8 yuan, providing 9.1 times actual leverage. Its leverage price is relatively high, catering to investors with higher requirements for leverage ratios.

What’s your take on Tencent's current technical trend? How reliable do you think the oversold signals are? In the current market environment, would you choose to position near the support level or wait for clearer breakout signals? Feel free to share your trading strategies and market views.
Don’t forget to follow the 'HK Stock Warrants Jenny' account for more in-depth technical analysis content.
Friendly reminder: This article is for reference only and does not constitute any investment advice. Market data, opinions, and analyses contained herein may change at any time without prior notice. We are not responsible for any loss or damage caused by reliance on the information in this article. Technical analysis only shows whether certain technical conditions are met; asset performance should be comprehensively evaluated using other sources, and trading decisions should not be made solely based on this article. Please note that past performance is not indicative of future results.
#Tencent Technical Analysis #Hong Kong Stock Technology Stocks #Oversold Rebound #Support and Resistance Analysis #Williams Indicator #RSI Oversold #VR Indicator #Technical Buy #Hong Kong Stock Investment #Short-term Trading Strategy
Risk Disclaimer: The above content only represents the author's view. It does not represent any position or investment advice of Futu. Futu makes no representation or warranty.Read more

Comments (2)
to post a comment
2
1