
How to view the post-holiday market trend in Hong Kong stocks?

Profit-taking after China Life hits new high, intensifying bulls vs. bears battle
$CHINA LIFE (02628.HK)$ The stock initially rose then pulled back today, surging to a high of 36.16 yuan during trading, hitting a 52-week peak. However, the share price quickly faced pressure and retreated after reaching this new high, closing at 34.54 yuan by midday, down 2.76%, with a turnover of 1.01 billion yuan, reflecting profit-taking pressure in the market at higher levels and an intensifying tug-of-war between buyers and sellers.
From a key technical level perspective, the current share price is at an important inflection point. Support level 1 is at 33.1 yuan, support level 2 at 31.2 yuan; these two levels will become crucial short-term defensive lines. Resistance level 1 is set at 37.0 yuan, resistance level 2 at 37.9 yuan, and today's 52-week high of 36.16 yuan is nearing resistance level 1, indicating notable technical pressure at this position.
The moving average system shows mixed signals: the current share price of 34.54 yuan is slightly below the 10-day moving average of 34.65 yuan, suggesting some weakening of short-term momentum. However, it is worth noting that the share price remains firmly above the 30-day moving average of 32.75 yuan and the 60-day moving average of 30.082 yuan, reflecting that the medium- to long-term uptrend structure remains intact. This technical pattern indicates a normal technical pullback after the stock hit a new high.
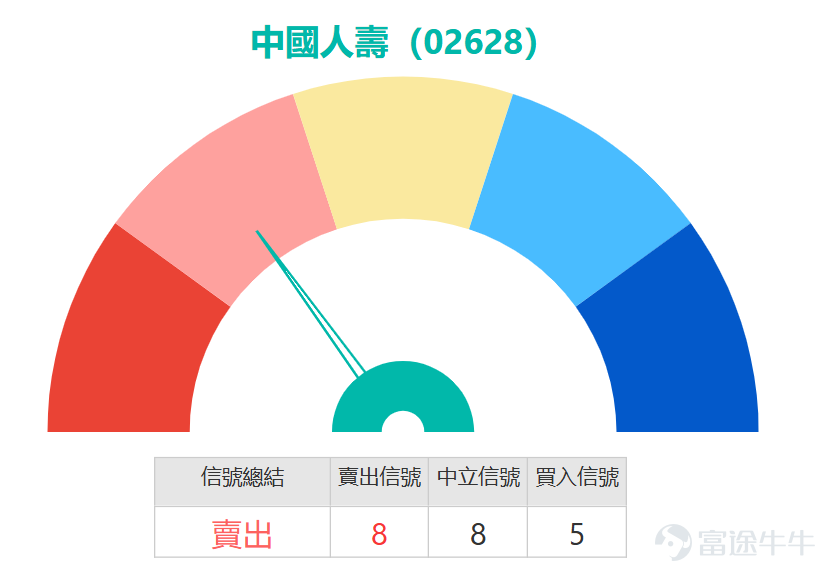
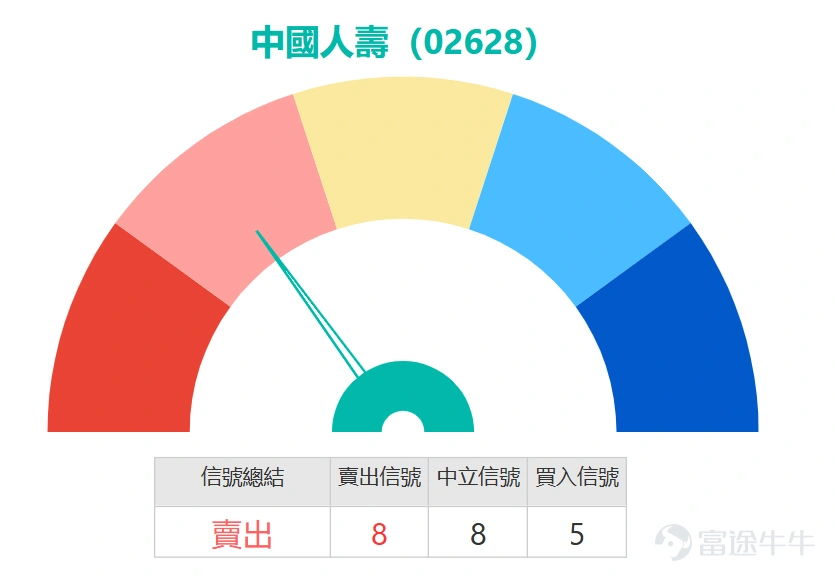
Key technical indicators are sending important signals: the stochastic oscillator clearly shows a 'sell signal,' implying adjustment pressure following short-term overbought conditions. The CCI indicator remains 'neutral,' offering no clear directional guidance. The RSI indicator is at 62, within a moderately strong neutral zone, neither entering overbought territory nor being far from oversold territory, leaving room for future moves.
The technical indicator summary signal shows a "sell" rating with a strength of 8 out of 12, a signal that professional investors should pay close attention to. Multiple oscillation indicators show divergence: stochastic indicators are bearish while CCI remains neutral. This inconsistency in technical indicators often signals that the market is at a critical turning point.
For short-term traders, it is recommended to closely monitor the defense of the support level at 33.1 yuan. If the stock price can hold above this level and regain footing above the 10-day moving average, the consolidation after the new high may end. If it breaks below 33.1 yuan, it may further test the support level at 31.2 yuan.
Medium-term investors can focus on the key support of the 30-day moving average at 32.75 yuan. As long as this level is not effectively broken, the medium- to long-term uptrend will remain intact. On the upside, a decisive breakout above the resistance level at 37.0 yuan is needed to open up new upward momentum.

Product Review:
Looking back at February 5, 2026, China Life Insurance recorded a notable increase of 2.46% over the following two trading days, while the mentioned $JPCLIFE@EC2607B.C (24393.HK)$ The increase reached 16% over two days. $MSCLIFE@EC2607B.C (24364.HK)$and$MS#CLIFERC2612C.C (61603.HK)$ also rose by 15% and 11%, respectively, delivering impressive results. This indicates that selecting appropriate warrant or bull certificate products when the underlying stock confirms an uptrend can significantly enhance the overall return of an investment portfolio.

Product Picks:
Selected Call Warrants: Positioning for Breakout and Rebound Opportunities
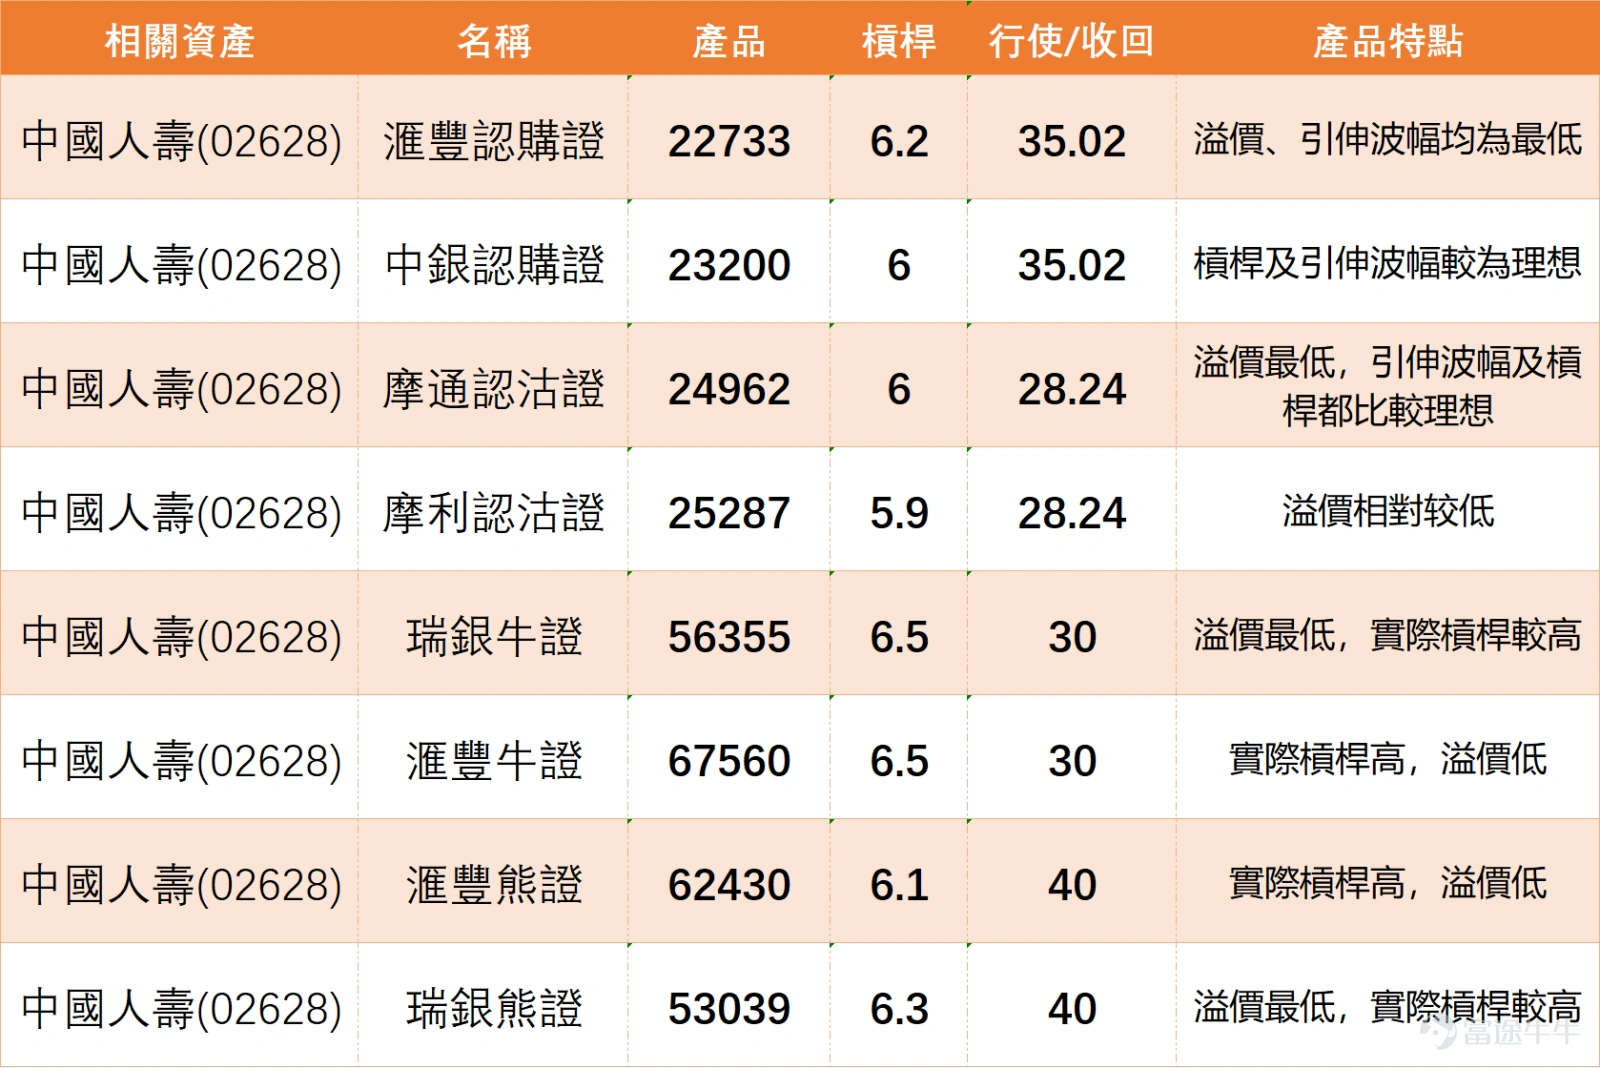
For investors optimistic about China Life Insurance breaking through the 37.0 yuan resistance level, it is recommended to consider $HSCLIFE@EC2605A.C (22733.HK)$ , which offers 6.2x leverage with a strike price of 35.02 yuan. Not only does it have the lowest premium in the market, but its implied volatility is also relatively stable, offering excellent value for medium-term positioning. If the stock successfully breaks through the 37.0 yuan resistance level, substantial returns are expected. Another noteworthy product is $BICLIFE@EC2605A.C (23200.HK)$ , also with a strike price of 35.02 yuan, offering 6x leverage. Its leverage ratio and implied volatility combination are ideal, making it suitable for investors with moderate risk appetites.
Selected Put Warrants: Hedging Adjustment Risks
For investors concerned about the stock price falling below the support level of 33.1 yuan, it is recommended to focus on $JPCLIFE@EP2607A.P (24962.HK)$ , a product offering 6x leverage with an exercise price of 28.24 yuan. Not only does it have the lowest premium, but its combination of implied volatility and leverage ratio is also relatively ideal for hedging medium-term downside risk. If the stock price falls below the 33.1 yuan support level, this put warrant is expected to deliver significant returns. Another option is $MSCLIFE@EP2607B.P (25287.HK)$ , which has the same exercise price of 28.24 yuan and provides 5.9x leverage with a relatively lower premium, making it suitable for investors with a slightly lower risk tolerance.
Bull Certificate Selection: Capture Rebound Momentum
For investors optimistic about a stock price rebound, it is recommended to focus on $UB#CLIFERC2707A.C (56355.HK)$ , a product that offers 6.5x effective leverage with a call price of 30 yuan. It not only has the lowest premium but also maintains a higher effective leverage ratio, keeping an appropriate distance from the 33.1 yuan support level, thereby posing a relatively low risk of forced redemption. This makes it suitable for medium-term investors to hold. Another option is $HS#CLIFERC2712B.C (67560.HK)$ , which also has a call price of 30 yuan and provides 6.5x effective leverage with a low premium, making it suitable for short-term investors with a higher risk tolerance. If the stock price successfully holds above the 33.1 yuan support level and rebounds, these two bull certificates are expected to deliver considerable returns.
Bear Certificate Selection: Positioning for Adjustment Trends
For investors expecting the stock price to undergo an adjustment, it is recommended to focus on $HS#CLIFERP2802C.P (62430.HK)$ , a product offering 6.1x effective leverage with a call price of 40 yuan. Not only does it have a high effective leverage ratio, but its premium is also at a relatively low level, maintaining an appropriate distance from the 37.0 yuan resistance level, thus posing a relatively low risk of forced redemption, making it suitable for short-term trading. Another option is $UB#CLIFERP2805D.P (53039.HK)$ , the strike price is also 40 yuan, offering 6.3 times actual leverage, the lowest premium, with a relatively high actual leverage ratio, suitable for investors who require higher leverage ratios. If the stock price falls below the support level of 33.1 yuan, these two bearish warrants are expected to deliver significant returns, but strict stop-loss measures should be set to avoid losses from a stock price rebound.
What is everyone's view on China Life Insurance’s technical pullback after hitting a 52-week high?
Do you think this is a healthy technical consolidation or the start of a trend reversal? Feel free to share your technical analysis views and trading strategies. Also, we recommend following the "Hong Kong Warrants Jenny" account for more in-depth technical analysis.
Friendly reminder: This article is for reference only and does not constitute any investment advice. Market data, opinions, and analyses contained herein may change at any time without prior notice. We are not responsible for any loss or damage caused by reliance on the information in this article. Technical analysis only shows whether certain technical conditions are met; asset performance should be comprehensively evaluated using other sources, and trading decisions should not be made solely based on this article. Please note that past performance is not indicative of future results.
#China Life Insurance #02628 #52-week high #Technical Analysis #Hong Kong Stock Insurance Stocks #Support and Resistance #Moving Averages #Stochastic Oscillator #Profit Taking #Professional Investment Strategies$Hang Seng Index (800000.HK)$$PING AN (02318.HK)$
Risk Disclaimer: The above content only represents the author's view. It does not represent any position or investment advice of Futu. Futu makes no representation or warranty.Read more
Comments
to post a comment
1