
How to view the post-holiday market trend in Hong Kong stocks?

JD.com Short-term Technical Analysis: Stock Price Breaks Above Key Platform, Focus on Business Integration and Industry Impact
As of February 10, 2026, JD.com Group (09618.HK) stock closed at HKD 110.1, with a gain of 2.04%. Amid a strengthening Hang Seng Index market environment, JD.com's stock performance has outpaced the broader market. Recently, two key market dynamics have significantly impacted its stock price trend: first, the company’s internal business integration efforts have achieved positive interim progress, providing intrinsic support for the stock price; second, industry-level regulations regarding labor rights protection for new employment forms have sparked widespread market discussions about operational costs for related companies. JD.com’s adaptability in this area is widely considered by the market to demonstrate strong resilience.
Technical Analysis: Short-term Indicators Neutral, Focused on the Battle for the Key Platform at HKD 110
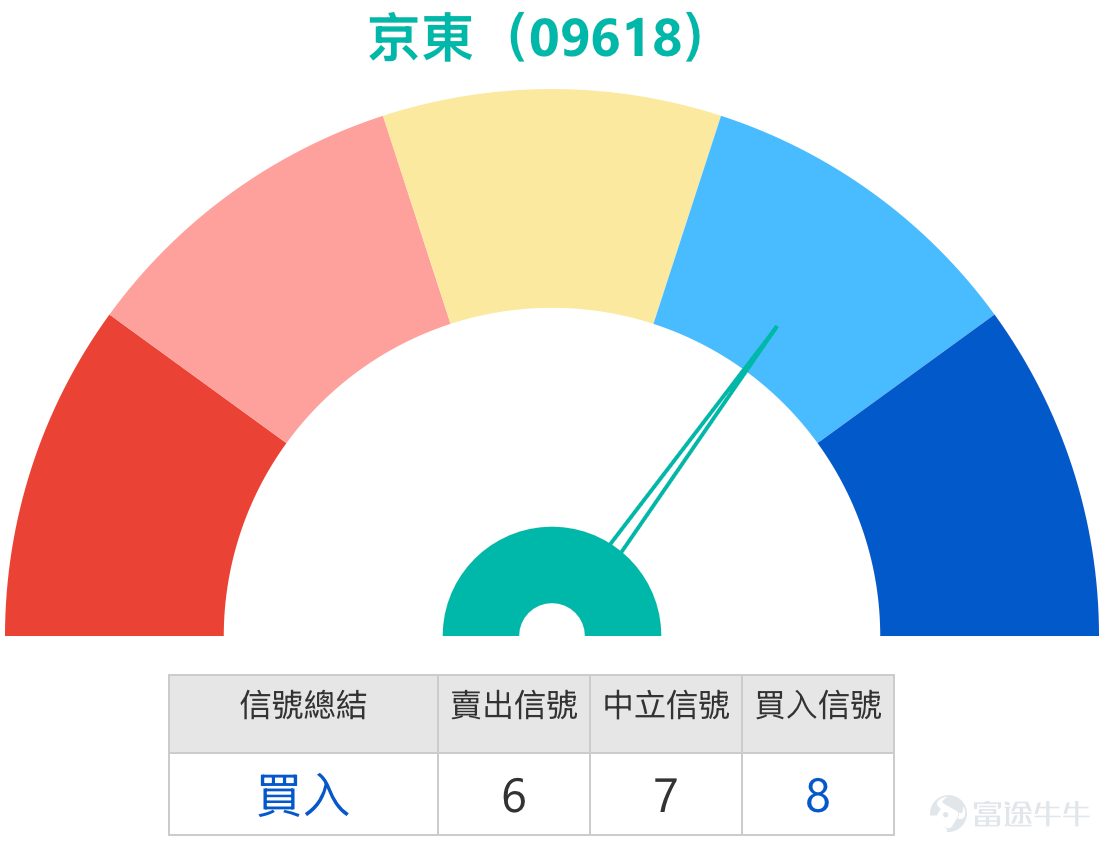
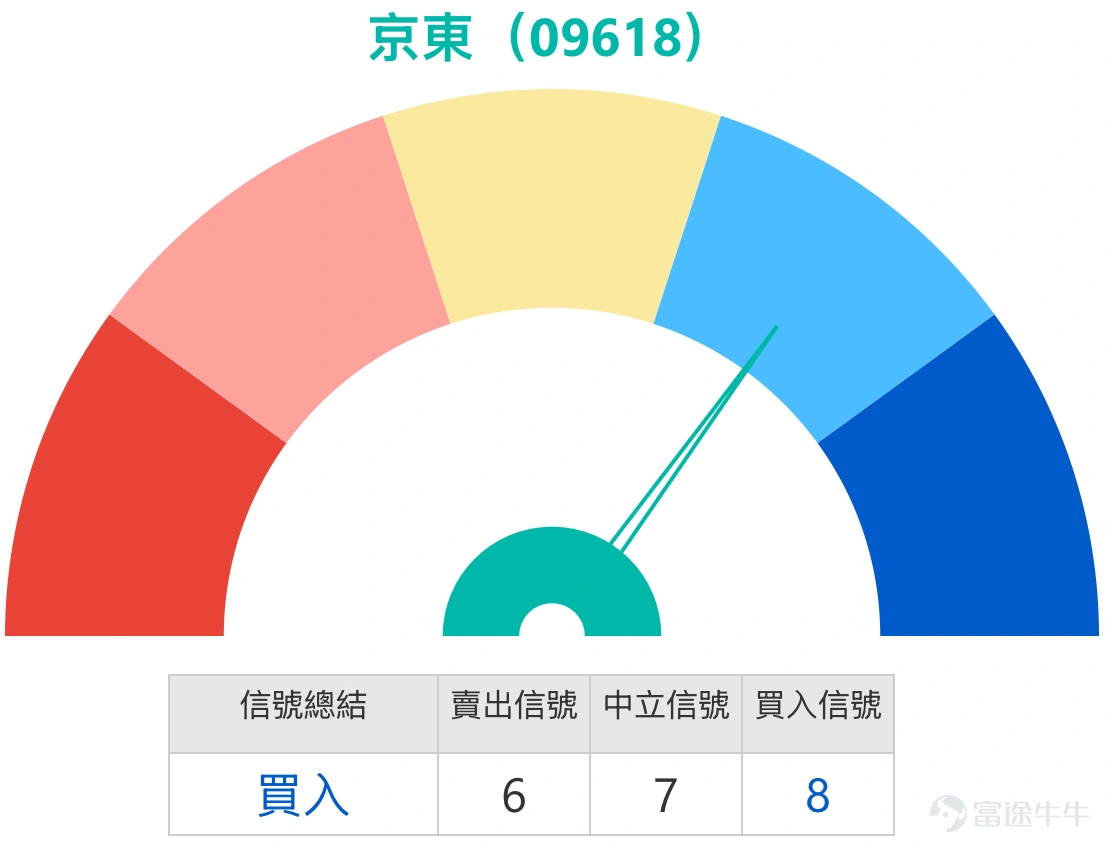
From a technical chart perspective, JD.com's stock price is currently in a critical balance zone. At the close of trading that day, the stock price was HKD 110.3, nearly overlapping with the 10-day moving average (HKD 110.53) and the 30-day moving average (HKD 112.99), indicating that the short-term stock price trend is within a neutral oscillation range. The 14-day Relative Strength Index (RSI) stands at 42, also within the neutral range, showing no signs of being overbought or oversold. Analyzing various oscillation indicators reveals that the current forces of buyers and sellers are temporarily balanced. Notably, the stock price remains below the 60-day moving average (HKD 113.56), implying that the medium- to long-term trend has not yet strengthened fundamentally. Therefore, whether the stock can effectively stabilize above the HKD 110 to HKD 112.99 dense moving average zone in the short term will be the key determinant for whether the short-term upward trend can continue.
Key Support and Resistance Levels Analysis: Focus on the Range Between HKD 106.4 and HKD 114.3
In the current consolidation pattern, identifying core technical levels is crucial for predicting subsequent stock price movements.
On the support side, the primary short-term support level is at HK$106.4. This price level serves as the lower boundary of the recent trading range and is a key defense line for maintaining the short-term consolidation pattern. If the stock price falls below this support level, it may further test the second support level at HK$102.2, which is expected to provide strong support.
On the resistance side, the key short-term resistance level is at HK$114.3. This price level is not only close to the 60-day moving average but also a critical test point for whether the stock price can break through the current trading range, open up upward momentum, and reverse the intermediate-term downtrend. If the stock price can effectively break through this resistance level, the next target will be the strong resistance zone at HK$118.4.
Review of Warrants and Bull/Bear Contracts
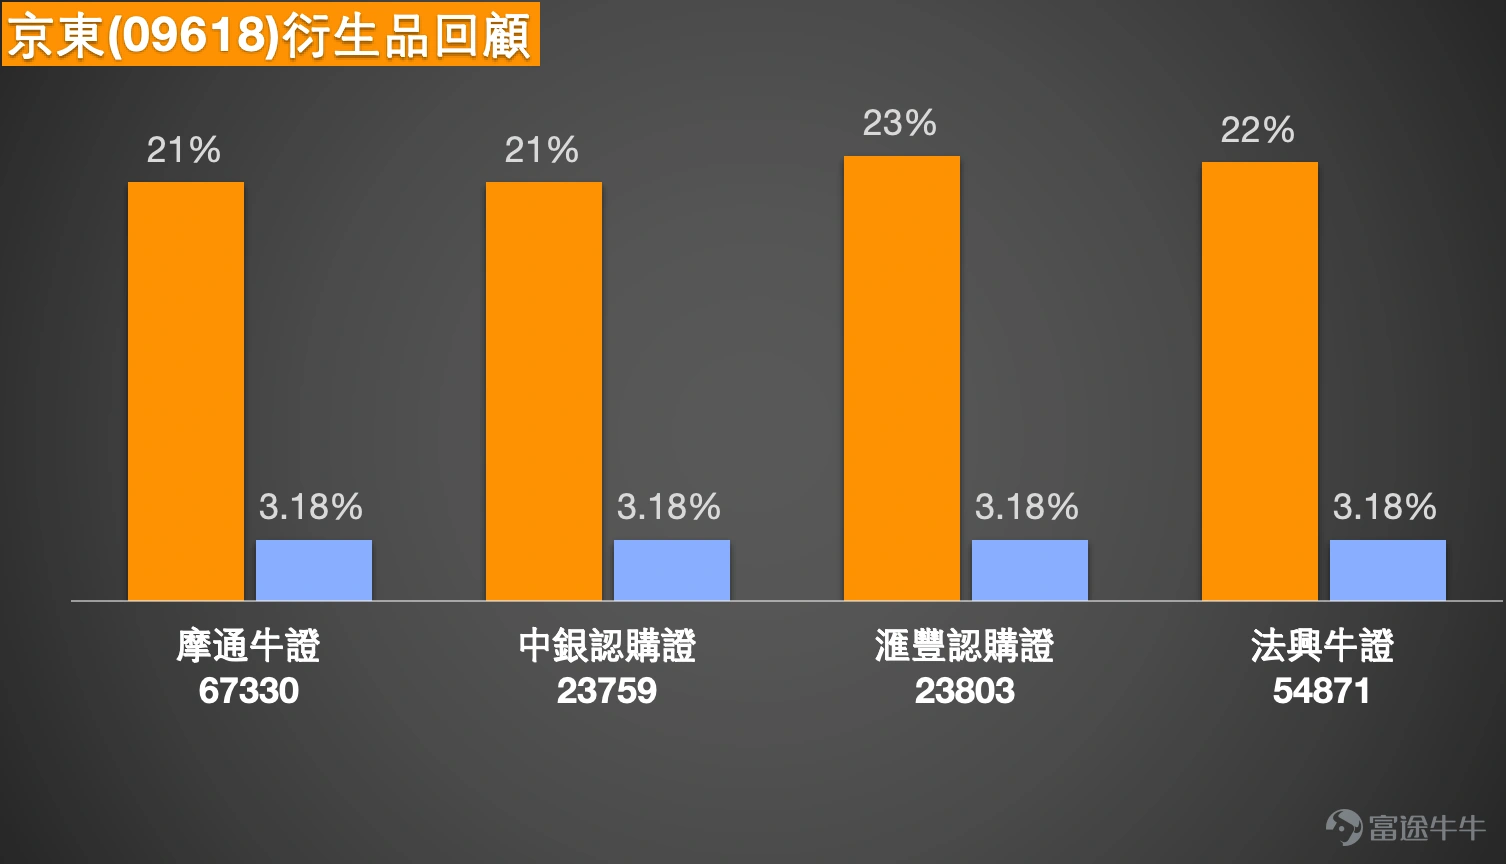
Reviewing the performance of related financial derivatives mentioned on February 6, JD.com's underlying stock rose by a cumulative 3.18% in the following two trading sessions. Driven by the leverage effect, related bullish derivatives achieved significant gains. Among them, HSBC call warrants (23803) $HSJDCOM@EC2605A.C (23803.HK)$ , BOC call warrants (23759) $BIJDCOM@EC2605A.C (23759.HK)$ rose by 23% and 21%, respectively; Societe Generale bull contracts (54871), J.P. Morgan bull contracts (67330) $JP#JDCOMRC2612A.C (67330.HK)$ also gained 22% and 21%. This market performance once again confirms that when the underlying stock shows clear directional momentum, warrants and bull/bear contracts, leveraging their inherent leverage characteristics, can provide investors with efficient capital utilization channels. While amplifying potential returns, they simultaneously magnify investment risks.
Analysis of Product Terms and Related Deployment Under Current Market Conditions
Considering JD.com's current stock price is at a critical moving average area and faces resistance testing, combined with the aforementioned core technical levels, we provide the following derivative product analysis and deployment strategies for investors with different market views.
For investors who anticipate that the stock price will break through the current trading range and continue its upward trend, bullish derivatives should be closely monitored. Regarding warrants, HSBC call warrants (23803) and BOC call warrants (23759) with an exercise price of HK$126.98 have relatively high allocation value. This exercise price is significantly higher than the second resistance level (HK$118.4). If the stock price breaks out, these products are expected to deliver high leveraged returns. Among them, the premium and implied volatility of HSBC call warrants are relatively low, making the time decay cost more reasonable. For bull contracts, Societe Generale bull contracts (54871) $SG#JDCOMRC2612A.C (54871.HK)$ , J.P. Morgan bull contracts (67330) $JP#JDCOMRC2612A.C (67330.HK)$ have forced call levels set at HK$96 and HK$95, respectively, both significantly below the first support level (HK$106.4) and the second support level (HK$102.2), offering investors ample risk buffer space. These are suitable for investors who are optimistic about the stock's trend, prioritize risk management, and pursue stable operations.
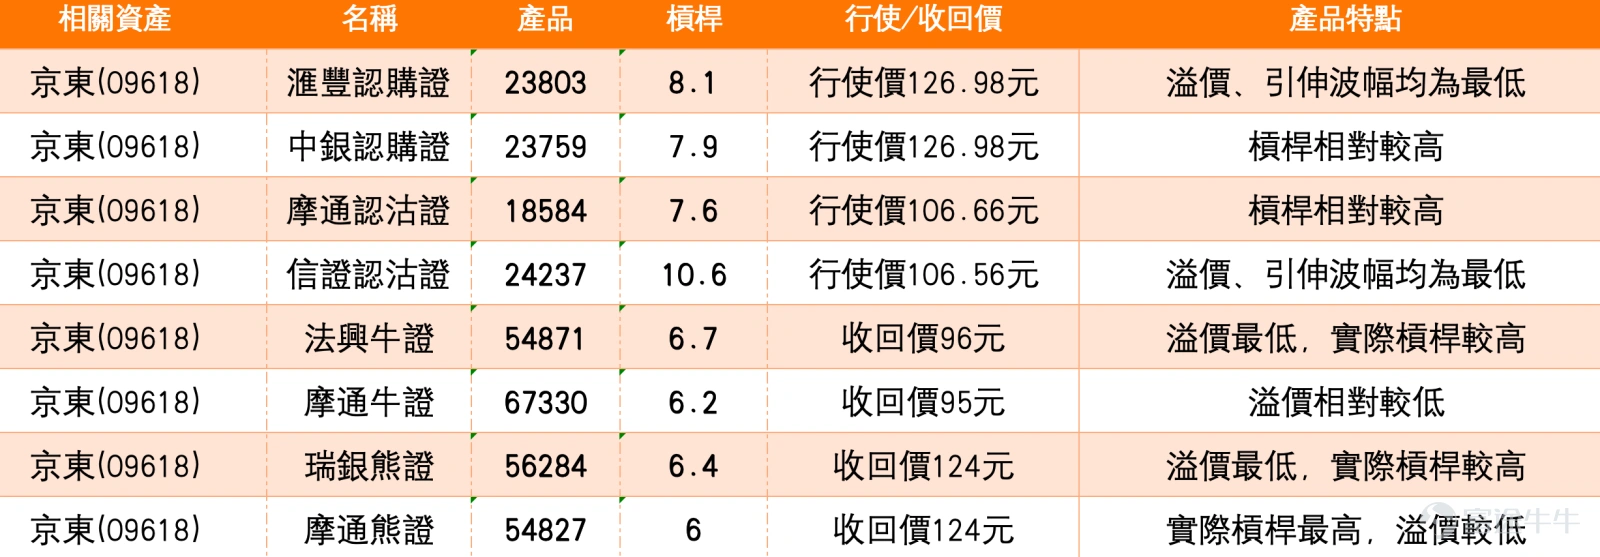
Investors who believe that cost concerns triggered by the industry will limit upside potential in the stock price, or anticipate a pullback near resistance levels, may consider bearish derivatives. In particular, J.P. Morgan put warrants (18584) with a strike price close to HKD 106.4 (first support level) $JPJDCOM@EP2604A.P (18584.HK)$ , CMBI put warrants (24237) $CIJDCOM@EP2604A.P (24237.HK)$ are worth special attention. If the share price fails to hold above the key platform of HKD 110 and moves lower to test support levels, these products can serve as effective hedging tools or vehicles for expressing views. Among them, CMBI put warrants have the lowest premium and implied volatility, offering an advantage in terms of reduced potential value erosion. On the bear certificate side, UBS Group bear certificates (56284) $UB#JDCOMRP2808B.P (56284.HK)$ , J.P. Morgan bear certificates (54827) $JP#JDCOMRP2812B.P (54827.HK)$ have their stop-loss levels set at HKD 124, significantly higher than the first resistance level (HKD 114.3). Unless there is an unexpected surge in the share price, the risk of hitting the stop-loss level is relatively low. These products are suitable for investors who expect limited upside in the stock price rebound and are cautious about short-term trends.
Engagement and Reflection
Currently, JD.com's stock price is fluctuating around the key level of HKD 110.3, with clear short-term trading parameters: resistance at HKD 114.3 above and support at HKD 106.4 below.
From a purely technical analysis perspective, and considering the current moving average configuration and core technical levels, which of the following scenarios do you think is more likely for JD.com's stock price in the short term:
1. Testing resistance upward: The stock price has moved above the short-term cluster of moving averages, and after some consolidation, it may attempt to test the key resistance at HKD 114.3.
2. Retracing to support: With the medium- to long-term trend still unclear, the stock price might first retreat to the HKD 106.4 level to confirm the effectiveness of this support.
Feel free to share your technical insights and analytical logic in the comments section. The process of market long-short contention is also a collision of industry knowledge and investment wisdom; we look forward to everyone's professional contributions. For more updates on Hong Kong stock derivatives and strategy analysis, stay tuned for Jenny's expert sharing on Hong Kong warrants.
Disclaimer: This article does not constitute any investment advice.
This article is for reference only and does not constitute any investment advice. The market data, opinions, and analysis contained herein may change at any time without prior notice. We are not responsible for any loss or damage caused by reliance on the information in this article. Technical analysis only shows whether certain technical conditions are met; a comprehensive assessment of asset performance should be conducted using additional data. Decisions to trade should not be based solely on this article. Please note that past performance is not indicative of future results.
#JD Group #Technical Analysis #Support and Resistance Levels #Warrants #Bull and Bear Certificates #Jiabao Supermarket #Business Integration #New Employment Forms #Derivatives #Leverage Trading
Risk Disclaimer: The above content only represents the author's view. It does not represent any position or investment advice of Futu. Futu makes no representation or warranty.Read more

Comments
to post a comment
5