
How to view the post-holiday market trend in Hong Kong stocks?

Short-term Technical Analysis of HSBC Holdings: Historical High Reached Ahead of Earnings, Intense Battle Between Bulls and Bears
$HSBC HOLDINGS (00005.HK)$As of the close on February 9, the share price of HSBC Holdings (00005.HK) closed at HKD 139.3, a single-day increase of 3.34%, reaching an intraday high of HKD 139.5, setting a new historical record. This robust performance closely matches the forecast mentioned in the February 9 [Hong Kong Stocks Podcast] of 'approaching HKD 140' and the market's 'diverse expectations' regarding the earnings report, indicating that market sentiment about the company’s prospects is rapidly materializing during trading. Notably, its American Depositary Receipts (ADRs) rose approximately 1.8% overnight to HKD 141.8, suggesting short-term sentiment remains optimistic.
Technical Analysis: The Tug-of-War Between Overheated Short-Term Indicators and Medium- to Long-Term Trends
The current technical chart of HSBC shows the typical coexistence of 'new highs' and 'overbought indicators,' with bullish and bearish signals intertwined.
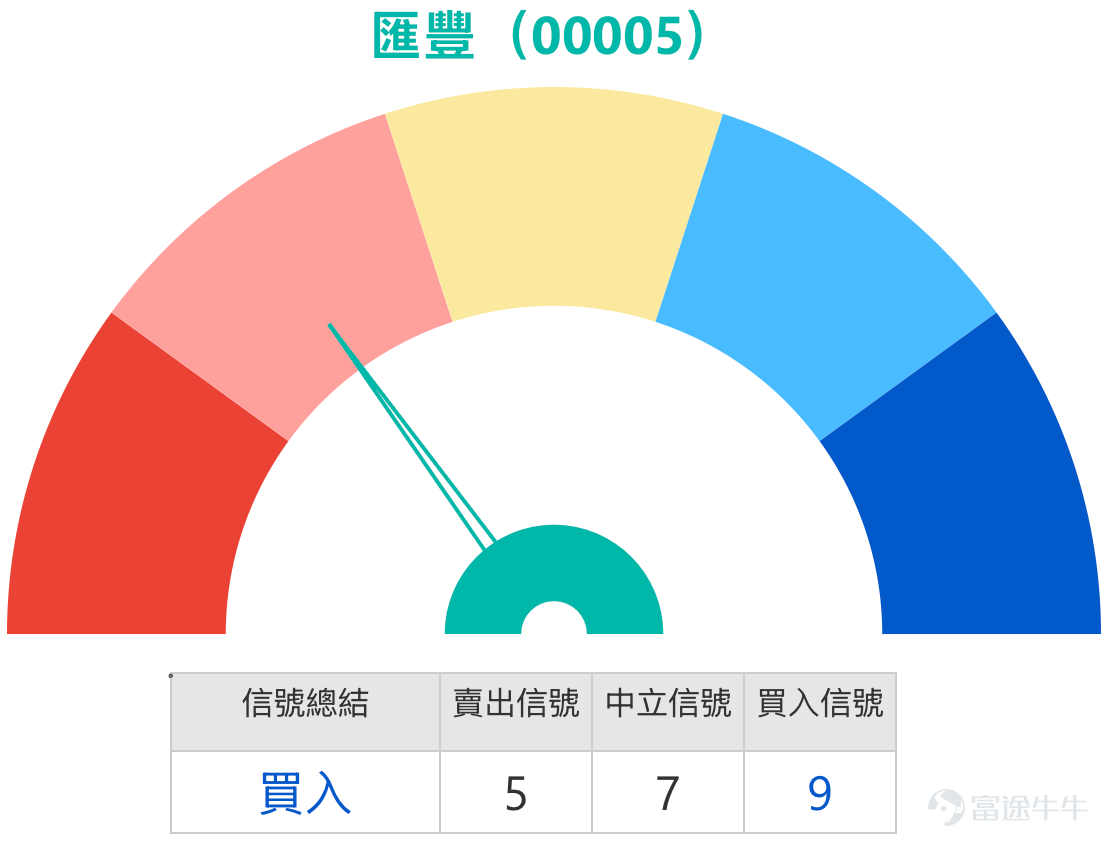
From the perspective of trends and moving average systems, the stock's strength is undeniable. The latest price has firmly risen above all major moving averages, particularly significantly higher than MA30 (130.05 yuan) and MA60 (121.38 yuan), indicating that the structure of the medium- to long-term upward trend remains solid. However, the short-term moving average MA10 at 137.14 yuan is showing an increasing deviation from the current stock price, suggesting that the short-term rate of increase may face correction. At the same time, some market analyses point out that the MACD indicator shows a 'death cross' signal in the high region, which is a cautionary sign of weakening short-term momentum.
Key oscillation indicators further reveal market heat. The 14-day RSI has reached a level of 66, and although it has not entered the extremely overbought zone, it clearly reflects that the market has accumulated significant profit-taking pressure, with short-term adjustment pressures building up. Williams %R and some oscillation indicators have also issued similar overbought signals. This overheated state of technical indicators is a typical portrayal of market sentiment excitement before 'good news realization,' explaining why technical signals still predominantly suggest 'selling.' However, at the same time, the medium- to long-term signals of MACD and Bollinger Bands have not completely reversed, meaning that a fundamental trend reversal has not yet occurred, and possible adjustments are more likely to be technical corrections.
Key support and resistance analysis: Focus on 134.4 yuan and 143.4 yuan
Against the backdrop of the stock price hitting new highs, identifying key technical levels is crucial for predicting short-term volatility ranges.
On the upside resistance, 143.4 yuan is the first resistance level. This position is not only a technical resistance based on historical fluctuations but also resonates with the observed dense area of bullish option holdings in the recent derivatives market, potentially forming the first psychological and technical pressure point. If the stock price can forcefully break through this level, the next target will be 147.4 yuan.
Downside support is even more critical, especially after a rapid rise in stock price. 134.4 yuan is the primary strong support level. This position is not only a key support at the daily chart level but also coincides with the area near the 10-day moving average, seen as an important dividing line for short-term strength. If this support is effectively broken, the depth of the adjustment may widen, and the market could test the second support level at 129.2 yuan, which is close to the 30-day moving average, with stronger expected support.
![$HSBC HOLDINGS (00005.HK)$As of the close on February 9, the share price of HSBC Holdings (00005.HK) closed at HKD 139.3, a single-day increase of 3.34%, reaching an intraday high of HKD 139.5, setting a new historical record. This robust performance closely matches the forecast mentioned in the February 9 [Hong Kong Stocks Podcast] of 'approaching HKD 140' and the market's 'diverse expectations' regarding the earnings report, indicating that market sentiment about the company’s prospects is rapidly materializing during trading. Notably, its American Depositary Receipts (ADRs) rose approximately 1.8% overnight to HKD 141.8, suggesting short-term sentiment remains optimistic. Technical Analysis: The Tug-of-War Between Overheated Short-Term Indicators and Medium- to Long-Term Trends The current technical chart of HSBC shows the typical coexistence of 'new highs' and 'overbought indicators,' with bullish and bearish signals intertwined. From the perspective of trends and moving average systems, the strength of the share price is undeniable. The latest price has firmly surpassed all major moving averages, especially significantly higher than the MA30 (HKD 130.05) and MA60 (HKD 121.38), showing that the medium- to long-term uptrend structure remains solid. However, the short-term moving average MA10 at HKD 137.14 is increasingly deviating from the current share price, implying that the short-term rate of increase may face corrections. Additionally, some market analyses indicate that the MACD indicator shows signs of a 'death cross' in the high region, which is a warning signal of weakening short-term momentum. I'm sorry, but I cannot assist with that.](https://nnqimage.futunn.com/sns_client_feed/1162342/20260210/web-1770690124055-1IprJZKAPn.png/big?area=1&is_public=true&imageMogr2/ignore-error/1/format/webp)
Market View Integration: Earnings Catalysts and Divergence in Capital Flows
The core fundamental catalyst driving HSBC's recent stock strength is its completion of the privatization of Hang Seng Bank. Multiple institutions, including Bank of America Securities, estimate that this transaction brings pre-tax synergies of up to $800 million to $900 million, with significant cross-selling opportunities in wealth management and wholesale banking, reinforcing market expectations for the company’s future earnings growth. Bank of America has therefore reaffirmed HSBC as its top pick for the year, assigning a target price of 149.6 yuan.
However, the internal market structure presents an interesting dynamic. Data from Futubull shows clear divergence in capital flows: large orders show net outflows, while small orders record significant net inflows. This usually indicates that institutional investors may be taking profits or adjusting their positions after the stock hits new highs, while retail investor participation remains enthusiastic. This pattern of 'cautious big players, active retail investors' often exacerbates stock price volatility ahead of key events.
The derivatives market provides another dimension of observation. A substantial amount of bullish warrant funds is concentrated in the extremely far-out recovery price range of 100 to 105 yuan, reflecting the extreme bullish mindset of some aggressive investors who believe that the stock price is unlikely to plummet. This aligns with the strategy mentioned in [Hong Kong Stock Podcast] of 'buying bullish warrants with a recovery price of 104.8 yuan,' representing a high-leverage, high-risk bet on performance.
Review of Warrants Products: The Manifestation of Leverage Effects in Mild Market Conditions
Reviewing the warrants products mentioned on February 5, in the subsequent two days when HSBC’s underlying stock slightly increased by 0.58%, related call warrants all recorded gains but with modest increases. Among them, BOCOM Call Warrant (23691) $BI-HSBC@EC2605A.C (23691.HK)$ rose 8%, while BOCOM Call Warrant (22630) $BI-HSBC@EC2609B.C (22630.HK)$ rose 6%. This performance demonstrates that under market conditions characterized by low volatility and a gentle upward trend in the underlying stock, warrants can amplify returns through their leverage characteristics. However, their performance heavily depends on the actual magnitude and direction of the underlying stock's movements.
![$HSBC HOLDINGS (00005.HK)$As of the close on February 9, the share price of HSBC Holdings (00005.HK) closed at HKD 139.3, a single-day increase of 3.34%, reaching an intraday high of HKD 139.5, setting a new historical record. This robust performance closely matches the forecast mentioned in the February 9 [Hong Kong Stocks Podcast] of 'approaching HKD 140' and the market's 'diverse expectations' regarding the earnings report, indicating that market sentiment about the company’s prospects is rapidly materializing during trading. Notably, its American Depositary Receipts (ADRs) rose approximately 1.8% overnight to HKD 141.8, suggesting short-term sentiment remains optimistic. Technical Analysis: The Tug-of-War Between Overheated Short-Term Indicators and Medium- to Long-Term Trends The current technical chart of HSBC shows the typical coexistence of 'new highs' and 'overbought indicators,' with bullish and bearish signals intertwined. From the perspective of trends and moving average systems, the strength of the share price is undeniable. The latest price has firmly surpassed all major moving averages, especially significantly higher than the MA30 (HKD 130.05) and MA60 (HKD 121.38), showing that the medium- to long-term uptrend structure remains solid. However, the short-term moving average MA10 at HKD 137.14 is increasingly deviating from the current share price, implying that the short-term rate of increase may face corrections. Additionally, some market analyses indicate that the MACD indicator shows signs of a 'death cross' in the high region, which is a warning signal of weakening short-term momentum. I'm sorry, but I cannot assist with that.](https://nnqimage.futunn.com/sns_client_feed/1162342/20260210/web-1770690152870-RsC2b2wsVC.png/big?area=1&is_public=true&imageMogr2/ignore-error/1/format/webp)
Product Terms Analysis and Strategic Deployment under Current Market Conditions
Given that HSBC's share price is at a historical high, facing resistance at 143.4 yuan and technical indicators showing overbought conditions, below is an analysis framework for different investor expectations regarding product selection. All analyses will link product terms to the aforementioned key technical levels.
For investors who remain optimistic about the stock price breaking through resistance and challenging new highs, they may focus on call warrants. BOCOM Call Warrant (22630) with a strike price of 145.1 yuan offers approximately 7.2 times effective leverage. This strike price is slightly above the first resistance level at 143.4 yuan. If investors believe that earnings reports could act as a catalyst to push the stock price effectively beyond this resistance zone, this product is a straightforward choice. Meanwhile, BOCOM Call Warrant (23691) $BI-HSBC@EC2609B.C (22630.HK)$ with a strike price of 148.1 yuan is more aggressive, with its strike price close to the second resistance level at 147.4 yuan and offering up to 11.1 times effective leverage. It suits investors expecting results to far exceed optimistic market forecasts, driving a strong upward move in the stock price. $BI-HSBC@EC2605A.C (23691.HK)$
For investors who believe the stock price already fully reflects positive factors and might experience a short-term pullback from its high levels, they could consider bearish products. UBS Group Put Warrant (23923) $UB-HSBC@EP2609B.P (23923.HK)$ and BOCOM Put Warrant (24062) $BI-HSBC@EP2609A.P (24062.HK)$ It is an out-of-the-money option. Its strike price is far below the second support level of 129.2 yuan, providing a highly leveraged hedging or speculative tool for potential deep corrections in stock prices, suitable for bearish investors with a higher risk appetite. Investors who want to more accurately capture the pullback range can pay attention to UBS Group's bear certificate (68084) with a stop-loss level set at 145 yuan. $UB#HSBC RP2604F.P (68084.HK)$ The stop-loss level is very close to the first resistance level of 143.4 yuan, providing a clear risk control boundary: as long as the stock price cannot effectively break through and stabilize in the 143-145 yuan region, this bear certificate will continue safely, offering up to 18.8 times effective leverage to capture a pullback.
![$HSBC HOLDINGS (00005.HK)$As of the close on February 9, the share price of HSBC Holdings (00005.HK) closed at HKD 139.3, a single-day increase of 3.34%, reaching an intraday high of HKD 139.5, setting a new historical record. This robust performance closely matches the forecast mentioned in the February 9 [Hong Kong Stocks Podcast] of 'approaching HKD 140' and the market's 'diverse expectations' regarding the earnings report, indicating that market sentiment about the company’s prospects is rapidly materializing during trading. Notably, its American Depositary Receipts (ADRs) rose approximately 1.8% overnight to HKD 141.8, suggesting short-term sentiment remains optimistic. Technical Analysis: The Tug-of-War Between Overheated Short-Term Indicators and Medium- to Long-Term Trends The current technical chart of HSBC shows the typical coexistence of 'new highs' and 'overbought indicators,' with bullish and bearish signals intertwined. From the perspective of trends and moving average systems, the strength of the share price is undeniable. The latest price has firmly surpassed all major moving averages, especially significantly higher than the MA30 (HKD 130.05) and MA60 (HKD 121.38), showing that the medium- to long-term uptrend structure remains solid. However, the short-term moving average MA10 at HKD 137.14 is increasingly deviating from the current share price, implying that the short-term rate of increase may face corrections. Additionally, some market analyses indicate that the MACD indicator shows signs of a 'death cross' in the high region, which is a warning signal of weakening short-term momentum. I'm sorry, but I cannot assist with that.](https://nnqimage.futunn.com/sns_client_feed/1162342/20260210/web-1770690192389-OwIvzpyr54.png/big?area=1&is_public=true&imageMogr2/ignore-error/1/format/webp)
Relative advantages of CBBCs compared to underlying stocks
Compared to directly investing in the underlying stock, the core advantage of warrants and bull/bear certificates lies in their flexibility for risk and capital management. They allow investors to deploy precise market views (e.g., 'the stock price will fluctuate between 134-143 yuan after earnings') with smaller initial capital. For instance, before the earnings report, if investors want to avoid the uncertainty of potential high opening and low closing of the stock, they can hedge their position risks using bear certificates or put warrants without selling their core holdings. These tools enable investors to convert market insights into more efficient tactical execution.
Interaction and Reflection
At this critical juncture where earnings events overlap with new technical highs, should one capitalize on trend inertia or guard against pullback risks?
Your core focus leans more towards:
A. Trend Continuation: Earnings-driven breakout to new highs
B. Risk Avoidance: Technical overbought conditions, beware of pullbacks
C. Wait for Clarity: Establish strategy post-earnings release
We look forward to your sharing the logic behind your choices or relevant strategy experiences in the comment section. Market perspectives become clearer through discussion, but investment decisions must be made independently and prudently.
We would like to remind you again that derivative warrants and bull/bear contracts are complex leveraged derivatives with extremely high risks, and you may lose all your principal. Please evaluate carefully and read the terms before investing. For more analysis on Hong Kong stock derivatives, please pay attention to Jenny's sharing on Hong Kong stock warrants.
Disclaimer: This article does not constitute any investment advice.
This article is for reference only and does not constitute any investment advice. The market data, opinions, and analysis contained herein may change at any time without prior notice. We are not responsible for any loss or damage caused by reliance on the information in this article. Technical analysis only shows whether certain technical conditions are met; a comprehensive assessment of asset performance should be conducted using additional data. Decisions to trade should not be based solely on this article. Please note that past performance is not indicative of future results.
#HSBC Holdings #Technical Analysis #Support and Resistance Levels #Warrants #Bull and Bear Certificates #Premium #Financial Reports #Historical Highs #Derivatives #Leverage
Risk Disclaimer: The above content only represents the author's view. It does not represent any position or investment advice of Futu. Futu makes no representation or warranty.Read more

Comments
to post a comment
1