
How to view the post-holiday market trend in Hong Kong stocks?

Trading volume is moderately recovering; can the Hang Seng Index hold steady above 27,000 points?
On February 9th, we provided analysis in our [HK Stocks Report] column. $Hang Seng Index (800000.HK)$
From the full-day closing situation, the market successfully regained the key level of 27,000 points, closing at 27,027 points. Observing from a technical perspective, not only did the closing price return to a critical psychological level, but it also stabilized above the middle Bollinger Band on the daily chart, making it a small technical highlight from the previous day (February 9th).
In terms of trading volume, market turnover showed a slight increase compared to last Friday (February 6th), but remained relatively moderate when compared to earlier active phases, indicating that investor willingness to chase gains has not fully recovered yet and there is no blind following.
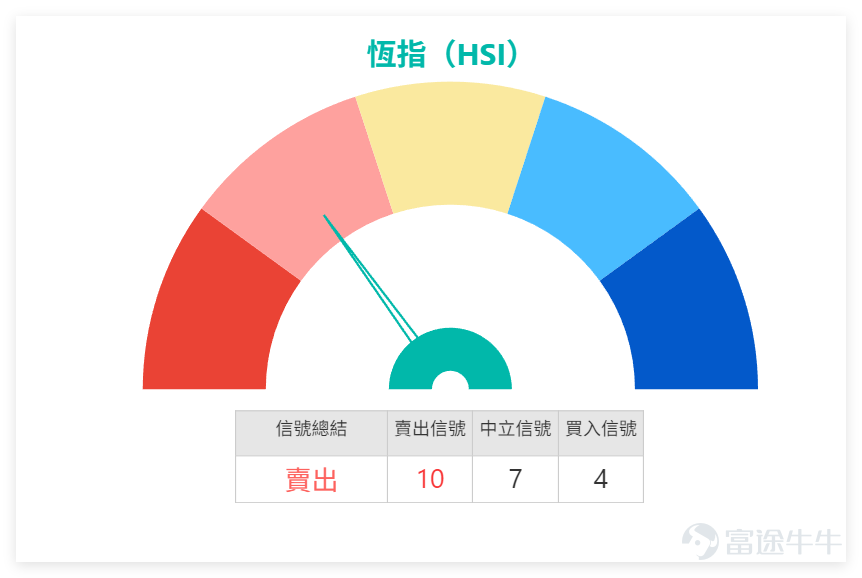
Summarizing technical indicators, the number of 'Sell' signals currently leads 'Buy' signals with a ratio of 10 to 4, reflecting cautious short-term market sentiment. Specifically, the RSI indicator stands at 56, within the neutral range; the MACD signal indicates 'Sell', consistent with the overall trend of technical signals; among multiple oscillation indicators, the CCI shows a 'Buy' signal, while most others remain neutral, creating mild divergence.
![On February 9th, we provided analysis in our [HK Stocks Report] column. $Hang Seng Index (800000.HK)$ From the full-day closing situation, the market successfully regained the key level of 27,000 points, closing at 27,027 points. Observing from a technical perspective, not only did the closing price return to a critical psychological level, but it also stabilized above the middle Bollinger Band on the daily chart, making it a small technical highlight from the previous day (February 9th). In terms of trading volume, market turnover showed a slight increase compared to last Friday (February 6th), but remained relatively moderate when compared to earlier active phases, indicating that investor willingness to chase gains has not fully recovered yet and there is no blind following. Summarizing technical indicators, the number of 'Sell' signals currently leads 'Buy' signals with a ratio of 10 to 4, reflecting cautious short-term market sentiment. Specifically, the RSI indicator stands at 56, within the neutral range; the MACD signal indicates 'Sell', consistent with the overall trend of technical signals; among multiple oscillation indicators, the CCI shows a 'Buy' signal, while most others remain neutral, creating mild divergence. In terms of support and resistance, the index's key short-term support zone is near 26,500 points (Support 1), with the next support level at 25,900 points (Support 2); the main resistance lies around 27,500 points (Resistance 1). If it breaks through, upside potential could extend to 28,100 points (Resistance 2). The short-term core trading range is approximately 500 points, which traders can monitor closely. On February 9th, several key blue-chip stocks rebounded, especially financial and tech stocks showing relatively active performance...](https://nnqimage.futunn.com/sns_client_feed/228620/20260210/web-1770686899882-bsGFatV8mM.png/big?area=1&is_public=true&imageMogr2/ignore-error/1/format/webp)
In terms of support and resistance, the index's key short-term support zone is near 26,500 points (Support 1), with the next support level at 25,900 points (Support 2); the main resistance lies around 27,500 points (Resistance 1). If it breaks through, upside potential could extend to 28,100 points (Resistance 2). The short-term core trading range is approximately 500 points, which traders can monitor closely.
On February 9, several major blue-chip stocks rebounded, particularly financial and tech stocks showing relatively active performance. However, most share prices remained below or near their key moving averages, suggesting that the overall trend has not yet fully strengthened, and the strength of the rebound still requires further observation. A detailed breakdown of individual stocks follows:
1. Tencent (00700): Closing price at HKD 560.00, up 2.28% for the day. The stock rebounded, but remains below the MA10 (HKD 585.95), MA30 (HKD 603.83), and MA60 (HKD 609.30) key moving averages, indicating a weak rebound trend. RSI is at 30, near the oversold zone. Multiple technical indicators suggest a 'buy' signal with an intensity rating of 11 (neutral to slightly strong). There may be potential for further short-term rebounds.
2. Alibaba-SW (09988): Closing price at HKD 157.90, up 1.87% for the day. The stock price gradually approached the MA10 (HKD 164.22), but still slightly lags behind the MA30 (HKD 158.54), with some distance remaining before stabilizing above the moving averages. RSI stands at 50, reflecting a perfectly neutral position. Technical indicators collectively suggest a 'buy' signal, with an intensity rating of 9, indicating a relatively stable technical outlook.
3. Meituan-W (03690): Closing price at HKD 91.05, down 0.38% for the day. Among the various blue chips that rebounded, its performance was weaker. The stock price is below the MA10 (HKD 94.72), MA30 (HKD 99.20), and MA60 (HKD 99.68), placing it in a short-term weak region. RSI is at 31, indicating oversold signals. Technical indicators collectively suggest a 'buy' signal, with an intensity rating of 9, implying potential for corrective rebounds.
4. China Construction Bank (00939): Closing price at 8.08 yuan, up 1.38% in a single day, showing relatively strong performance. The stock price is above the MA10 (7.94 yuan), MA30 (7.78 yuan), and MA60 (7.84 yuan) lines, with short-term moving averages forming a bullish pattern; RSI is 63, nearing the overbought region. Technical indicators signal 'Neutral,' strength rating 9, with slight pullback pressure to be monitored due to potential overbuying.
5. AIA (01299): Closing price at 86.35 yuan, surging 3.41% in a single day, leading the gains. The stock price is approaching MA10 (88.41 yuan) and MA30 (85.12 yuan) and is expected to stabilize above the moving averages gradually; RSI is 51, within the neutral zone. Technical indicators signal 'Neutral,' strength rating 8, with short-term bullish momentum but requiring volume support.
6. Hong Kong Exchange (00388): Closing price at 418.60 yuan, up 2.70% in a single day, showing a rebound. However, the stock price remains slightly below MA10 (425.30 yuan) and MA30 (425.18 yuan), failing to break through moving average resistance effectively; RSI is 46, leaning towards neutral. Technical indicators signal 'Sell,' strength rating 8, with limited rebound potential.
7. Ping An (02318): Closing price at 73.00 yuan, soaring 4.89% in a single day, the most significant increase. The stock price has successfully broken through MA10 (71.45 yuan) and MA30 (69.47 yuan), showing clear technical improvement; RSI is 60, slightly bullish. Technical indicators signal 'Sell,' strength rating 8, with possible retesting of moving averages for support confirmation in the short term.
8. ICBC (01398): Closing price at 6.52 yuan, rising 0.46% in a single day, showing relatively stable movement. The stock price is firmly above MA10 (6.48 yuan) and MA30 (6.32 yuan), indicating solid support; RSI is 65, signaling potential overbuying. Technical indicators signal 'Sell,' strength rating 8, with caution advised for minor pullbacks.
9. BYD (01211): Closing price at 93.55 yuan, up 1.35% in a single day. The stock price is slightly below MA10 (94.88 yuan) but above MA30 (96.68 yuan), showing some divergence in moving averages; RSI is 47, within the neutral zone. Technical indicators signal 'Buy,' strength rating 8, with balanced short-term movement.
10. Xiaomi Group-W (01810): Closing price at 35.20 yuan, nearly flat in a single day, with the stock price almost level with MA10 (35.29 yuan) but still below MA30 (36.87 yuan) and MA60 (38.84 yuan). The stock is currently in a short-term consolidation phase; RSI is 42, leaning weakly neutral. Technical indicators signal 'Buy,' strength rating 10, with a relatively optimistic technical outlook.
Review of Bull/Bear Warrants & Featured Products:
(I) Review of previous Warrant Bull/Bear performance:
Reviewing the two Hang Seng Index bull contracts recommended on February 5, their short-term performance was impressive. Specific data: BOC Bull Contract (64765) gained 14% in two days, and BOC Bull Contract (64010) rose 13% in two days, while the Hang Seng Index itself only increased by 0.53% during the same period, highlighting the significant leverage effect of warrants. It's important to remind everyone that warrants are derivatives, and while leverage brings opportunities, it also comes with risks. Investors should remain rational and act within their means regardless of market fluctuations.
(II) Selected Warrants and Bull/Bear Contracts:
Based on the Hang Seng Index's trend and technical signals, two Warrant products have been selected to align with bullish and bearish strategies, providing reference for investors:
1. BOC Call Warrant (23798): Leverage of 7.1x, exercise price at 28,600 points; the key feature of this product is its highest leverage among the currently recommended products, combined with the lowest premium and implied volatility, offering relatively high cost-effectiveness. It suits investors who expect the Hang Seng Index to break through resistance levels and are willing to take corresponding risks.
2. BOC Bull Contract (61570): Underlying asset is the Hang Seng Index, leverage of 25.5x, recovery price at 26,050 points; the key feature of this product is its relatively high leverage, aligning well with the current rebound trend of the Hang Seng Index. It suits investors who are short-term bullish on the Hang Seng Index holding above support levels and seek high-leverage returns, with particular attention needed on the strength of support near the recovery price.
Friendly reminder:Warrants and callable bull/bear contracts are high-risk derivatives. Implied volatility, premium, and strike prices can all affect product performance. Investors should choose based on their own risk tolerance and avoid blindly following others.
The Hang Seng Index has regained the 27,000-point level. Do you think the market can hold this level going forward? A: Hold. B: Not hold. Come to the comment section and share your thoughts.
Disclaimer: This article does not constitute any investment advice.
This article is for reference only and does not constitute any investment advice. The market data, opinions, and analysis contained herein may change at any time without prior notice. We are not responsible for any loss or damage caused by reliance on the information in this article. Technical analysis only shows whether certain technical conditions are met; a comprehensive assessment of asset performance should be conducted using additional data. Decisions to trade should not be based solely on this article. Please note that past performance is not indicative of future results.
#HongKongStocks #HangSengIndex #RealTimeAnalysis #WarrantsSelection #WarrantsStrategy #DerivativesHedging #KeyBlueChips #HongKongBlueChips #TechnicalAnalysis #HangSengTechnicalBreakdown
Risk Disclaimer: The above content only represents the author's view. It does not represent any position or investment advice of Futu. Futu makes no representation or warranty.Read more
Comments
to post a comment