
How to view the post-holiday market trend in Hong Kong stocks?

Leverage Effect and Risk Control of Tencent's Warrants and Bull/Bear Contracts from its Price Movement
$TENCENT (00700.HK)$ The sentiment in the Hong Kong stock market has undoubtedly been influenced by the price movement of leading tech company Tencent. As of February 9, Tencent's share price closed at HKD 561.5, up 2.34%. Over a recent period, it experienced significant adjustments and once broke through several key technical levels. However, the market seems to be tilting; on one side is the pessimism brought by continuous declines, while on the other side are deeply oversold signals from technical indicators and the unwavering contrarian positioning of southbound funds.
Technical Analysis: Intense Battle Between Downward Trend and Oversold Signals
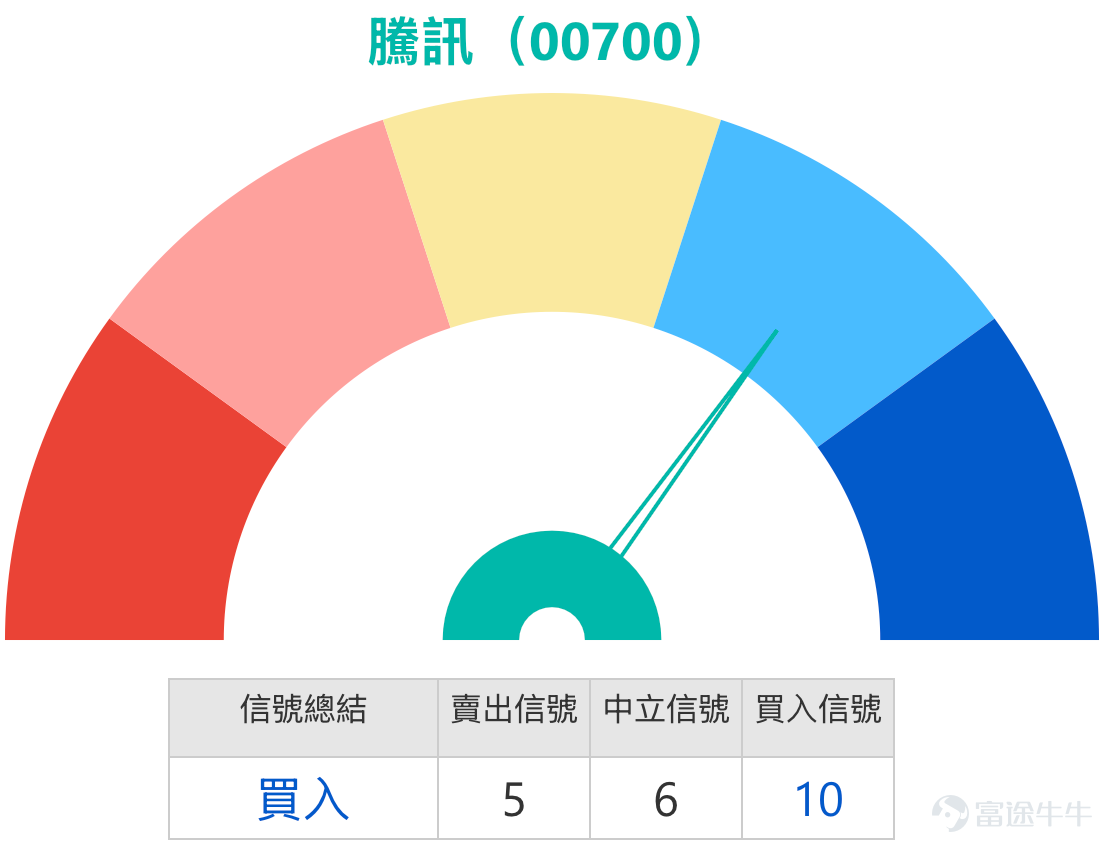
From the technical chart perspective, Tencent currently presents a stark contradiction between 'downward trend' and 'oversold indicators.' The share price has clearly broken below all short-term key moving averages, including MA10 (HKD 585.3) and MA30 (HKD 603.62), with the moving average system showing a bearish alignment, confirming that the short-term downtrend is still continuing. However, multiple key oscillation indicators have issued strong rebound signals. The 14-day RSI has dropped to around 30, entering a clear oversold zone; simultaneously, rate-of-change indicators also suggest that downward momentum may be waning, implying that the market could be nearing a short-term sentiment low. This divergence usually indicates that opportunities for technical recovery are building up.
Key Support and Resistance Analysis: Focus on the Battle Between 546 and 594 Yuan
The current market's focus is highly concentrated on several key price levels. According to the latest technical analysis, the first support level is near 546 yuan. This position is the first observation point to determine whether there will be a short-term rebound. If this level fails, the more important core support area will shift down to 521 yuan, which is considered the 'litmus test' for assessing the depth of this round of adjustments.
The path to an upward rebound is equally filled with resistance. Any rebound will first face a test at 594 yuan, which is close to the previous high trading volume zone. Stronger resistance lies in the 622 to 625 yuan range, which is not only the previous platform level but also overlaps with multiple mid-term technical pressures, making it the key watershed for whether the short-term trend can truly reverse.
Market View Integration: Rumor Disturbance, Capital Bottom-Fishing, and Derivatives Risk Warning
To understand recent volatility, it's necessary to separate sudden news, market sentiment, and capital behavior. At the beginning of February, a market rumor about a possible increase in VAT on internet services became the trigger for a sharp stock price drop. Although multiple institutions analyzed that the rumor had low credibility and was 'noise' amplified during fragile market sentiment, it still triggered technical selling, including from quant funds. Meanwhile, Tencent is currently in the 'repurchase quiet period' before earnings season, losing daily repurchase support, making the stock more vulnerable under bearish pressure.
In stark contrast to market panic is the contrarian operation of 'smart money.' Southbound capital has shown strong bottom-fishing intentions, accumulating net purchases of over 50 billion yuan in the past three trading days, with Tencent being one of the key targets. This reflects long-term capital's belief that the current valuation is attractive and is using market volatility to make strategic moves.
In the February 4th [HK Stocks Podcast], host Simon reminded investors to pay attention to derivatives risks. He pointed out that many Tencent bull certificates with forced recall prices too close to the market price have already been forcibly recalled recently, directly reflecting the reality of the stock price falling below key support levels. He emphasized that controlling recall price risk is crucial; choosing bull and bear certificates with sufficient buffer in their recall prices can effectively reduce the risk of being unexpectedly 'taken out' in volatile markets.February 4th [Hong Kong Stock Podcast] Hang Seng Index, Tencent, Xiaomi Group, Li Auto, China Resources Beer, Li Ning
Review of Warrants and Bull/Bear Certificates: The Leverage Effect in One-Sided Markets
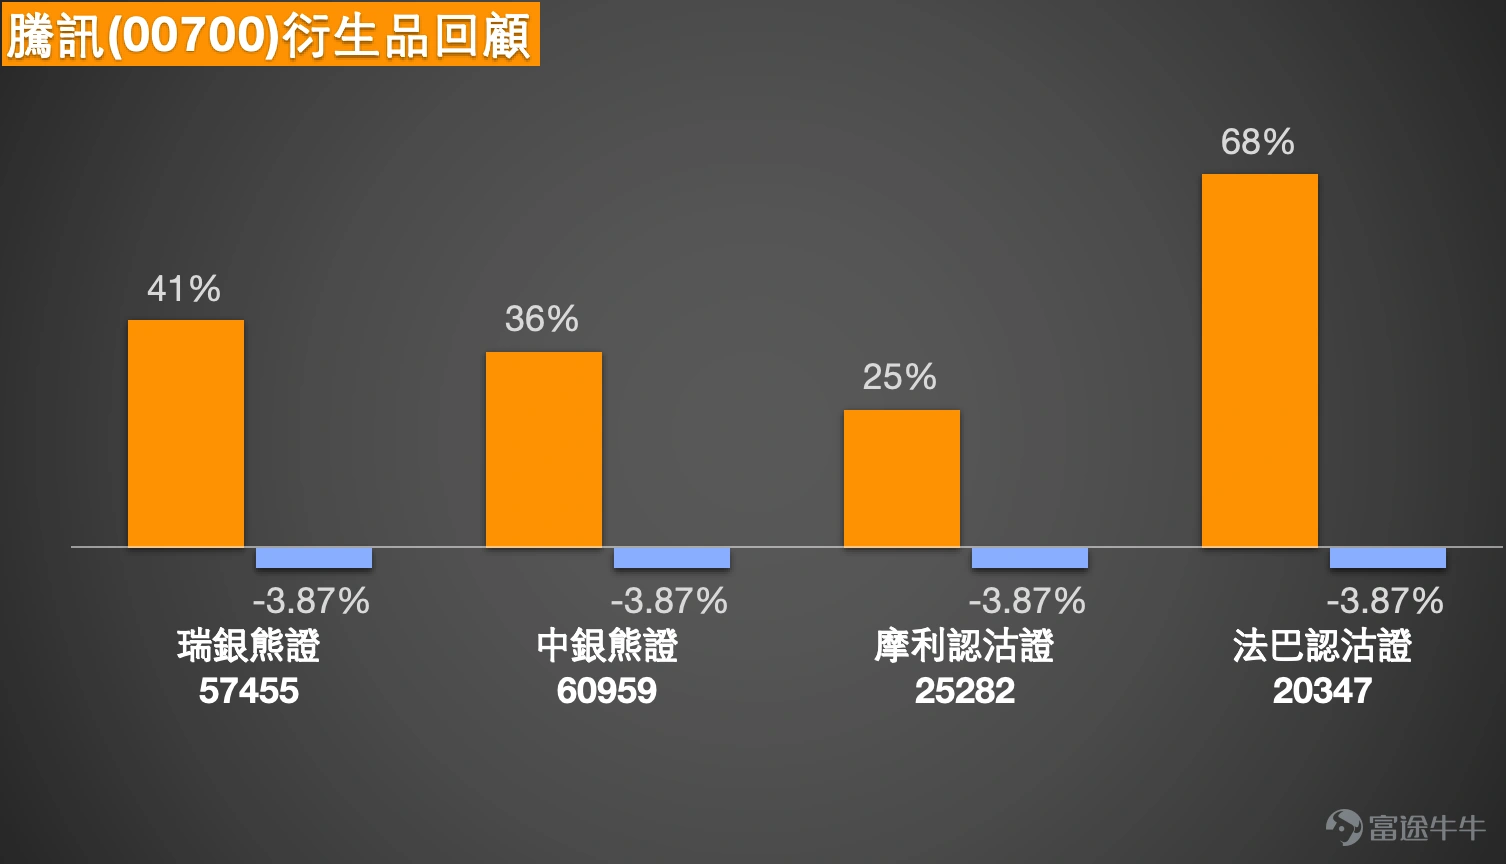
In Tencent's previous one-sided adjustment phase, the leverage effect of derivatives was fully demonstrated. Reviewing the put products mentioned on February 3rd, against the backdrop of Tencent's underlying stock dropping by 3.87% over the following two days, related products recorded significant gains. Among them, BNP Paribas Put Warrant (20347) surged 68%, and UBS Bear Certificate (57455) $UB#TENCTRP2812D.P (57455.HK)$ rose 41%, Bank of ** Certificate (60959) $BI#TENCTRP2812A.P (60959.HK)$ Up 36%, the Morgan Stanley put warrant (25282) rose 25%. This performance clearly demonstrates how, in a market with a clear direction, callable bull/bear contracts and warrants can serve as effective tools for investors to manage risk or follow trends through their leverage characteristics.
#FollowJennyToLearnWarrantsAndCallableBullBearContracts# Key Analysis: What is the 'Call Price'?
Among many terms, the 'call price' is one of the unique and most critical clauses for callable bull/bear contracts. It directly relates to the 'survival or termination' of the product. Simply put, the call price is the 'lifeline' of the callable bull/bear contract. Once the underlying asset (e.g., Tencent's stock price) touches or falls below (for bull contracts)/rises above (for bear contracts) this pre-set price during trading hours, the callable bull/bear contract will be immediately forced to terminate and stop trading.
This means that even if your judgment on the future market direction eventually proves correct, if the stock price experiences severe adverse fluctuations along the way and hits the call price, your investment may be terminated prematurely, potentially resulting in a total loss of principal (for N-class callable bull/bear contracts). Therefore, it’s not always better to choose a closer call price. The distance between the call price and the current price directly determines the product’s safety buffer. For example, when Tencent's current stock price is around HKD 553, a bull contract with a call price at HKD 536 obviously has greater resilience against volatility compared to one with a call price at HKD 545, although its effective leverage might be slightly lower. This is the core logic emphasized in the 【HK Stocks Podcast】that “choosing products with a farther call price can enhance the safety margin.”
Product Terms Analysis and Strategic Deployment under Current Market Conditions
Given that Tencent’s stock price is at a key support level and technically oversold, we have outlined product strategies for investors with different market views, linking all analysis to the aforementioned key technical levels.
Bullish Direction: Speculating on Technical Rebound
If investors believe negative sentiment has been excessively released and the stock price may find support and rebound within the range of HKD 546-521.
* Warrant Selection: Consider call warrants with a strike price near HKD 622.72, such as Societe Generale call warrant (14958) $SGTENCT@EC2607A.C (14958.HK)$ Or Morgan Stanley call warrant (14920) $MSTENCT@EC2607A.C (14920.HK)$ The strike price is close to the strong resistance level of 625 yuan above. If the share price rebounds to this area, such products may benefit. They offer approximately 8 times actual leverage, suitable for speculating on a rebound towards the first resistance level at 594 yuan.
* Bull certificate choice: Consider bull certificates with cautiously set recovery prices, such as UBS Group's bull certificate (64683) $UB#TENCTRC2606P.C (64683.HK)$ (recovery price at 536 yuan) or Morgan bull certificate (57300) (recovery price at 536 yuan). Their recovery prices provide a buffer of about 17 yuan from the current share price, below the first support level of 546 yuan, offering better protection against forced liquidation while providing over 22 times effective leverage, making them high-leverage tools for betting on a rebound.
Bearish direction: Hedging risks or betting on continued adjustment
If investors believe that market sentiment has not stabilized and the stock price might continue to explore lower levels, testing support at 521 yuan or even lower.
* Warrant choice: Consider put warrants with a strike price near 499.8 yuan, such as UBS Group's put warrant (21984) $UBTENCT@EP2606A.P (21984.HK)$ or Bank of China put warrant (23122) $BITENCT@EP2606A.P (23122.HK)$ . The strike price is close to the support level at 521 yuan below, suitable for hedging position risks or following the trend. They offer approximately 8 times actual leverage.
* Bear certificate choice: Consider bear certificates with recovery prices set near recent resistance levels, such as Morgan bear certificate (58298) $JP#TENCTRP2811G.P (58298.HK)$ (recovery price at 588 yuan) or $UB#TENCTRP2812K.P (57563.HK)$ The UBS bear contract (57563) has a recovery price of 590 yuan. Their recovery prices are close to the first resistance level of 594 yuan. If the stock price fails to rebound and does not break through this resistance zone, such products can provide approximately 17 times effective leverage.

Relative advantages of CBBCs compared to underlying stocks
Compared to directly investing in underlying stocks, CBBCs offer investors different tactical tools. Their main advantage lies in capital efficiency and strategic precision. Investors can gain exposure equivalent to holding a large position in the underlying stocks by committing less capital, thereby improving capital utilization efficiency. More importantly, they allow investors to make precise deployments for specific directions or ranges of stock prices, such as specifically targeting a rebound from support to resistance levels without bearing all the long-term risks and capital commitment associated with holding the underlying stocks.
Interaction and Reminder
Facing the key trading range between Tencent's support at 546 yuan and resistance at 594 yuan, your next move would be:
A. Betting on a rebound: Believing that the stock price is near support and preparing to bet on a rebound.
B. Expecting a pullback: Believing that resistance is clear, and the price may test lower levels again.
C. Waiting for a breakout: Waiting for the price to clearly break out of the range before taking action.
Feel free to leave your choice or specific thoughts in the comments section! You can also share your experience trading derivatives near key levels.
Once again, please note that CBBCs are high-risk derivatives that may lead to the loss of the entire principal. Before investing, carefully assess your risk tolerance and thoroughly read the product terms. For more analysis on Hong Kong stock derivatives, follow Jenny's insights on Hong Kong warrants.
Friendly reminder: This article does not constitute any investment advice.
This article is for reference only and does not constitute any investment advice. The market data, opinions, and analysis contained herein may change at any time without prior notice. We are not responsible for any loss or damage caused by reliance on the information in this article. Technical analysis only shows whether certain technical conditions are met; a comprehensive assessment of asset performance should be conducted using additional data. Decisions to trade should not be based solely on this article. Please note that past performance is not indicative of future results.
Risk Disclaimer: The above content only represents the author's view. It does not represent any position or investment advice of Futu. Futu makes no representation or warranty.Read more
Comments
to post a comment
1