How to view the post-holiday market trend in Hong Kong stocks?

Technical Analysis of Chinese Stocks (February 6): Alibaba/Baidu/Bilibili/Futu/PDD Holdings/Tencent Music/NetEase/JD.com/Tencent/Meituan/Kuaishou/Xiaomi
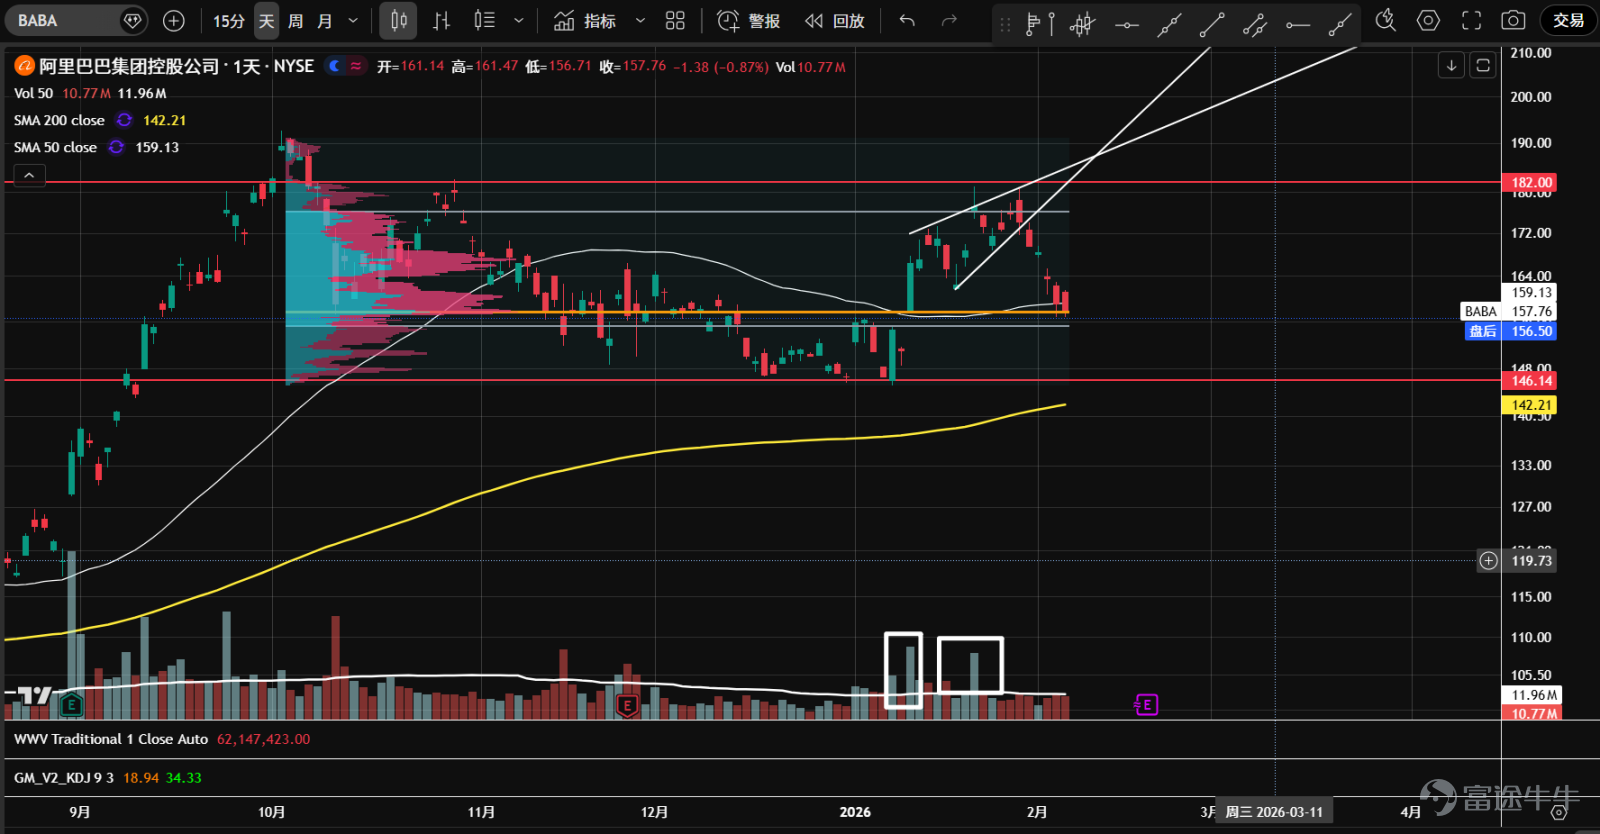
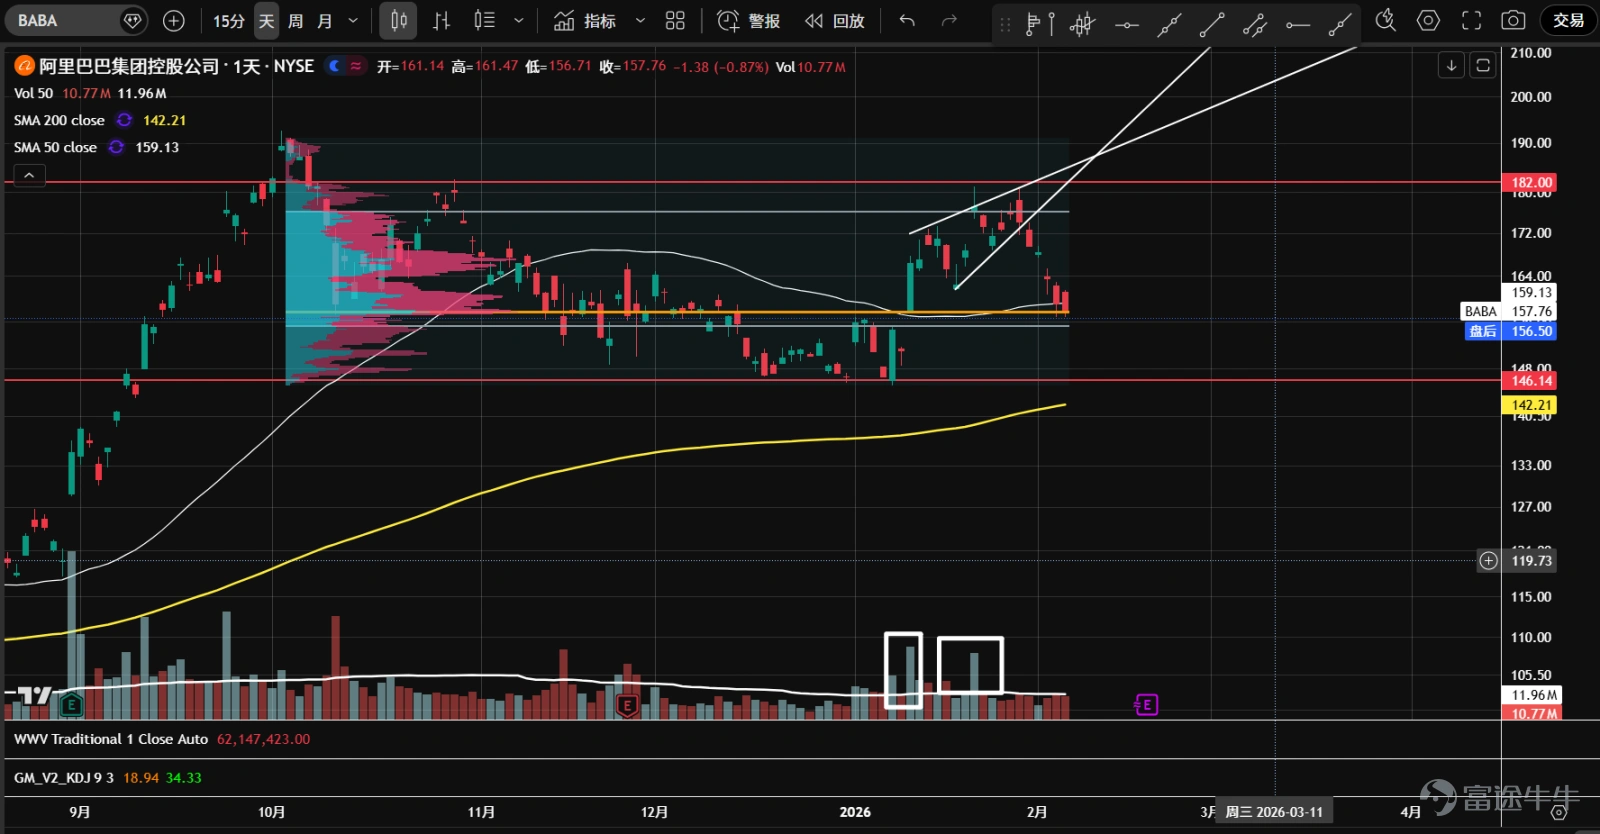
1、 $Alibaba (BABA.US)$ Since last October, there has been a prolonged sideways consolidation. After the New Year, prices rebounded with increased volume from the bottom but encountered resistance at the 182-axis level, forming two high-volume spikes. However, demand eventually dried up, leading to an ascending wedge breakdown and a retreat back into the value area. The current price is at the Volume Point of Control (orange line) and near the lower boundary of the value area. Watch for signs of stabilization.
2、 $Baidu (BIDU.US)$ Since last October, prices have been trapped in a range-bound oscillation. After the New Year, there was a breakout above the previous high of 150 with strong volume, but it failed to hold, quickly falling back into the range. Candlesticks mostly closed at lower levels. Currently, prices are near the uptrend line and the 50-day moving average. Watch for potential stabilization.

3、 $Bilibili (BILI.US)$ Sideways movement started in October last year. After the New Year, there was a rapid surge in volume from the bottom, breaking through resistance around the previous high of 32. Following this, a low-volume pullback occurred, but prices failed to stabilize and quickly retreated back into the range. Monitor for stabilization signals; the upper boundary of the value area serves as the first support.

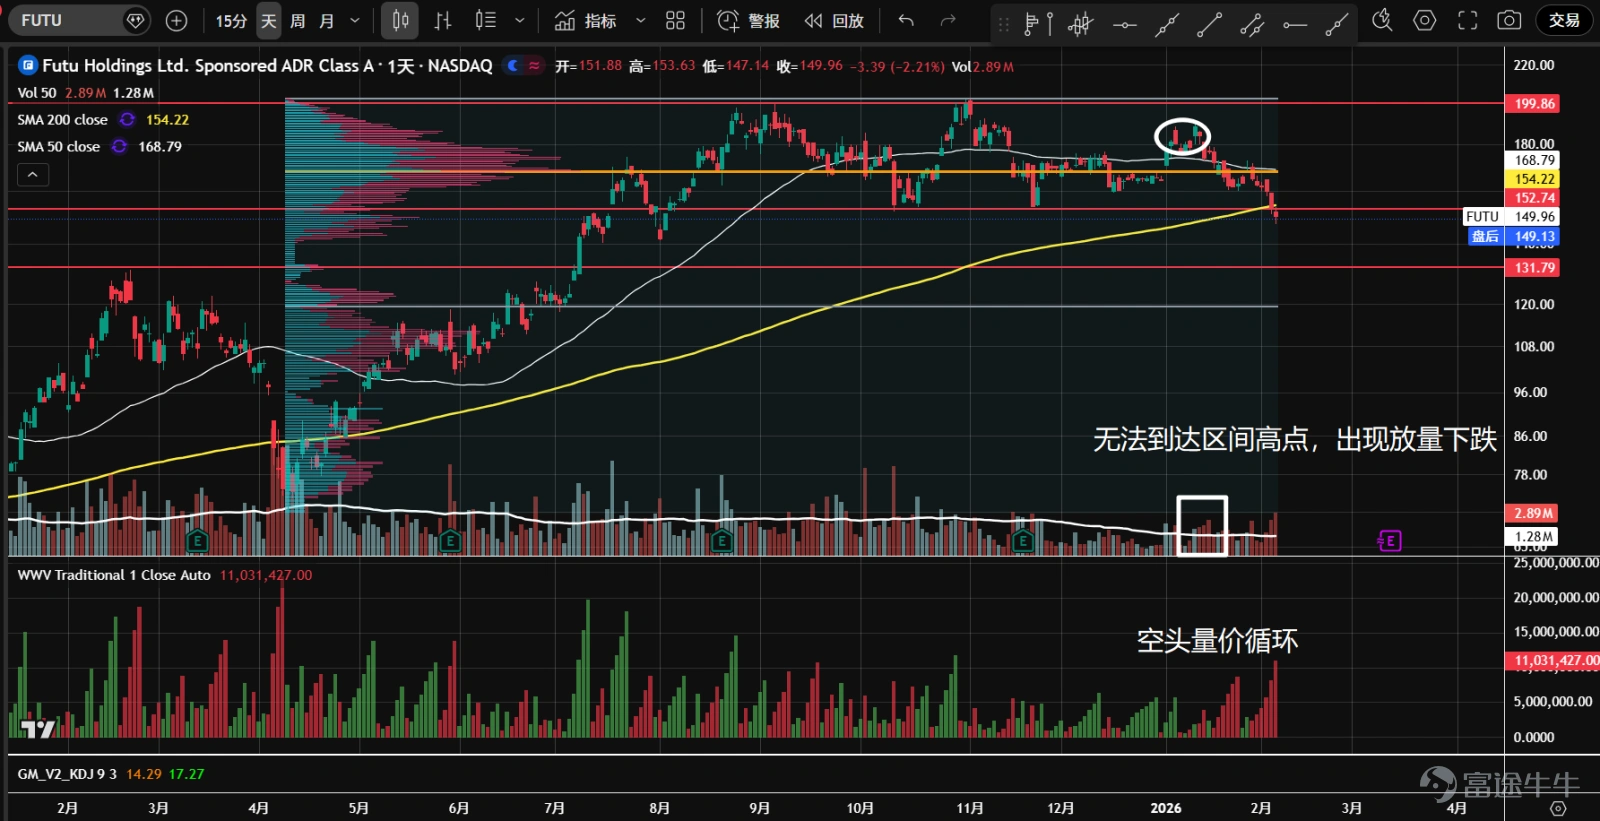
4、 $Futu Holdings Ltd (FUTU.US)$ After nearly half a year of sideways movement, a P-shaped volume distribution has formed, with increased disagreement between bulls and bears at higher levels. The subsequent rebound failed to reach the upper boundary of the range, followed by continuous high-volume declines, and it has now broken below the lower boundary of the range and the annual moving average support; bearish price-volume cycle, showing signs of distribution at higher levels. If it cannot recover in a short period, downward space may open up.
5、 $PDD Holdings (PDD.US)$ Trading within a large consolidation range, after being resisted at the internal axis level of 123 post-New Year, there was a high-volume significant decline, breaking through the 109.5 support; supply expanded, bearish price-volume cycle, technical trend extremely weak, suggesting observation.

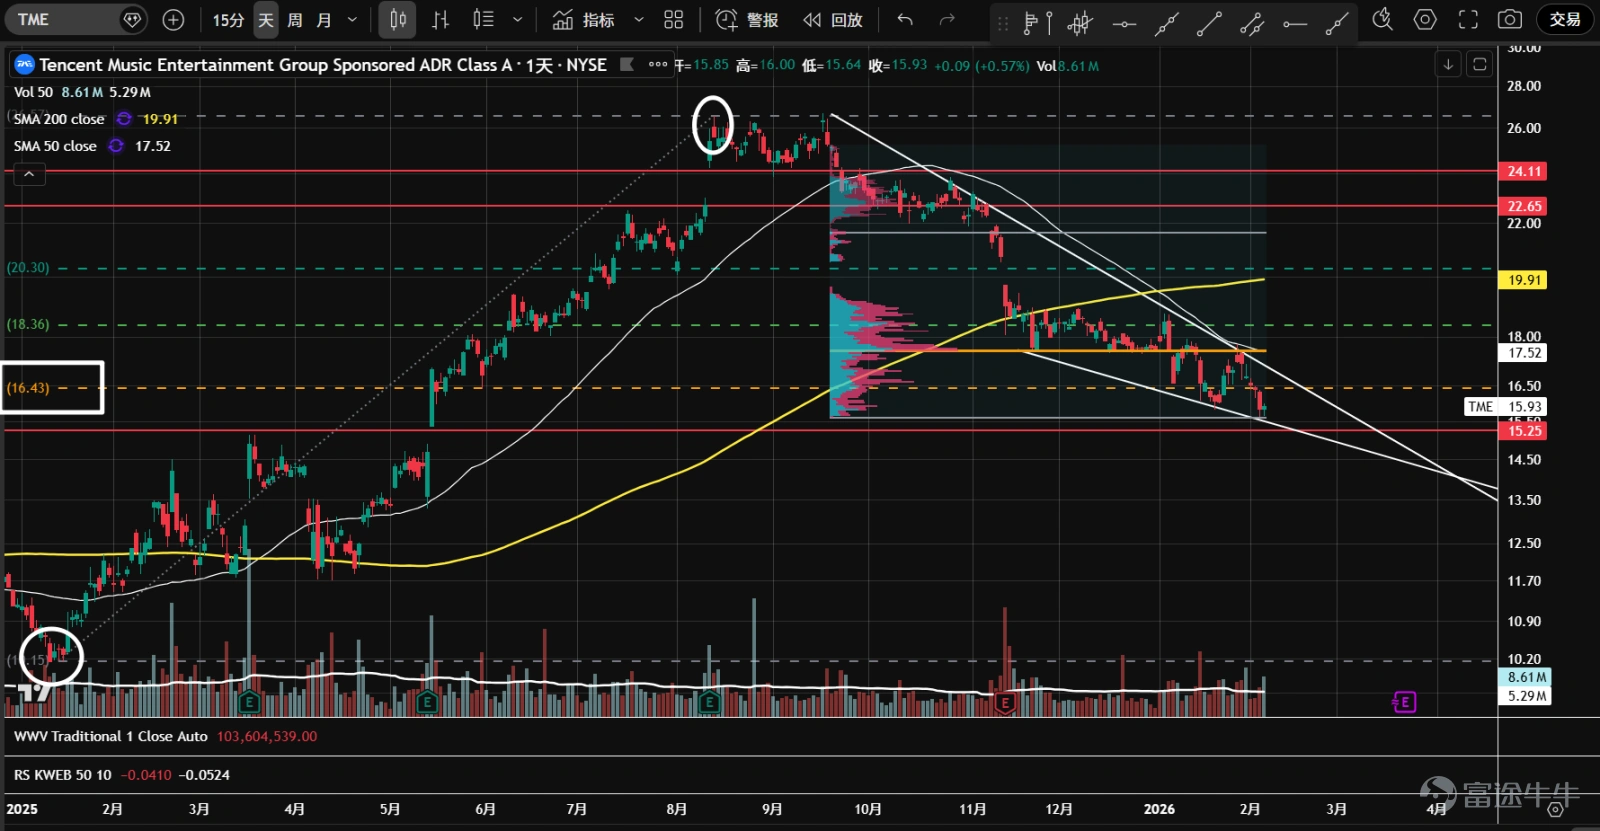
6、 $Tencent Music (TME.US)$ Persistently sluggish, showing signs of stabilization at the 38.2% retracement level of the previous round of market movement; trading volume began to expand, forming a b-shaped volume distribution, increasing disagreement between bulls and bears. Currently following a descending wedge structure, with potential for short-term rebound. Not recommended to bottom-fish until the descending trend line is broken.
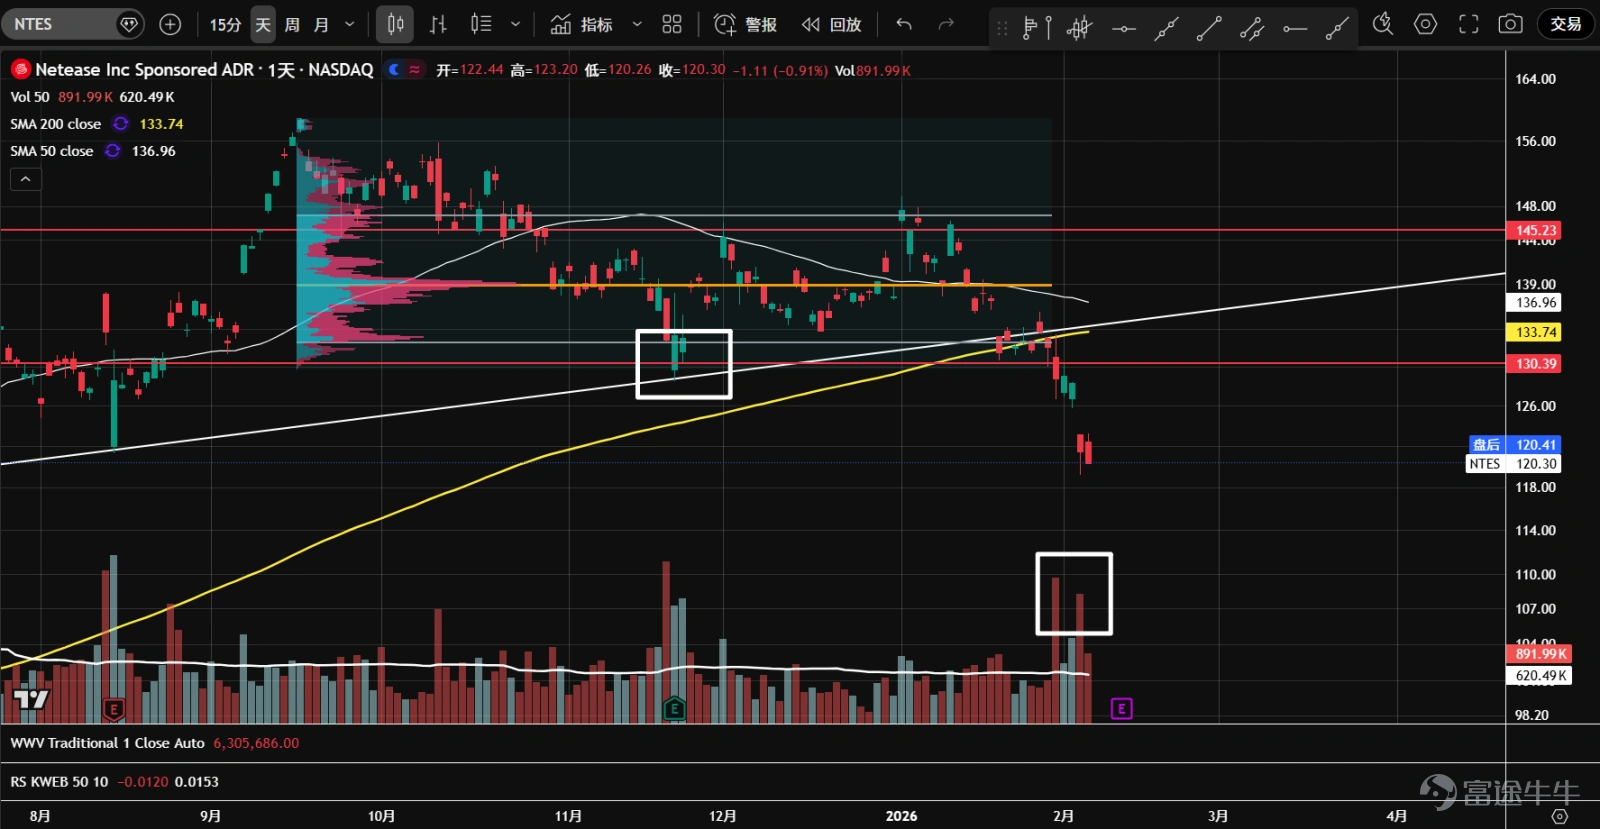
7、 $NetEase (NTES.US)$ Since September of last year, it has been consolidating horizontally; in January, after being resisted at the upper boundary of the value range, it plummeted to the lower axis at 130 and the annual moving average support on high volume; after a low-volume rebound and brief stabilization, it declined again with significant drops. Within a bearish price-volume cycle, the probability of an effective breakdown is high.
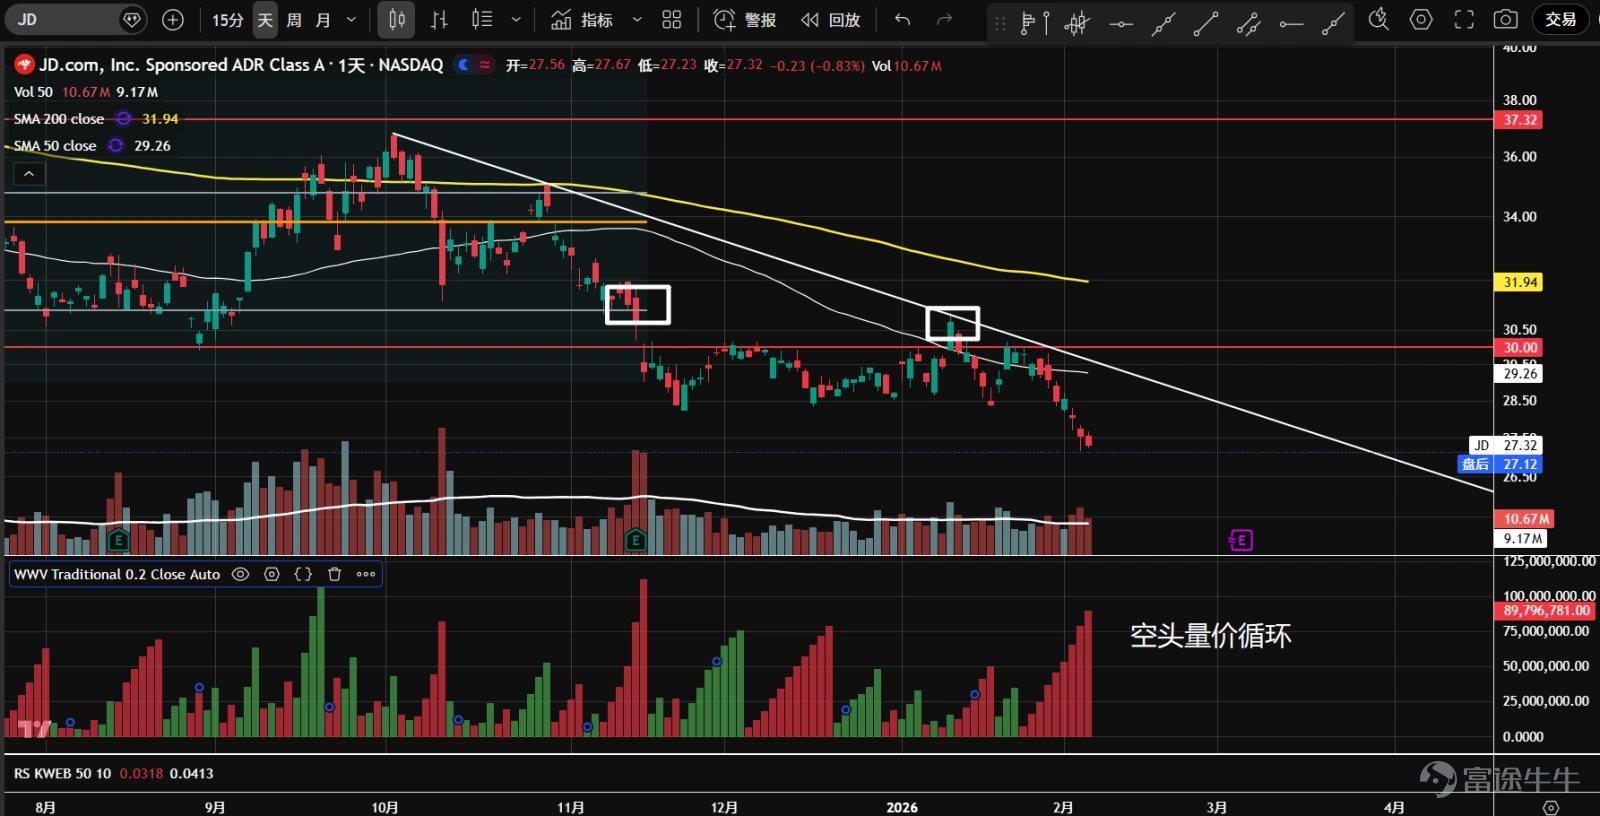
8、 $JD.com (JD.US)$ In mid-November last year, after breaking through the support around 30 on high volume, it did not fall further but entered a narrow consolidation. Recently, it rebounded slightly but was resisted at the lower boundary of the previous consolidation range and retreated on increased volume, forming a new downtrend line. Bearish price-volume cycle, with a high possibility of continuing the downtrend.
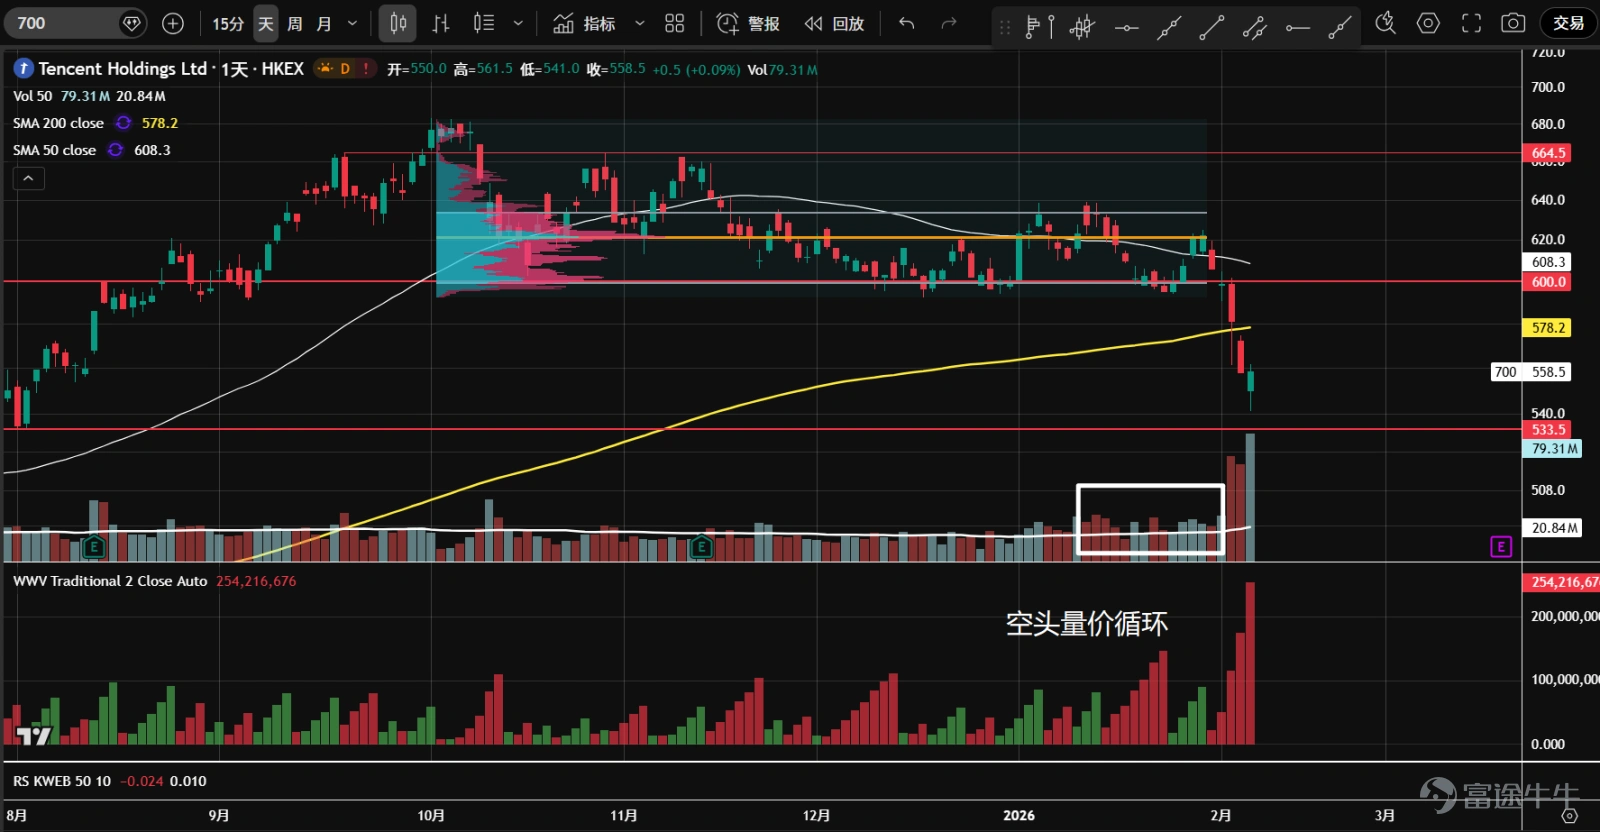
9、 $TENCENT (00700.HK)$ Since October last year, it has been consolidating horizontally with a gradually declining center of gravity, entering a bearish price-volume cycle. This week, consecutive high-volume bearish candles broke through support, triggering panic selling near the 533.5 axis. Short-term oversold, watch for a second test.
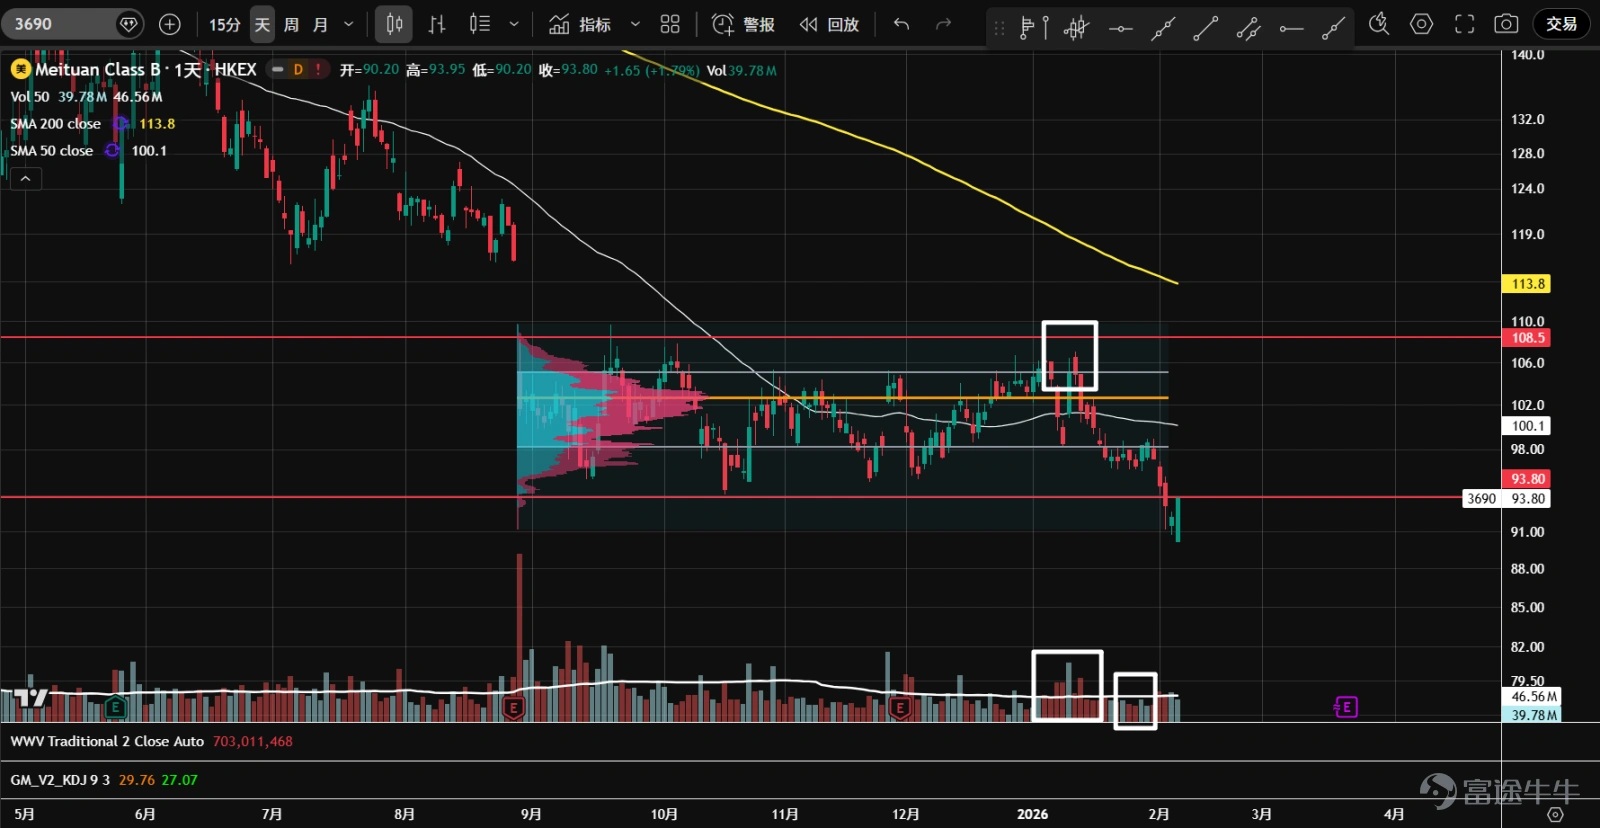
10、 $MEITUAN-W (03690.HK)$ Since September last year, it has been consolidating horizontally; at the beginning of the year, it surged towards the resistance at 108.5 without success, leading to a sharp pullback and breaking below the lower boundary of the value range. Despite a recent low-volume rebound, it failed to return to the range and broke below the support at 93.8; bearish price-volume cycle, showing distribution characteristics. If unable to recover in a short time, downward space may open up.
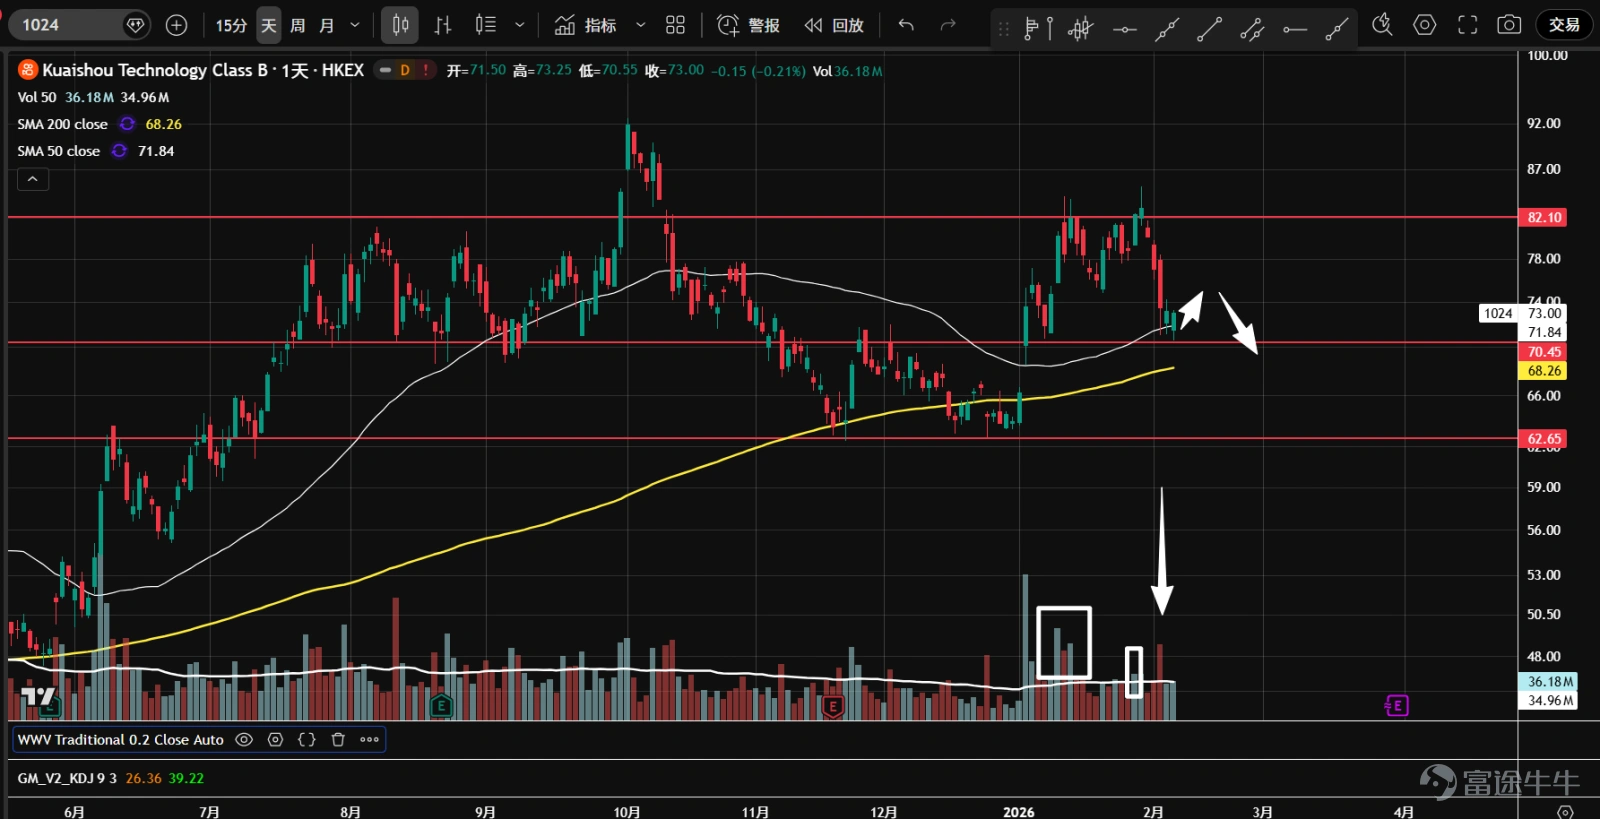
11、 $KUAISHOU-W (01024.HK)$ Since mid-January, there have been two attempts to break through the resistance at 82; the first attempt showed characteristics of a buying climax, while the second attempt saw a low-volume test followed by a high-volume plunge, starting to show signs of weakening. If subsequent rebounds are on low volume and with limited magnitude, the outlook may continue to decline.
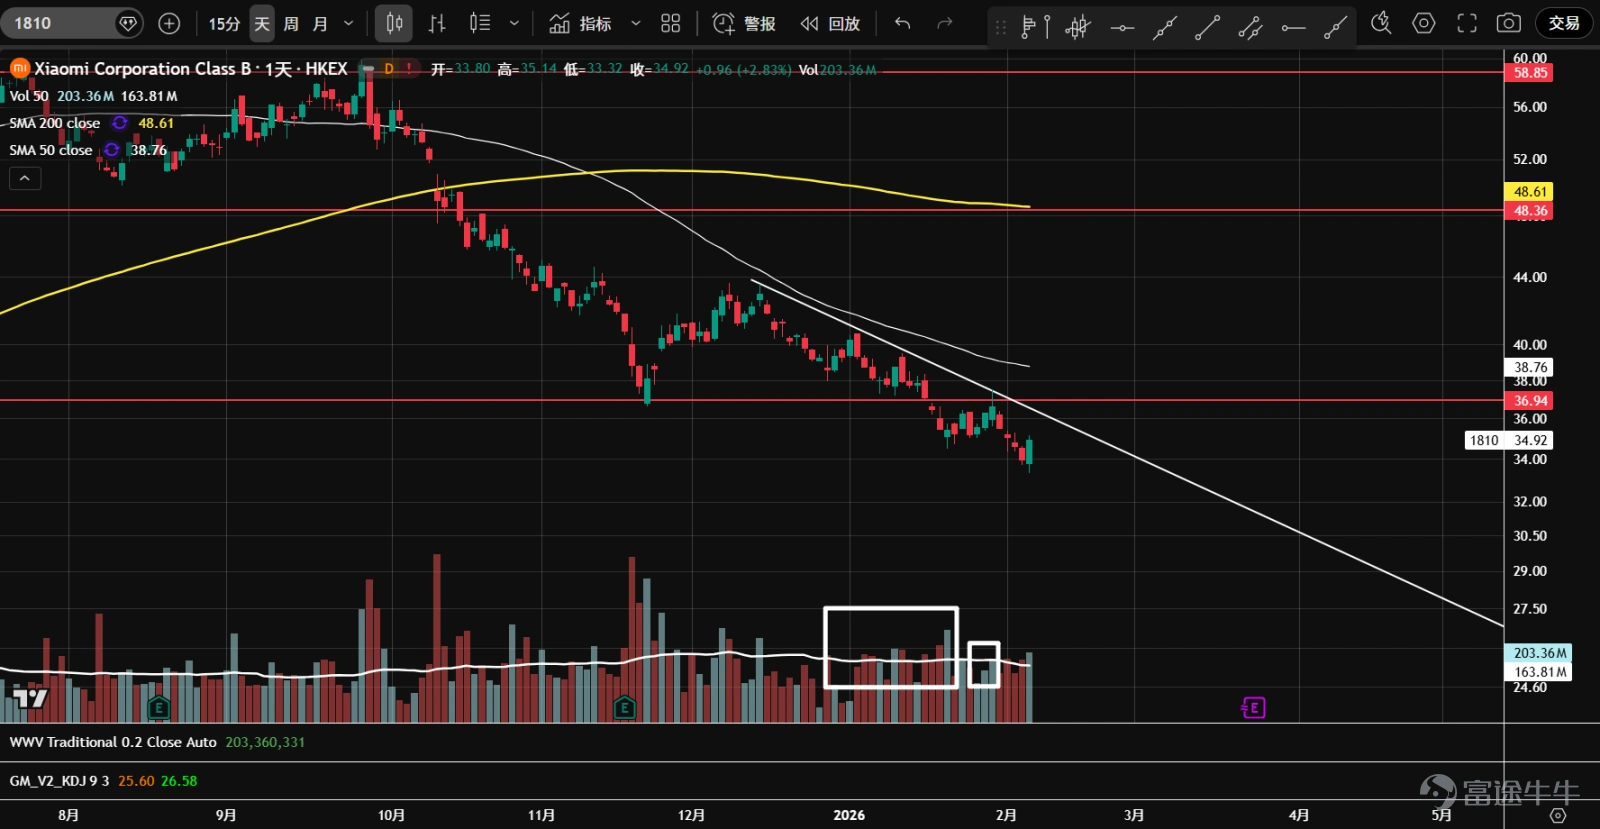
12、 $XIAOMI-W (01810.HK)$ In November last year, there was a bout of panic selling; after a small rebound proved unsuccessful, it started a continuous decline from mid-December. Initially, there was some volume contraction, but after the New Year, trading volume continued to increase, breaking through the support around 37 on high volume. The downtrend continues; not recommended to bottom-fish until the descending trend line is broken.
$S&P 500 Index (.SPX.US)$ $SPDR S&P 500 ETF (SPY.US)$ $NASDAQ 100 Index (.NDX.US)$ $Invesco QQQ Trust (QQQ.US)$ $Dow Jones Industrial Average (.DJI.US)$ $State Street® SPDR® Dow Jones Industrial Average® ETF Trust (DIA.US)$ $Russell 2000 Index (.RUT.US)$ $iShares Russell 2000 ETF (IWM.US)$ $Hang Seng Index (800000.HK)$ $Hang Seng TECH Index (800700.HK)$ $Hang Seng TECH Index ETF (03032.HK)$ $KraneShares CSI China Internet ETF (KWEB.US)$ $Direxion Daily FTSE China Bull 3X Shares ETF (YINN.US)$ $Direxion Daily FTSE China Bear 3X Shares ETF (YANG.US)$ $Invesco China Technology ETF (CQQQ.US)$
Risk Disclaimer: The above content only represents the author's view. It does not represent any position or investment advice of Futu. Futu makes no representation or warranty.Read more


Comments
to post a comment
6