
How to view the post-holiday market trend in Hong Kong stocks?

[Warrant Insights] Under Alibaba's neutral signal, how to reasonably choose warrants?
On February 5, $BABA-W (09988.HK)$
The stock closed at 159.6 yuan, a slight increase of 0.06% for the day, with a trading volume of 14.068 billion yuan. The overall trend was relatively stable, with no significant fluctuations.
Looking at data from similar tech stocks, on February 5th, most individual stocks experienced minor increases, but technically, the overall trend remains weak. Most show oversold rebound signals, differing slightly from Alibaba's neutral movement, as follows:
$TENCENT (00700.HK)$ : Closing price at 558.5 yuan, up 0.09% in a single day, stock price below MA10 (594.65 yuan), RSI at 24 in the oversold region, technical indicators suggest a buy signal;
$MEITUAN-W (03690.HK)$ : Closing price at 93.8 yuan, up 1.79% in a single day, stock price close to MA10 (95.94 yuan), RSI at 28, technical indicators suggest a buy signal, with relatively stable short-term performance;
$JD-SW (09618.HK)$ : Closing price at 108.8 yuan, up 0.83% in a single day, stock price below MA10 (112.45 yuan), RSI at 31, technical indicators suggest a buy signal, with some technical similarity to Alibaba;
$BIDU-SW (09888.HK)$ : Closing price at 140.9 yuan, up 2.70% in a single day, stock price below MA10 (150.18 yuan), RSI at 43, technical indicators suggest a neutral signal, with relatively strong rebound momentum;
In summary, on February 5, most tech stocks showed signs of oversold rebounds, with only Alibaba and Baidu signaling neutrality; the sector as a whole has short-term technical recovery opportunities but requires close attention to moving average resistance and changes in market sentiment.
On the previous day (the 5th), our [HK Stocks Broadcast]February 5th [Hong Kong Stock Podcast] Hang Seng Index, Alibaba, JD.com, HSBC, China Mobile, XPeng Motors, Yanzhou Energyincluded commentary on Alibaba: many investors believe that the current stock price has stabilized, speculating whether it might challenge the 165 yuan level; next, we’ll break down the specific trends using technical indicators. $Hang Seng Index (800000.HK)$$BABA-W (09988.HK)$$JD-SW (09618.HK)$$HSBC HOLDINGS (00005.HK)$$CHINA MOBILE (00941.HK)$$XPENG-W (09868.HK)$
Based on the given technical data, the indicator signals are relatively balanced, showing no clear bullish or bearish bias:
MA10 is at 166.3 yuan, MA30 at 157.88 yuan, MA60 at 155.33 yuan, and the current stock price (159.6 yuan) is between MA30 and MA10, squeezed by the moving averages in the short term, without forming a clear breakout or breakdown pattern, indicating a consolidation phase.
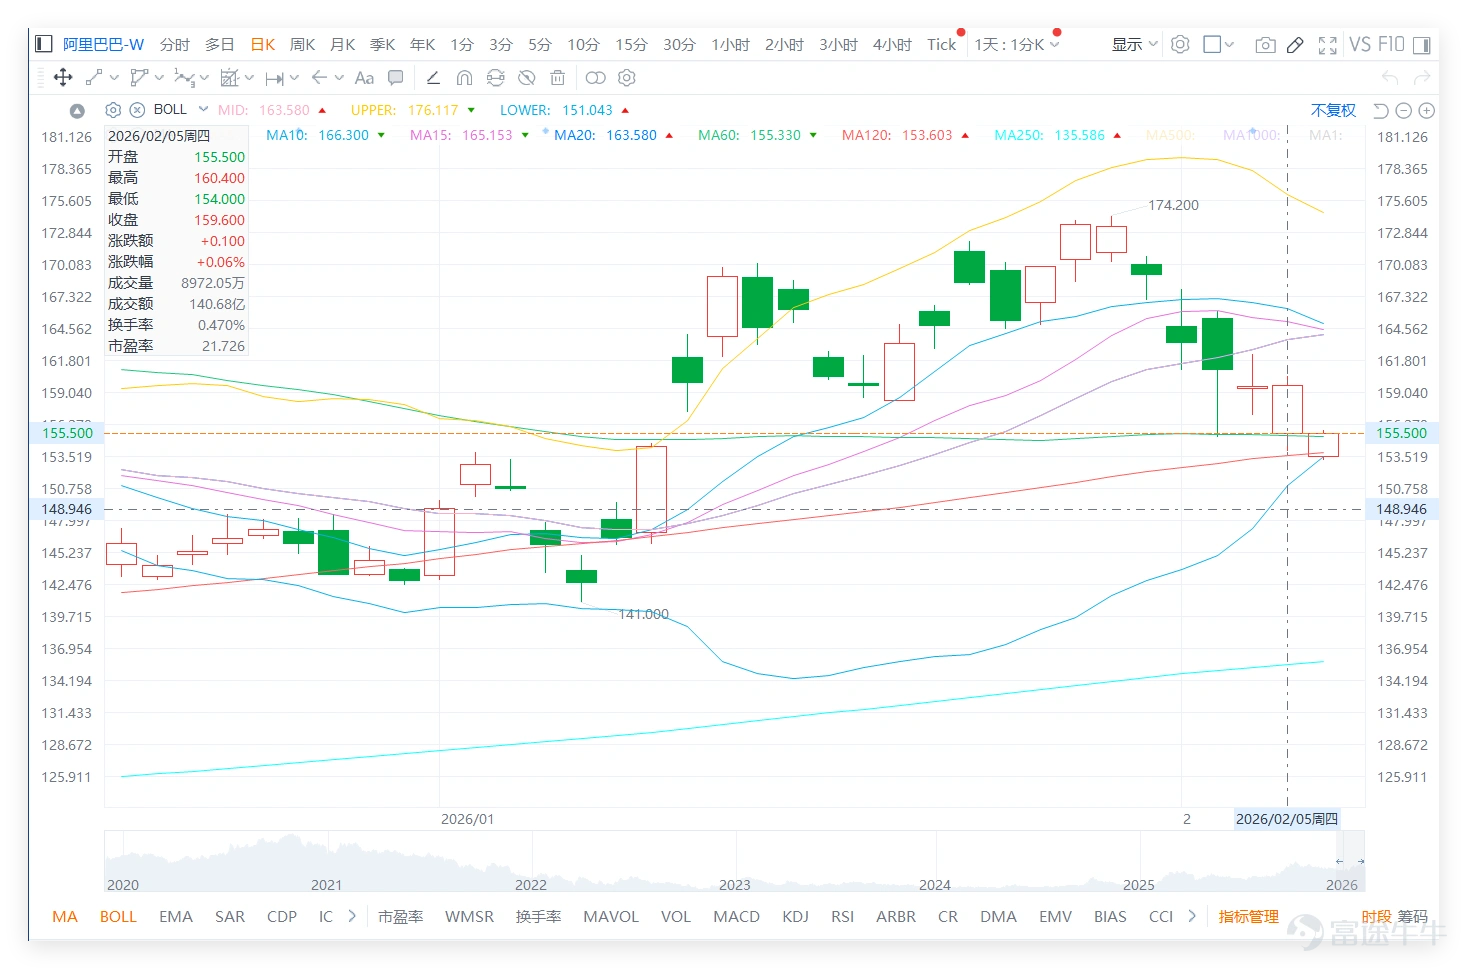
As of 11:04 AM today (the 6th), Alibaba’s latest price was 155.7 yuan, down 2.3% temporarily. Support levels are at 149.4 yuan (support 1) and 147.1 yuan (support 2), while resistance levels are at 167.7 yuan (resistance 1) and 172.1 yuan (resistance 2). The 165 yuan level, which investors are watching, lies between the current price and resistance 1, theoretically offering upward testing potential, but lacking clear short-term momentum.
The RSI indicator is at 45, in the neutral zone, neither entering overbought nor reaching oversold levels, reflecting a relative balance of short-term buying and selling forces; the MACD signal is neutral with no clear bullish or bearish reversal signal; multiple oscillation indicators (Williams %R, Stochastic Oscillator, etc.) mostly show neutrality, except for the CCI indicator which shows a buy signal, while some other indicators indicate sell signals. After offsetting each other, the overall signal strength is 9, still leaning towards neutral.

Review of warrants and bull/bear certificates: Previously, put options and bearish certificates performed prominently.
Reviewing Alibaba-related warrant and bull/bear products recommended on January 30th, which were influenced by a 4.85% drop in the underlying stock two days later, both put options and bearish certificates achieved significant gains. The specific review is as follows: $SG#ALIBARP2810N.P (58217.HK)$ : Increased by 47% after two days; $HSALIBA@EP2603D.P (21046.HK)$ : Increased by 100% after two days; $JP#ALIBARP2808J.P (59171.HK)$ : Increased by 39% after two days; $BIALIBA@EP2603A.P (20718.HK)$ : Increased by 75% after two days.
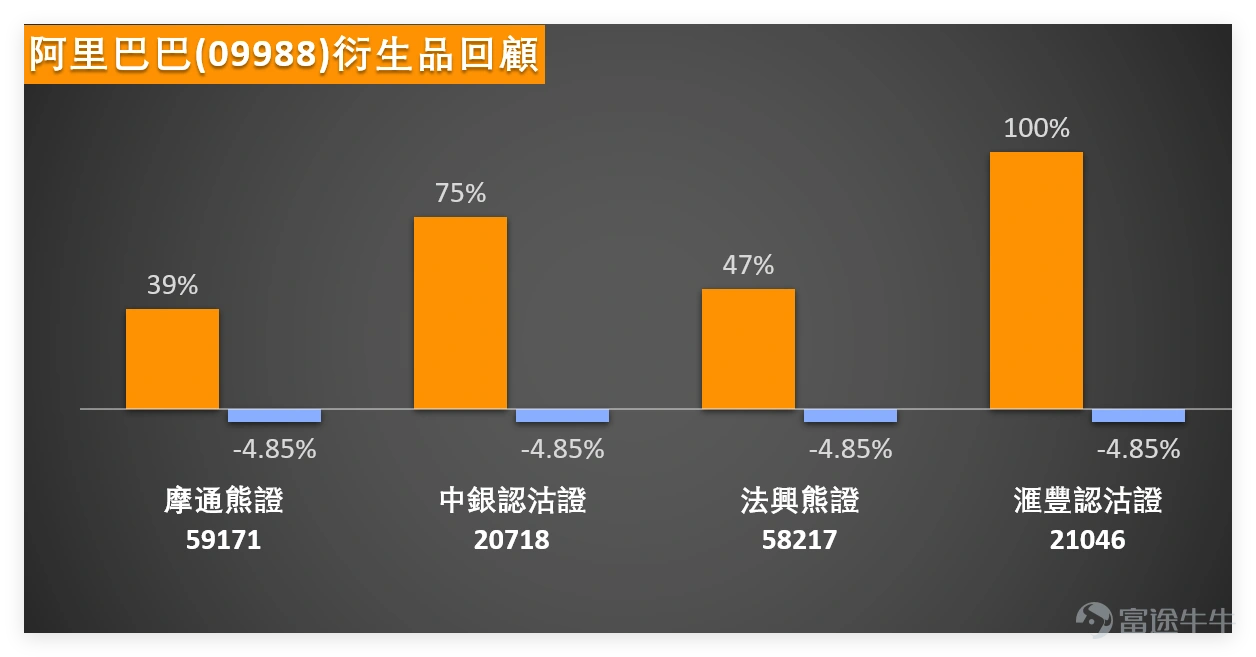
Friendly reminder: Warrant and bull/bear products carry leverage attributes with high volatility. The good performance of previous products was based on the clear trend of the underlying stock. Investors need to combine the current neutral signals of the underlying stock, choose carefully, avoid blindly following, and pay attention to risk control.
Warrant Product Highlights: Focus on low premium, reasonably leveraged products
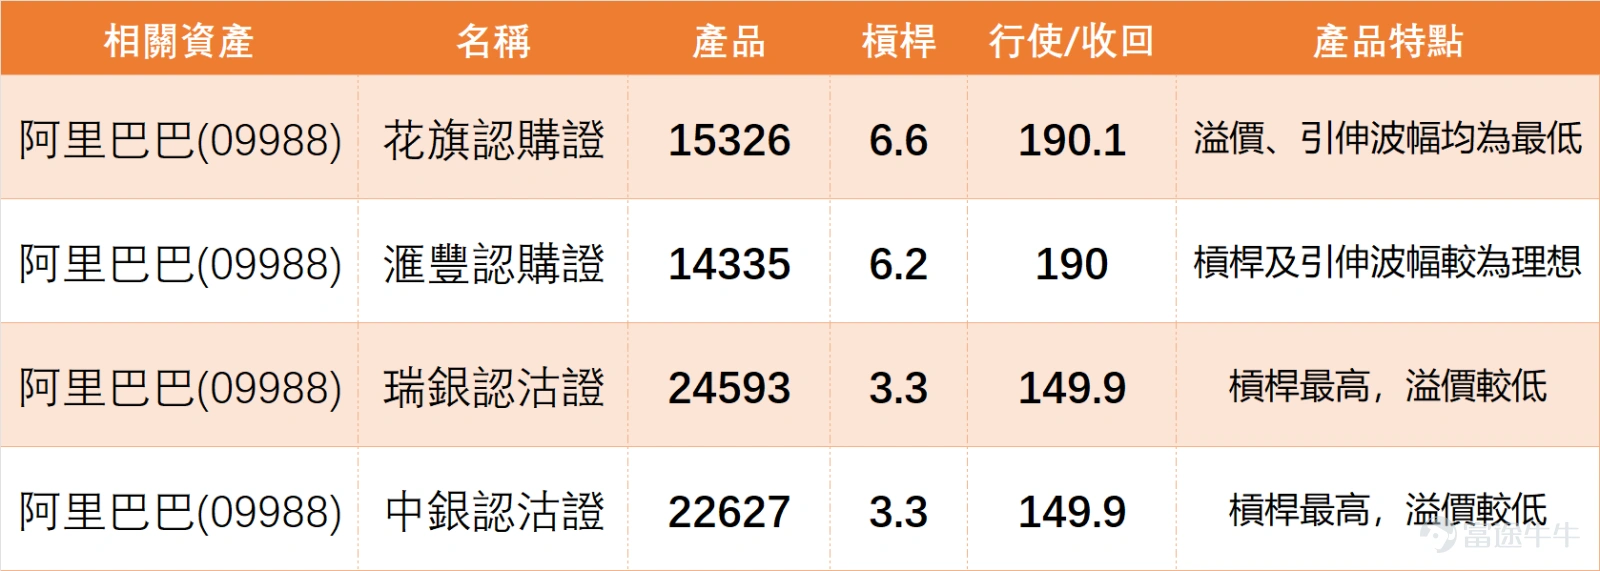
Considering Alibaba's neutral trend, two superior-direction warrant products with excellent attributes are selected for investors' reference:
1 $CTALIBA@EC2606B.C (15326.HK)$Leverage 6.6x, strike price 190.1 yuan, key advantage is the lowest premium and implied volatility among currently recommended products, with relatively controllable cost, suitable for investors optimistic about a long-term gradual recovery of the underlying stock and seeking stable leveraged returns.
2. $UBALIBA@EP2609A.P (24593.HK)$Leverage 3.3x, strike price 149.9 yuan, key advantage is relatively high leverage with low premium, suitable for investors who believe the underlying stock may test near-term support levels and wish to capture small adjustment opportunities through leverage.
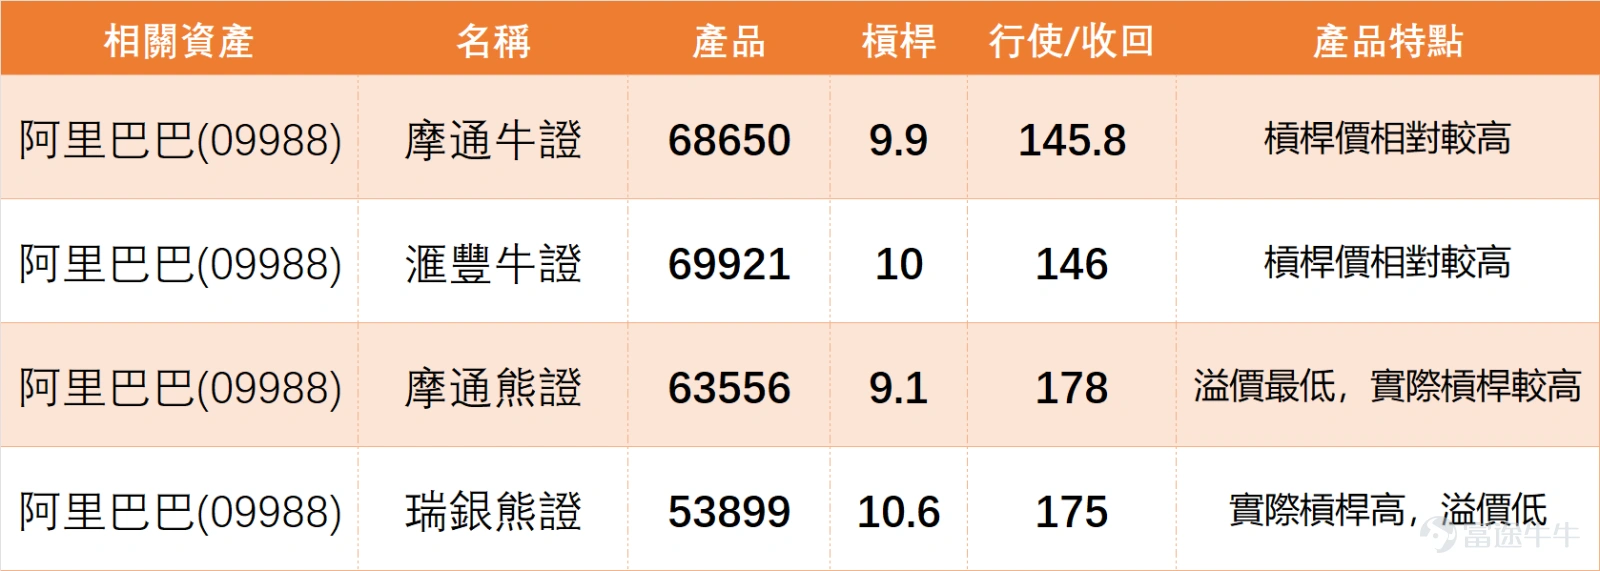
Alibaba is trading steadily. Do you think it will first test resistance at 167 yuan or support at 149 yuan in the short term?
Most similar tech stocks are rebounding from oversold conditions. Would you prioritize investing in Alibaba, Tencent, or Meituan?Come share your thoughts in the comment section.
For more analysis, be sure to follow Jenny's daily updates on "HK Stock Warrants"!
Disclaimer: This article does not constitute any investment advice.
This article is for reference only and does not constitute any investment advice. The market data, opinions, and analysis contained herein may change at any time without prior notice. We are not responsible for any loss or damage caused by reliance on the information in this article. Technical analysis only shows whether certain technical conditions are met; a comprehensive assessment of asset performance should be conducted using additional data. Decisions to trade should not be based solely on this article. Please note that past performance is not indicative of future results.
#HongKongStocks #RealTimeAnalysis #WarrantsSelection #WarrantsStrategy #DerivativesHedging #HongKongWarrantsJenny #Alibaba #TechStocks #TechnicalAnalysis
Risk Disclaimer: The above content only represents the author's view. It does not represent any position or investment advice of Futu. Futu makes no representation or warranty.Read more

Comment (1)
to post a comment
2