
How to view the post-holiday market trend in Hong Kong stocks?

Bearish and hedging strategies: Using put warrants and bear contracts to hedge against downside breakout risks
$JD-SW (09618.HK)$ Bearish and hedging strategies: Using put warrants and bear contracts to hedge against downside breakout risks
In early 2026, as the Hong Kong stock market displayed a volatile pattern overall, the price movement of JD.com (09618.HK) garnered particular attention. As of the close on February 5, JD.com's share price rose slightly by 0.83%, closing at HKD 108.8, ending a previous streak of adjustments. However, during trading, the share price briefly touched HKD 105.9, dipping below the lower Bollinger Band on the daily chart, highlighting the cautious sentiment in the market. Currently, JD.com's share price is oscillating around key technical support levels, with both downside risk and technical rebound opportunities coexisting. This clear technical setup offers derivatives investors a refined window for strategic deployment.
I. Technical Analysis: Analyzing Bullish and Bearish Signals During the Bottom-Seeking Process
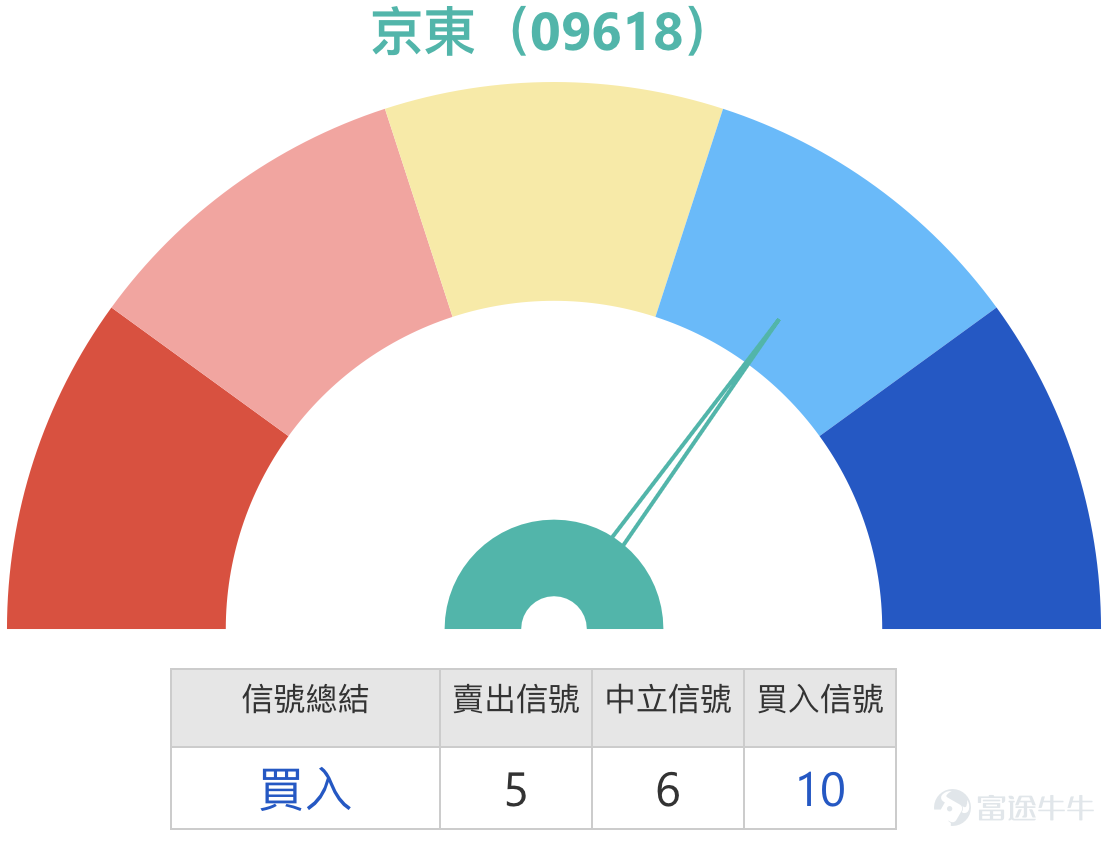
Today (6th), JD.com’s stock price closed at 106.6 yuan, down 0.02%. From a technical chart perspective, JD.com is in the process of exploring a short-term bottom. After a prolonged downturn, the stock price has fallen significantly below key moving averages such as the 10-day, 30-day, and 60-day lines. The short-term moving average system shows a bearish alignment, indicating that the trend remains weak. However, market momentum indicators have begun to show some positive changes.
On one hand, several oscillation indicators suggest that the market may be forming a short-term bottom. The Momentum Oscillation Index has issued a buy signal, and the CCI indicator has also turned into a buy signal, which is typically a technical sign that after consecutive declines, short-term selling pressure has weakened and a rebound might be brewing. On the other hand, the MACD indicator, which reflects medium-term trends, still signals a sell, and the stock price has yet to effectively reclaim any critical moving average, meaning the overall downward pressure has not been fully alleviated. This divergence between short-term momentum indicators and medium-term trend indicators suggests that any potential rebound in its early stages may face significant resistance, with complex fluctuations dominating the trend.
II. Analysis of Key Support and Resistance Levels
For JD.com, the key to the current technical landscape lies in the gain or loss of several core price levels. These price levels are not only psychological defenses for both bulls and bears but are also crucial references for derivative clause designs.
The key support area below, the first line of defense is near 104.9 yuan. This position represents the lower boundary of the recent consolidation range, and if it breaks, it would mean the failure of a short-term bottoming pattern. A more important second support level is at 100.7 yuan, which is a critical technical threshold on the medium-to-long-term chart and is expected to provide stronger support. This aligns with the analyst's view from the February 5 episode of 'BOC Guest,' which clearly stated that if the 104.9 yuan support level were breached, the next target would point toward 100.7 yuan.
In the resistance area above, a short-term rebound will first face a challenge at 113.1 yuan. This position is close to the 10-day moving average and represents a dense area of positions during the recent decline. Stronger resistance lies at 116.9 yuan, which is not only a significant psychological round-number level but also a technical observation point for determining whether the stock price can reverse its recent downtrend and enter a larger-scale rebound.

III. Integration of 'HKEX Podcast' Insights and Market News Interpretation
In the February 5 episode of 'HKEX Podcast,' host Simon provided profound insights on JD.com’s trend. The show noted that when the stock price broke through key support levels, some bullish warrants with mandatory call prices set too close to the market price were forcibly redeemed. This corroborates JD.com’s current technical situation of breaking below the lower Bollinger Band, serving as a warning to investors. The podcast emphasized that in an increasingly volatile market, “managing the risk of mandatory redemption is crucial” when choosing derivatives. Investors should prioritize products with sufficient buffer in their redemption prices to avoid forced redemption risks caused by abnormal stock price fluctuations, even if this means slightly reduced leverage, thereby significantly improving investment safety.
IV. Review of Warrant Products: Leveraging Declining Trends
Looking back at recent market performance, it is evident that when the underlying stock exhibits a clear one-sided downtrend, bearish derivatives amplify returns through leverage. On February 2, the market was bearish on JD.com. Data shows that over the following two trading days, JD.com’s stock price fell cumulatively by 2.35%. During this period, related bearish derivatives recorded significant gains far exceeding the stock’s drop: J.P. Morgan Bear Certificate (54827) rose 12%, CSC Put Warrant (24237) increased by 12%, UBS Group Bear Certificate (56284) climbed 11%, and J.P. Morgan Put Warrant (18584) rose 10%. This performance demonstrates that when accurately predicting short-term market direction, using warrants and bull/bear certificates can deploy capital more effectively to address market volatility strategically.

5. Current Analysis of Warrant and Bull/Bear Certificate Terms and Strategy Correlation
Given JD.com's share price oscillating near key support levels with an unclear overall trend, investors can choose derivatives closely tied to key technical levels based on their risk tolerance and market outlook.
Bullish Strategy: Betting on Technical Rebound, Strict Risk Control
If investors believe the stock price, after consecutive declines, could find support around HKD 104.9 or HKD 100.7 and rebound, they may consider the following products. When choosing such products, utmost attention must be paid to the safety of the call price.
* BNP Paribas Bull (68271) and J.P. Morgan Bull (67330) $JP#JDCOMRC2612A.C (67330.HK)$ : The call prices of these two bull certificates are set at HKD 95, far below the current stock price and the key second support level of HKD 100.7, offering significant safety buffer. Their actual leverage is approximately 6.6x, with characteristics described as 'highest actual leverage, lowest premium' and 'high actual leverage, low premium.' These are ideal for cautious investors who want to bet on a rebound but are highly concerned about unexpected breakdowns triggering mandatory recall. This aligns perfectly with the suggestion from *HK Stock Podcast* to select call prices with sufficient buffer.
* HSBC Call Warrant (23803) and Bank of China Call Warrant (23759) $BIJDCOM@EC2605A.C (23759.HK)$ : For investors unwilling to bear the mandatory recall risk of bull/bear certificates, call warrants can be considered. Both products have an exercise price of HKD 126.98, moderately out-of-the-money, providing about 8x actual leverage. Among them, the HSBC Call Warrant has the advantage of 'lowest premium, lowest implied volatility.' These products are suitable for betting that the stock price will effectively break through resistance levels at HKD 113.1 or even HKD 116.9, leading to a substantial corrective rally.

Bearish or Hedging Strategy: Guarding Against Downside Break Risk
If investors believe the current technical rebound is weak and the stock price may eventually break below HKD 104.9, seeking support at HKD 100.7 or lower, they may consider the following products.
J.P. Morgan Put Warrant (18584) $JPJDCOM@EP2604A.P (18584.HK)$ Credit Suisse Put Warrant (24237) $CIJDCOM@EP2604A.P (24237.HK)$ : The strike prices of these two put warrants are 106.66 yuan and 106.56 yuan, respectively, very close to the first support level at 104.9 yuan. Their characteristics of 'ideal leverage and implied volatility' and 'lowest premium and implied volatility' make them effective tools for hedging the risk of long stock positions or directly expressing the view that the stock price will test the lower support level.
HSBC Bear Certificate (61564) and Societe Generale Bear Certificate (54903) $SG#JDCOMRP2812K.P (54903.HK)$ : The forced recovery prices of these two bear certificates are set at 130 yuan, far above the current stock price and the first resistance level at 113.1 yuan, providing a very generous safety margin. Their terms of 'highest actual leverage with lower premium' and 'lowest premium with relatively higher actual leverage' make their risks relatively controllable, suitable for expressing the view that the upside potential of the stock price rebound is limited and will continue to face pressure.

VI. Professional Tips on Derivatives Investment
Warrants and bull/bear certificates are complex financial derivatives whose performance depends not only on the direction of the underlying stock price. Bull/Bear certificates have a mandatory recovery mechanism; if the underlying stock price hits the recovery price, the product will terminate immediately, and investors may lose all principal. The value of a warrant is simultaneously affected by multiple factors such as the underlying stock price, implied volatility, time decay, and market liquidity. In the 'HK Stocks Podcast,' it was particularly reminded that in volatile markets, risk control should be prioritized. Before trading, investors must carefully read relevant listing documents to fully understand the product features and all associated risks.
Interactive Q&A Session
Based on the game theory surrounding JD.com's stock price near the current key technical levels, we pose the following questions and welcome investors to share your insights:
1. As the stock price oscillates near the key support level of 104.9 yuan, do you think the market should focus more on the opportunity for a short-term rebound or on guarding against the risk of a breakdown?
2. When choosing bull certificates for a rebound play, would you prioritize the potential returns from higher leverage or place more importance on the safety buffer provided by the recovery price?
We look forward to your rational exchange and discussion in the comment section.
Friendly reminder: This article does not constitute any investment advice.
This article is for reference only and does not constitute any investment advice. The market data, opinions, and analysis contained herein may change at any time without prior notice. We are not responsible for any loss or damage caused by reliance on the information in this article. Technical analysis only shows whether certain technical conditions are met; a comprehensive assessment of asset performance should be conducted using additional data. Decisions to trade should not be based solely on this article. Please note that past performance is not indicative of future results.
#JD.com #TechnicalAnalysis #SupportResistanceLevels #Warrants #BullBearContracts #HKDerivatives #HKStocksPodcast #ForcedRecoveryRisk #ShortTermTrading #LeverageEffect
Risk Disclaimer: The above content only represents the author's view. It does not represent any position or investment advice of Futu. Futu makes no representation or warranty.Read more

Comments
to post a comment
4
6