

How to view the post-holiday market trend in Hong Kong stocks?

February 5th [Hong Kong Stock Podcast] Hang Seng Index, Alibaba, JD.com, HSBC, China Mobile, XPeng Motors, Yanzhou Energy
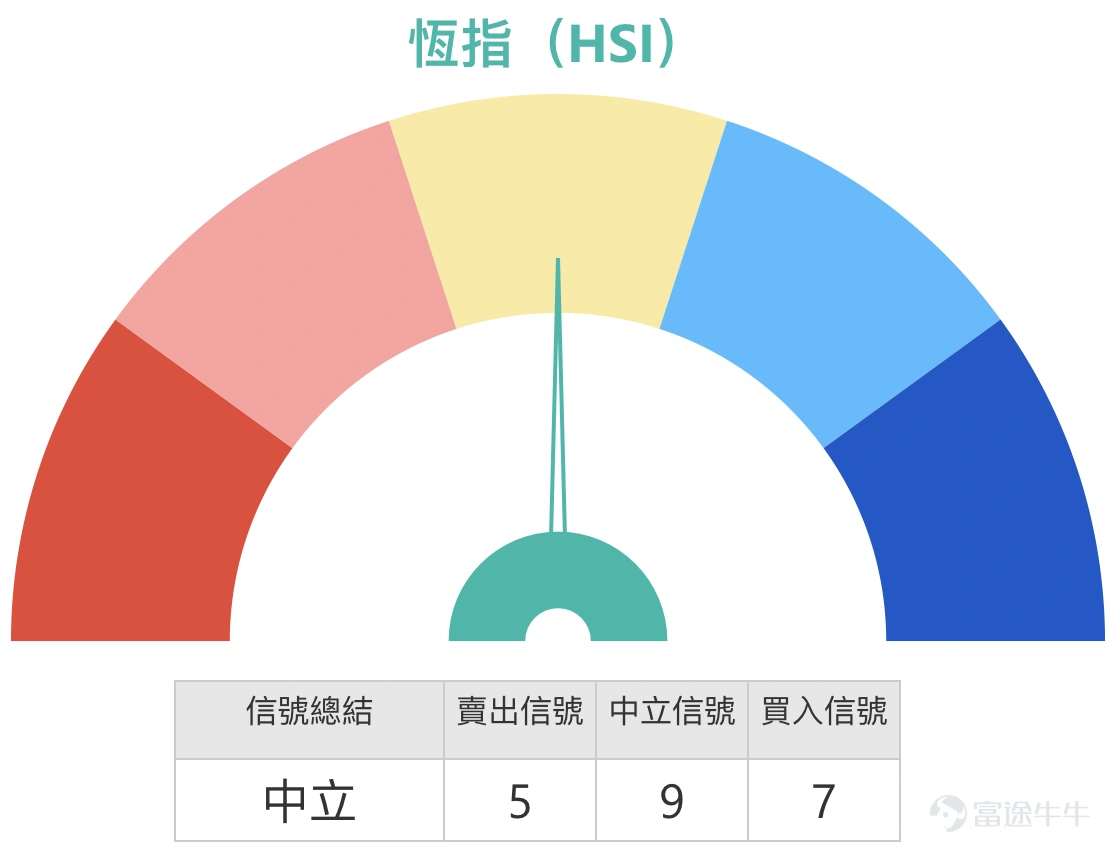
Simon: Hello everyone, let's review today’s (February 5th) stock market performance. As you can see, at the end of today (February 5th), the Hang Seng Index... $Hang Seng Index (800000.HK)$ Finally, it managed to close slightly higher. In fact, today’s (February 5th) high-low volatility was quite significant, with a range of about 500 points, and ultimately ended with a small gain. The trading volume was also slightly higher than yesterday. The closing price was 26,885 points, which is relatively close to the middle line of the Bollinger Bands. Some investors believe that the adjustment has been completed, so they are continuing to buy bull certificates; however, others feel that the market will continue to decline and may reduce some related positions.
From a technical signal perspective, there is no clear direction for now, remaining in a 'neutral' state. This is mainly because the Hang Seng Index’s closing price is near the middle line of the daily chart's Bollinger Bands, and most technical indicators lean towards neutrality, which is understandable. For your reference, here are the support and resistance levels: the support level is around 26,231 points, approximately 600 points away from the closing price; the resistance level is around 27,400 points, also about 600 points away from the closing price.
If you want to buy bull certificates, it is recommended to choose those further away, such as between 25,800 to 26,200 points, or simply put, closer to the 26,000 or 25,800-point mark, which would be slightly safer; if you prefer bearish certificates, after breaking through 27,400 points, the next resistance level is roughly around 27,900 points. Thus, choosing bearish certificates closer to the 27,900-point mark would have a lower risk of being called back. $BI#HSI RP2803J.P (63388.HK)$$BI-HSI @EP2603A.P (20720.HK)$$HS-HSI @EP2603A.P (20877.HK)$$BI#HSI RP2803K.P (68550.HK)$

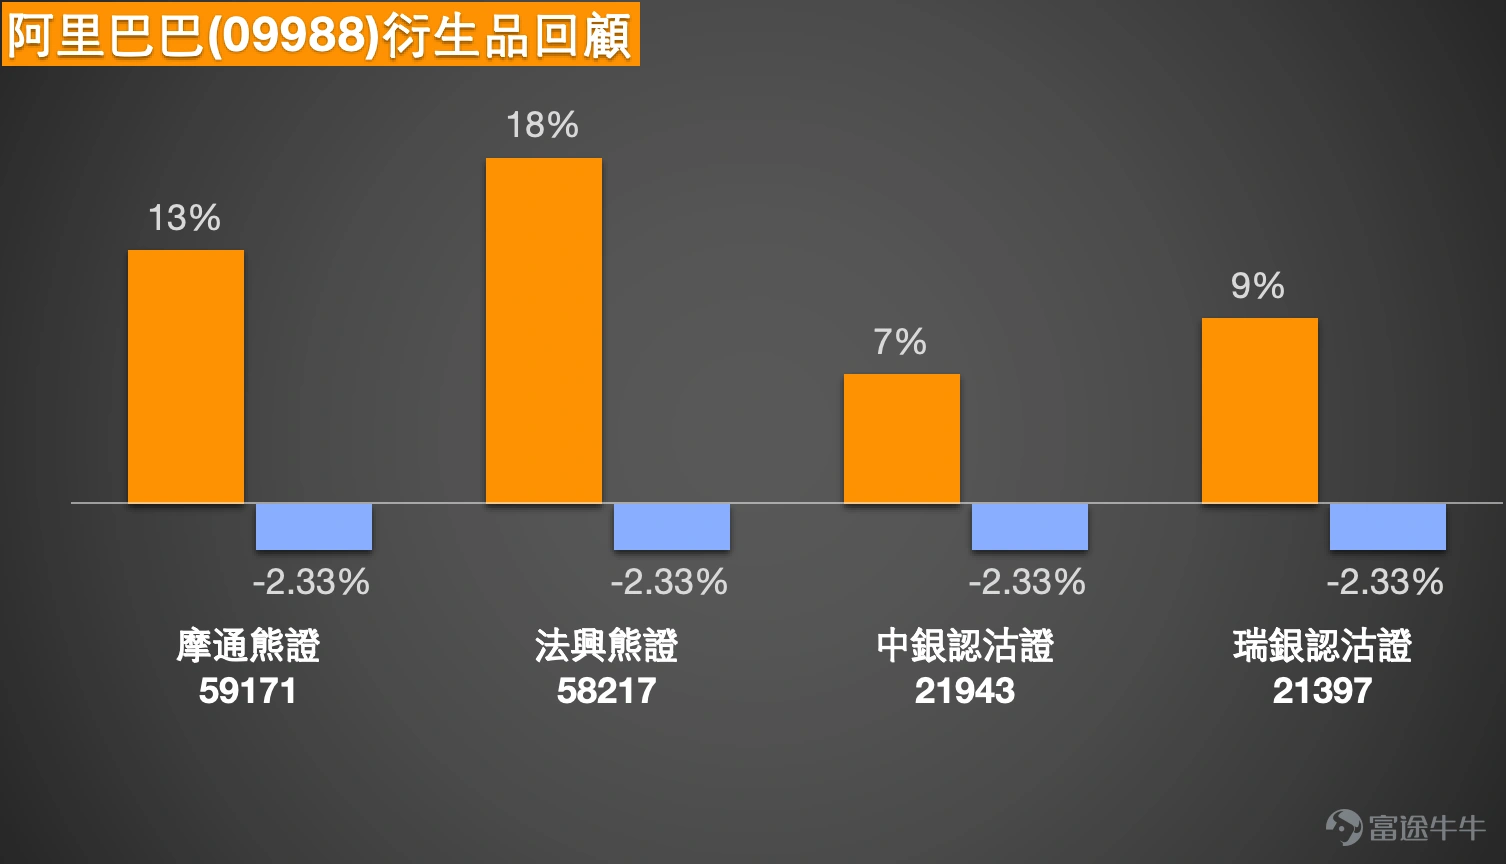
Simon: The first stock is Alibaba (9988). $BABA-W (09988.HK)$ Based on the closing price, today (the 5th), the overall movement was a slight increase. The stock price didn’t change much and remained relatively stable, staying around the same level as yesterday. Some investors believe it has stabilized, and there might be a chance to challenge the resistance at around 165 yuan. From a technical analysis perspective, it’s currently in a 'neutral' state with no clear direction. Although the resistance is near 167 yuan, theoretically, there's potential to break through 165 yuan, but short-term technical signals remain neutral, so it may take some time to see a breakout. $JP#ALIBARP2808J.P (59171.HK)$$SG#ALIBARP2810N.P (58217.HK)$$BIALIBA@EP2606B.P (21943.HK)$$UBALIBA@EP2604C.P (21397.HK)$

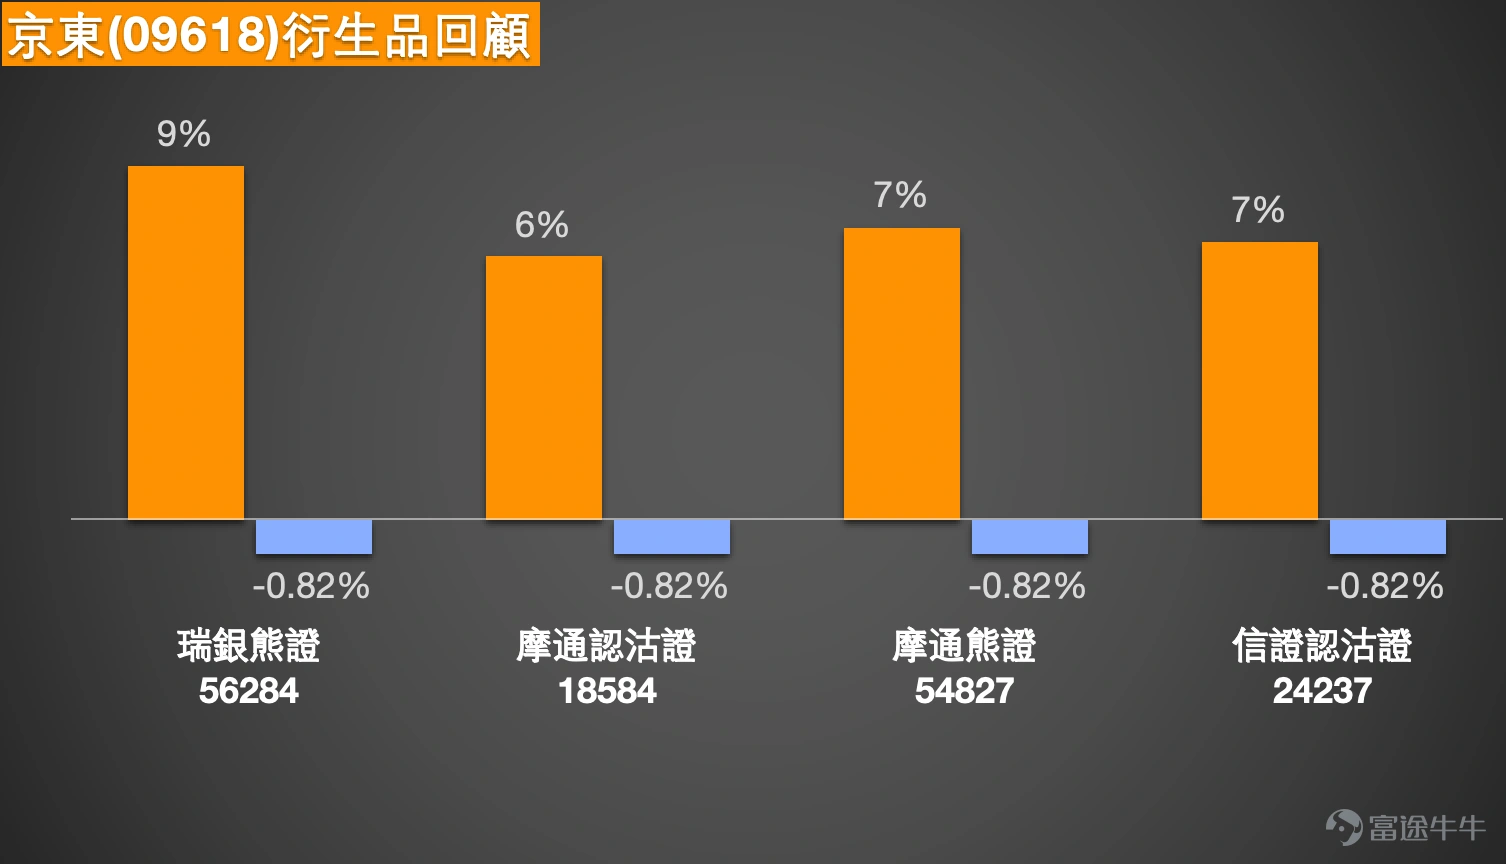
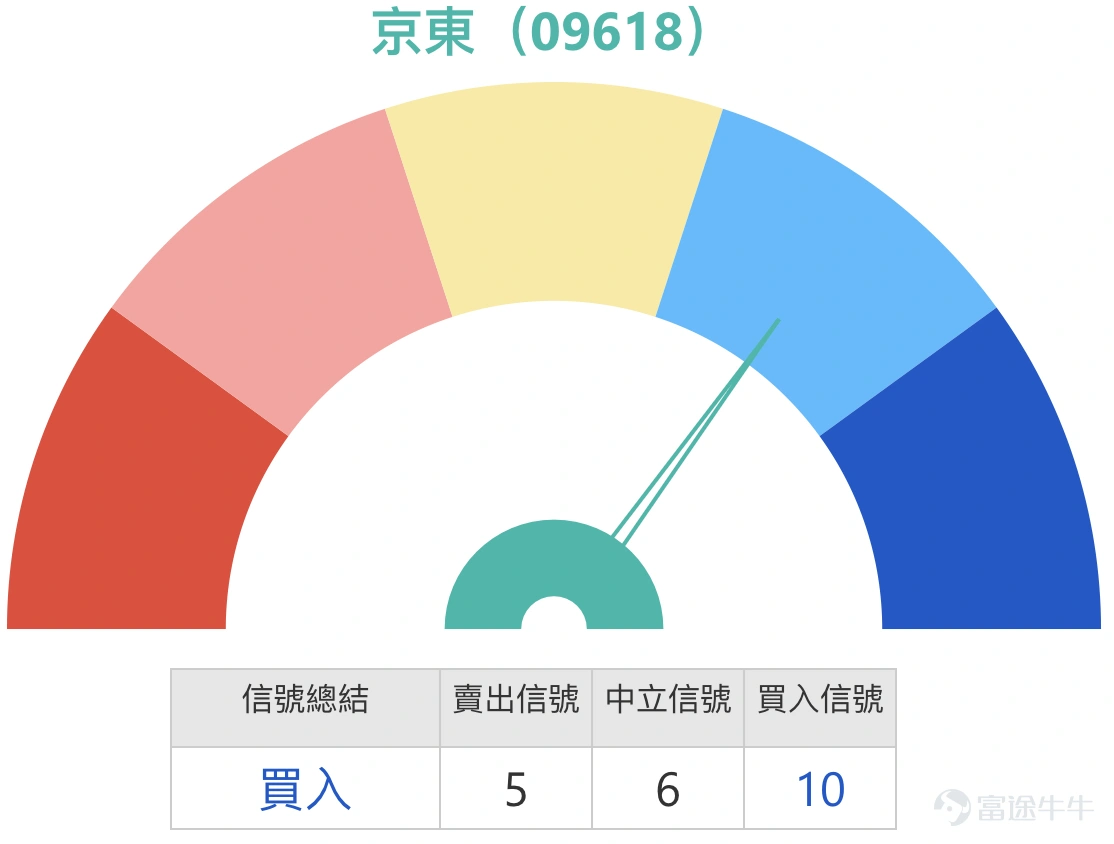
Simon: The second stock is JD.com (9618). $JD-SW (09618.HK)$ The recent performance hasn't been ideal, and it has fallen for a period of time. Today (the 5th), although the closing price slightly rebounded with a small increase compared to yesterday, trading volume increased. However, during the session, the price hit a low of 105.9 yuan, breaking below the lower Bollinger Band on the daily chart, indicating unfavorable momentum. Some investors are wondering if this could be a bottom signal and whether they should buy bull certificates. According to technical signals, there is a majority showing a 'buy' signal, though it hasn't reached a strong buy yet. Support lies at 104.9 yuan, and if that level breaks, the next target would be 100.7 yuan. Investors looking to buy bull certificates should choose products with a stop-loss around 100 yuan or lower to minimize risk. $UB#JDCOMRP2808B.P (56284.HK)$$JPJDCOM@EP2604A.P (18584.HK)$$JP#JDCOMRP2812B.P (54827.HK)$$CIJDCOM@EP2604A.P (24237.HK)$
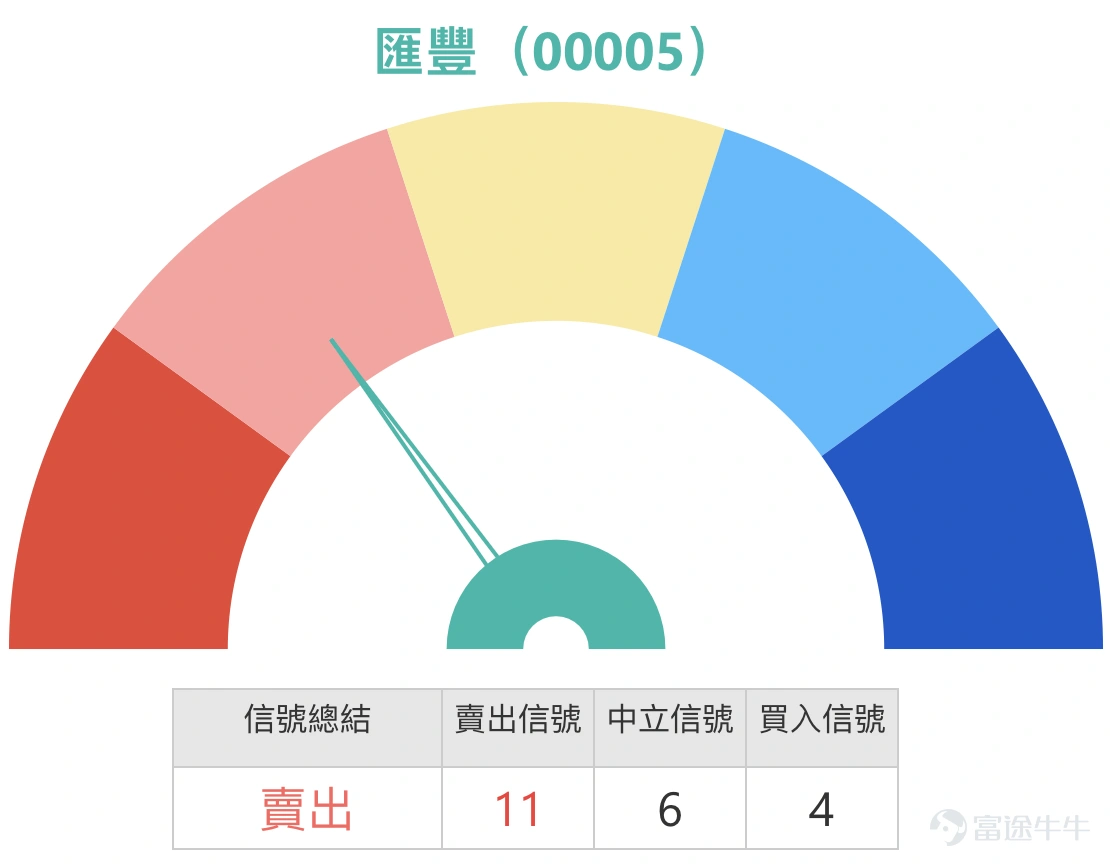
Simon: The third stock is HSBC Holdings (00005). $HSBC HOLDINGS (00005.HK)$ Today (the 5th), although the stock price recorded a decline, the overall change wasn’t significant, remaining in a sideways pattern compared to the past two days. However, it's worth noting that today, amid a falling market, trading volume increased compared to yesterday. Some investors are asking if there is an opportunity to challenge 150 yuan. Currently, resistance is at 142.5 yuan, with another level at 146.6 yuan. Reaching 150 yuan might take some time. Moreover, short-term technical signals are leaning towards 'sell,' making the likelihood of breaking out of the sideways pattern and continuing upward in the short term relatively low. $BI-HSBC@EC2609C.C (24405.HK)$$BI-HSBC@EC2610A.C (24409.HK)$

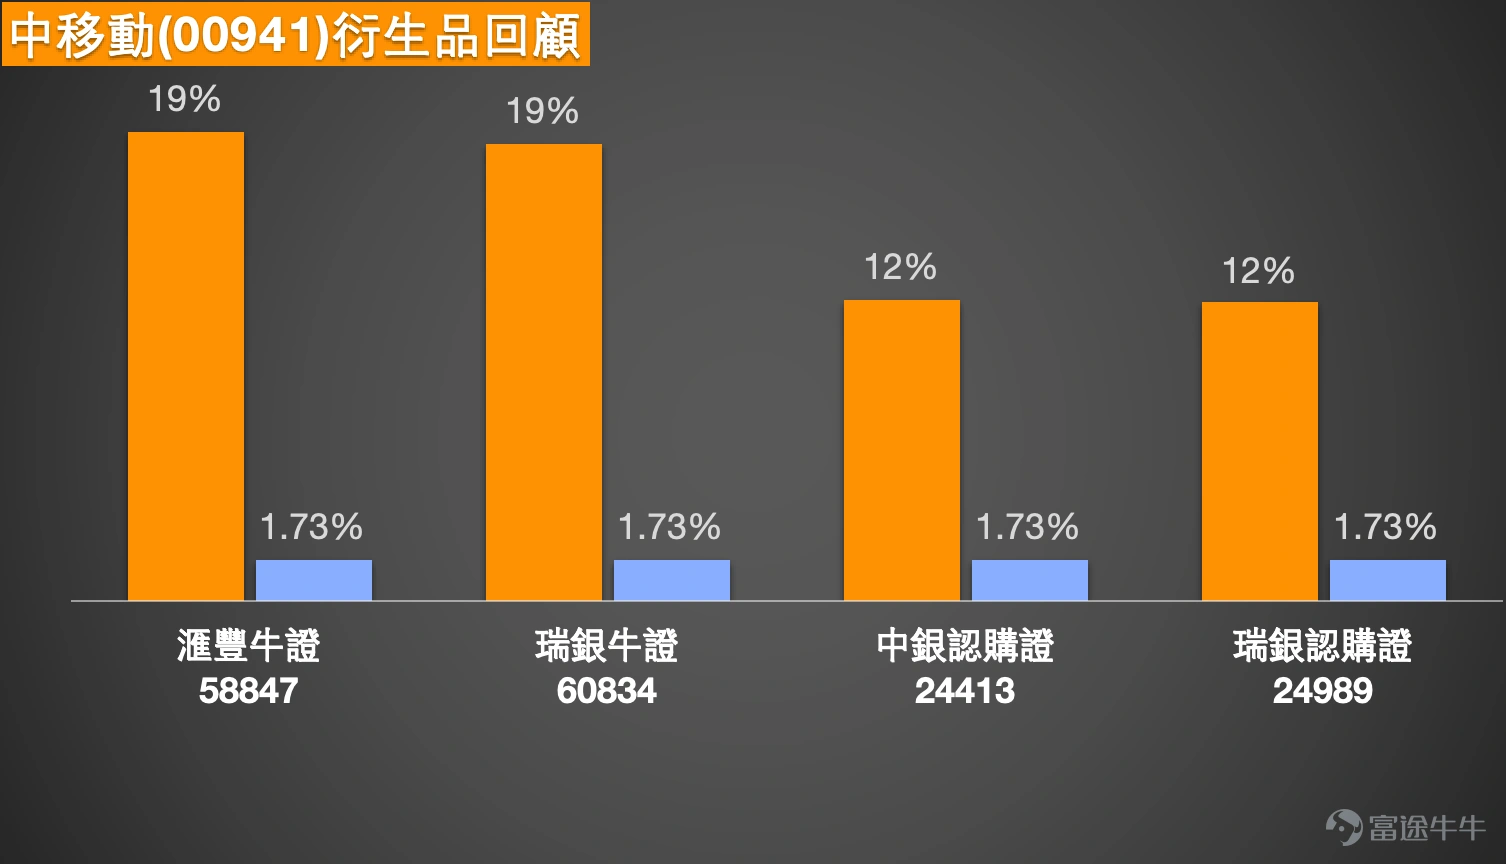
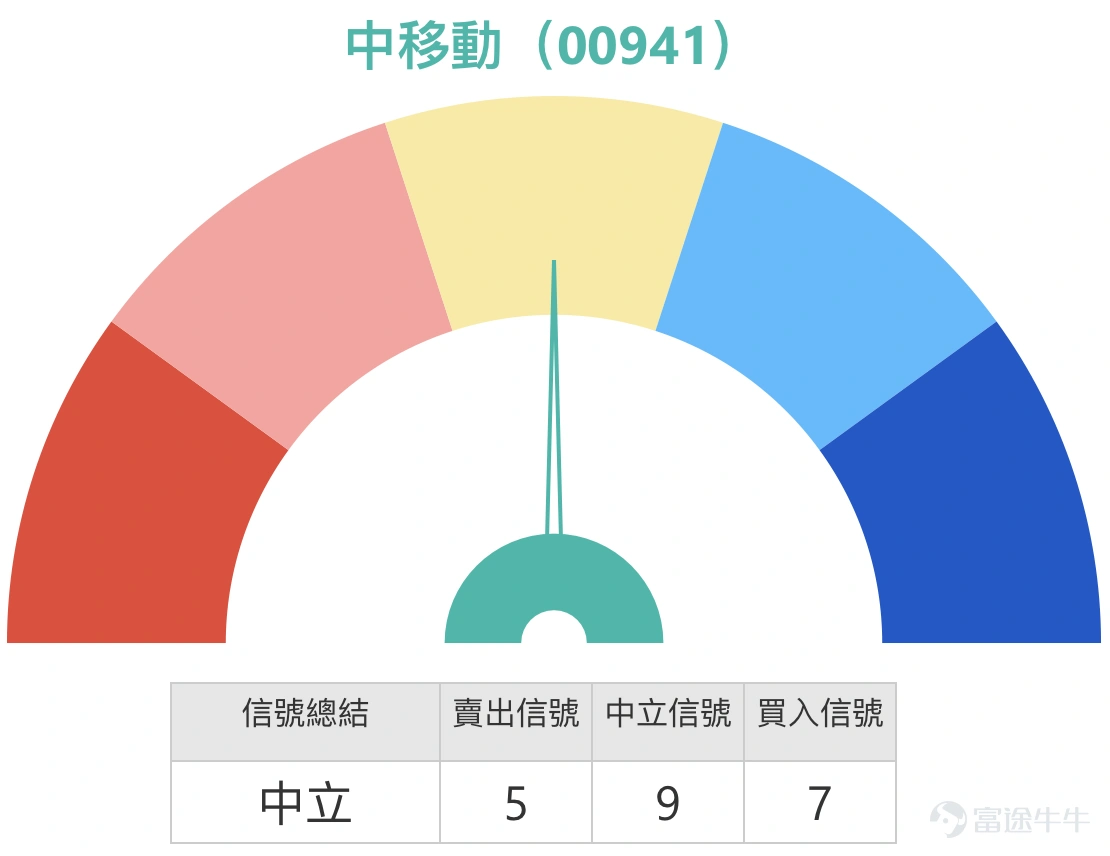
Simon: The fourth stock is China Mobile (941). $CHINA MOBILE (00941.HK)$ The trend has been quite surprising, with three consecutive days of gains. Previously, it had fallen to a low of 75.85 yuan but rebounded from the bottom of the Bollinger Band. Today (the 5th), the closing price was 80.4 yuan, breaking above the midline of the Bollinger Band. Some investors are asking about further upside potential, while early buyers of bull certificates have chosen to partially take profits and exit. This strategy is advisable since it locks in some profit, reduces psychological pressure, and frees up more capital. Current resistance is at 83.6 yuan, with the next target at 86.9 yuan. Notably, 83.6 yuan has already surpassed the top line of the daily Bollinger Band, so we can watch if there's a short-term opportunity to reach that level. $HS#C MOBRC2706B.C (58847.HK)$$UB#C MOBRC2709B.C (60834.HK)$$BI-CMOB@EC2609A.C (24413.HK)$$UB-CMOB@EC2609A.C (24989.HK)$
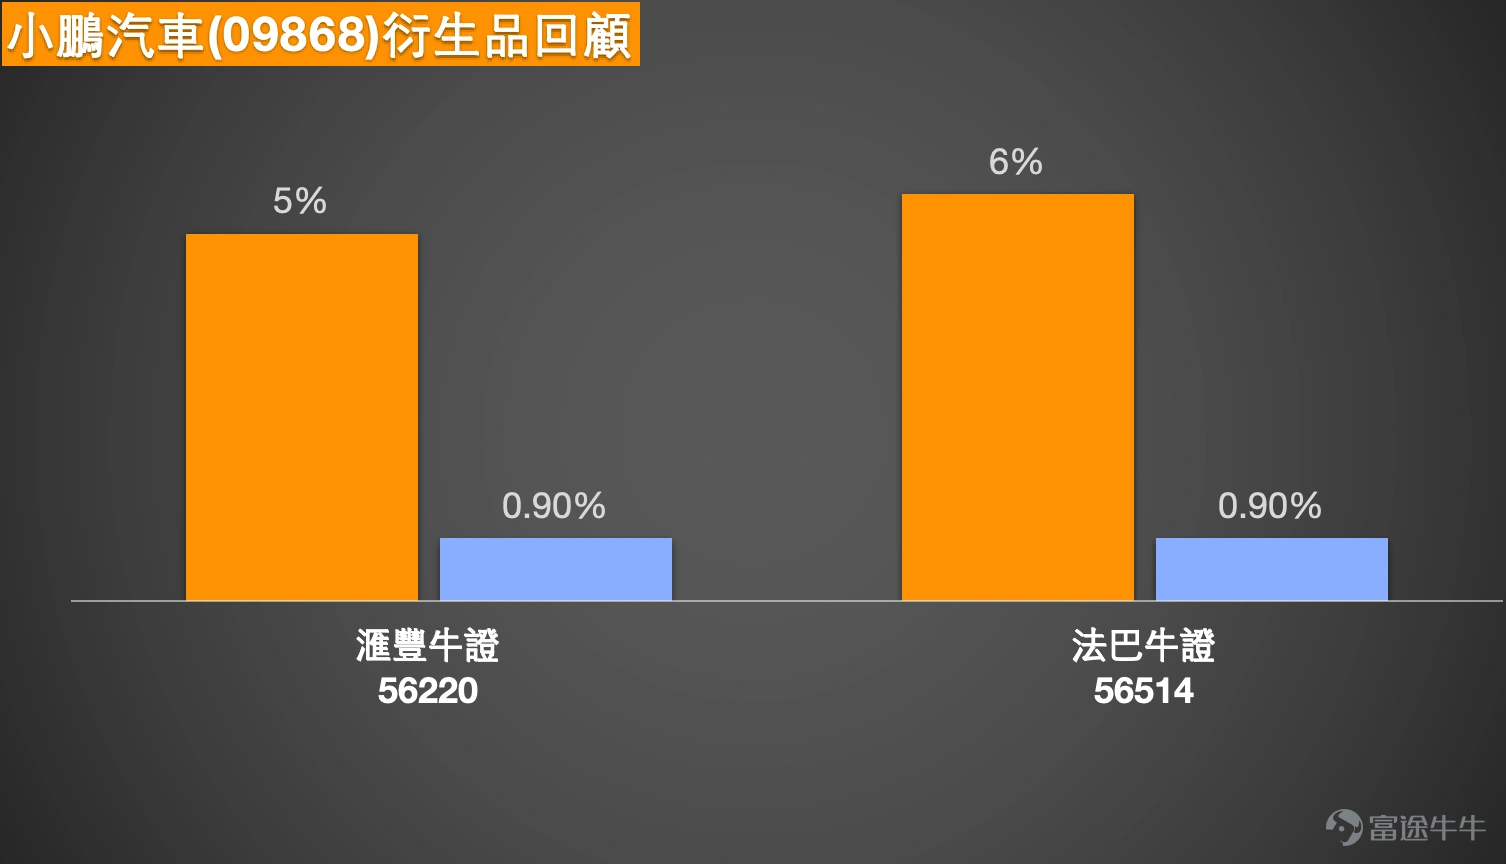
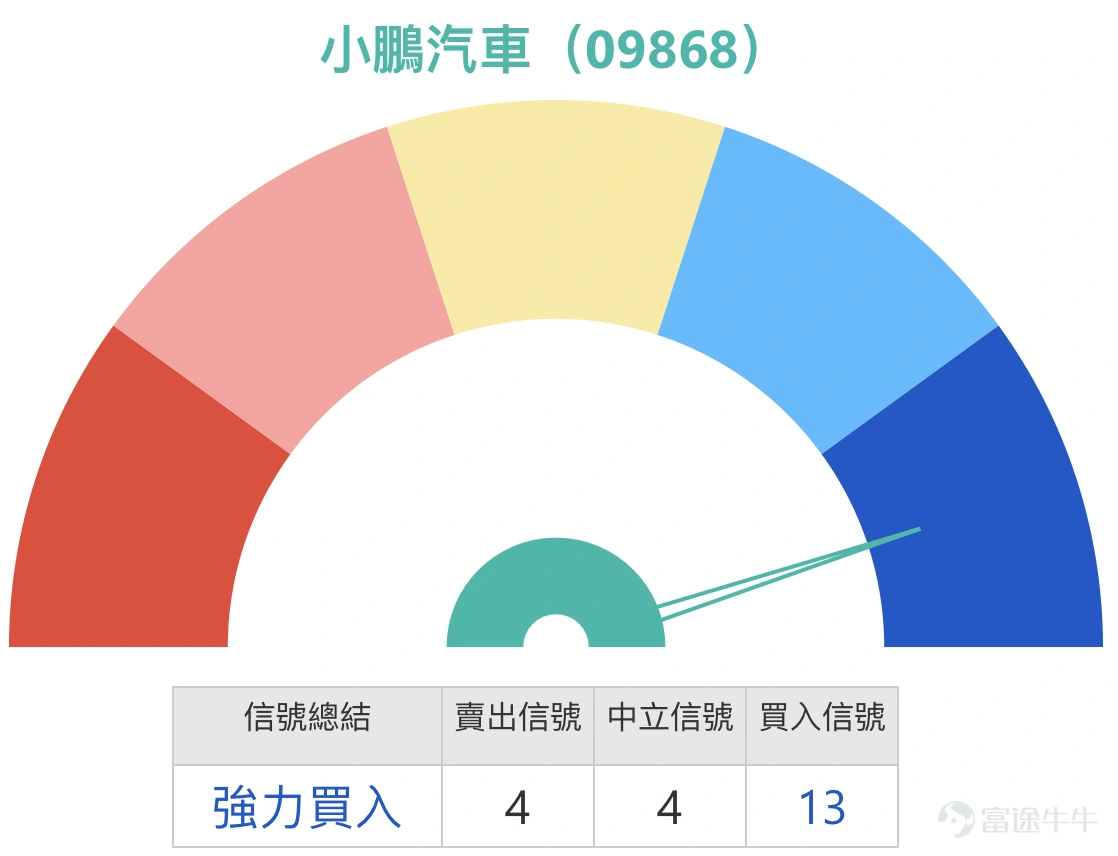
Simon: The fifth stock is XPeng Motors (9868). $XPENG-W (09868.HK)$ Today (the 5th), the closing price saw a minor increase, but recently, the stock price has been consolidating at a low level. The recent movements have been stable, but for investors, prolonged consolidation at these levels might feel uncomfortable because historically, the stock often declines after such periods. However, there are exceptions; last time when the price fell near the lower Bollinger Band, it rebounded, so will it repeat this time? From a technical standpoint, the short-term signal is 'strong buy,' which investors interested in this stock can consider. Current resistance is at 73.3 yuan, close to the midline of the Bollinger Band, so let’s monitor if it has a chance to rebound towards this level. $HS#XPENGRC2610A.C (56220.HK)$$BP#XPENGRC2803B.C (56514.HK)$
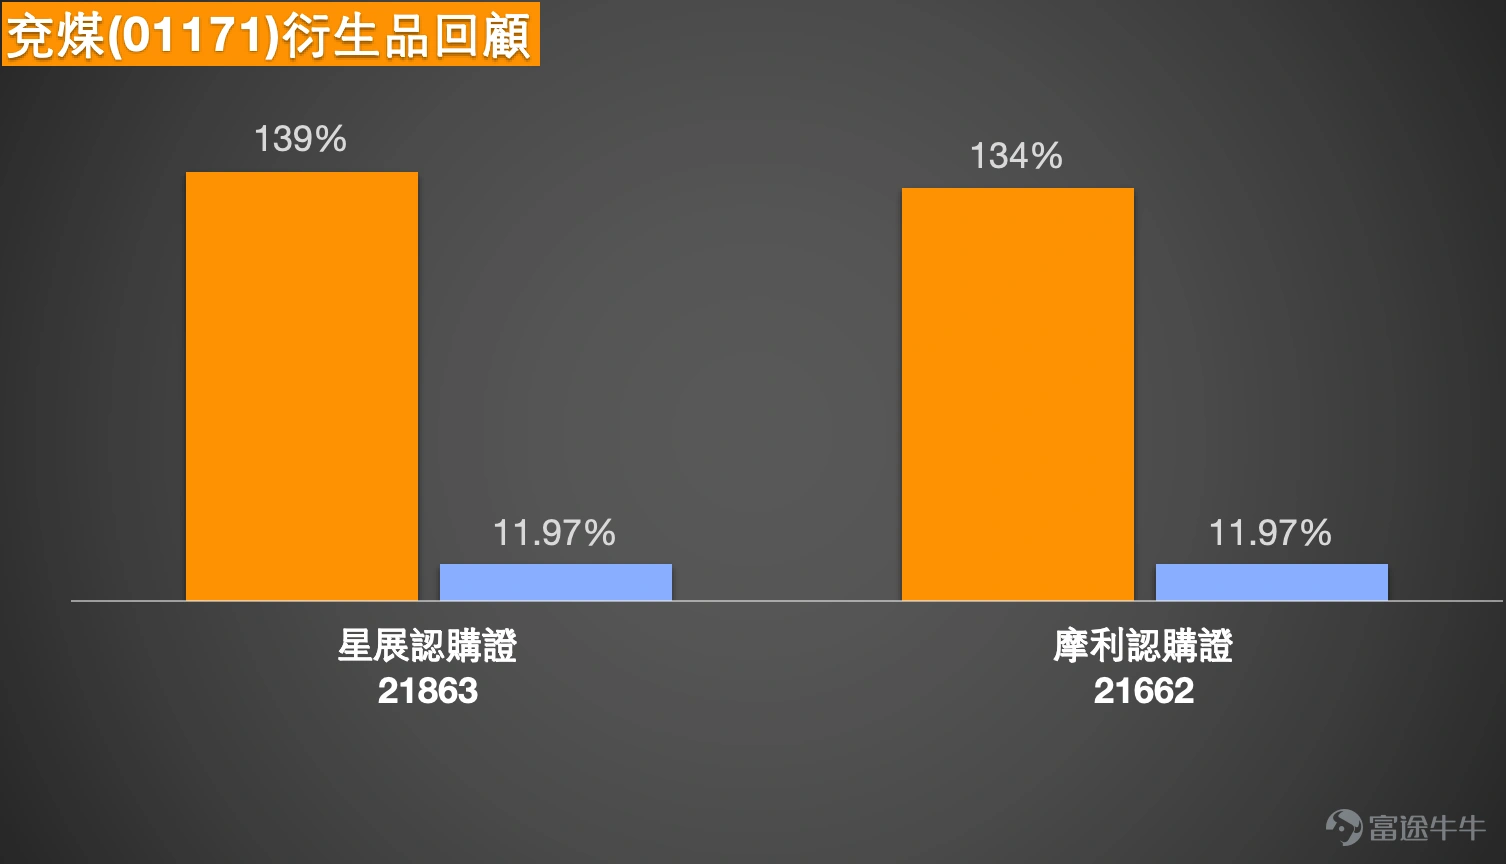
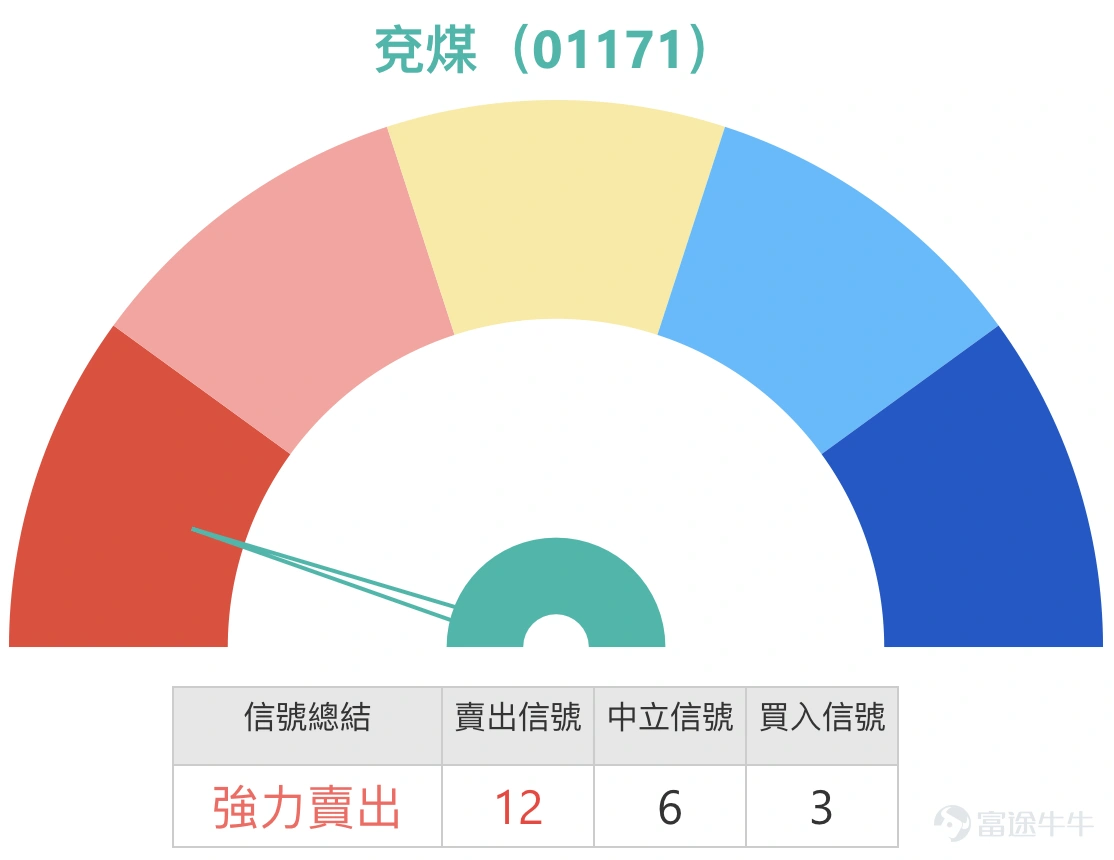
Simon: The last stock is Yankuang Energy (1171). $YANKUANG ENERGY (01171.HK)$ The stock price trend is quite good, whether it was yesterday or today (August 5), its performance stood out compared to the overall market conditions and other stocks. Yesterday, it reached a high of 12.45 yuan and closed at 12.34 yuan. Although it wasn't as strong as yesterday, it still broke through the top of the Bollinger Band and continued to trade above it. Some investors are optimistic about whether it can rise to 13 yuan or even 14 yuan. The current resistance level is at 12.8 yuan, and if it breaks through, there’s potential to reach 13.4 yuan. To rise to 13 yuan or higher, it first needs to break the 12.8 yuan resistance level. However, it should be noted that, according to the technical signal summary, it is temporarily in a 'Strong Sell' state, which I share with you for technical reference. $DSYKENR@EC2604A.C (21863.HK)$$MSYKENR@EC2604A.C (21662.HK)$
That concludes today's (August 5) sharing; thank you all for listening. If you have any questions about other stocks, or related inquiries about options, bull/bear contracts, etc., feel free to leave us a message. I will do my best to answer them later. See you again tomorrow, bye!
Disclaimer: This article does not constitute any investment advice.
This article is for reference only and does not constitute any investment advice. The market data, opinions, and analysis contained herein may change at any time without prior notice. We are not responsible for any loss or damage caused by reliance on the information in this article. Technical analysis only shows whether certain technical conditions are met; a comprehensive assessment of asset performance should be conducted using additional data. Decisions to trade should not be based solely on this article. Please note that past performance is not indicative of future results.
Risk Disclaimer: The above content only represents the author's view. It does not represent any position or investment advice of Futu. Futu makes no representation or warranty.Read more

Comments
to post a comment
6
9