
Market Sentiment Decoded: Analyzing Investors’ 'Bottom-Fishing Consensus' Through Bull-Bear Warrants
The recent movement of the index has been volatile. Dragged down by overnight declines in US stocks, Hong Kong stocks opened lower and fluctuated today (February 5), with the Hang Seng Index at 26,684 points, led by declines in technology and resource stocks. Although the index found some support at its intraday low, the market has entered a typical consolidation phase after touching a high of about 28,056 points at the end of January. Currently, bulls and bears are fiercely battling around key technical levels, with no clear direction yet. However, internal market data, especially the flow of funds in derivatives, is revealing traders' true emotions and expectations.
I. Technical Analysis: The Battle for Key Levels Amid Mixed Bullish and Bearish Signals
From a technical perspective, the Hang Seng Index is in a situation where the short-term trend is unclear but key levels are gradually becoming more defined. The index is currently constrained by the 10-day moving average at around 27,078 points, indicating that short-term upward momentum is hindered. However, the 50-day line at approximately 26,259 points also forms a mid-term trend defense line. This oscillation between short-term and medium-term moving averages reflects the market's indecision.
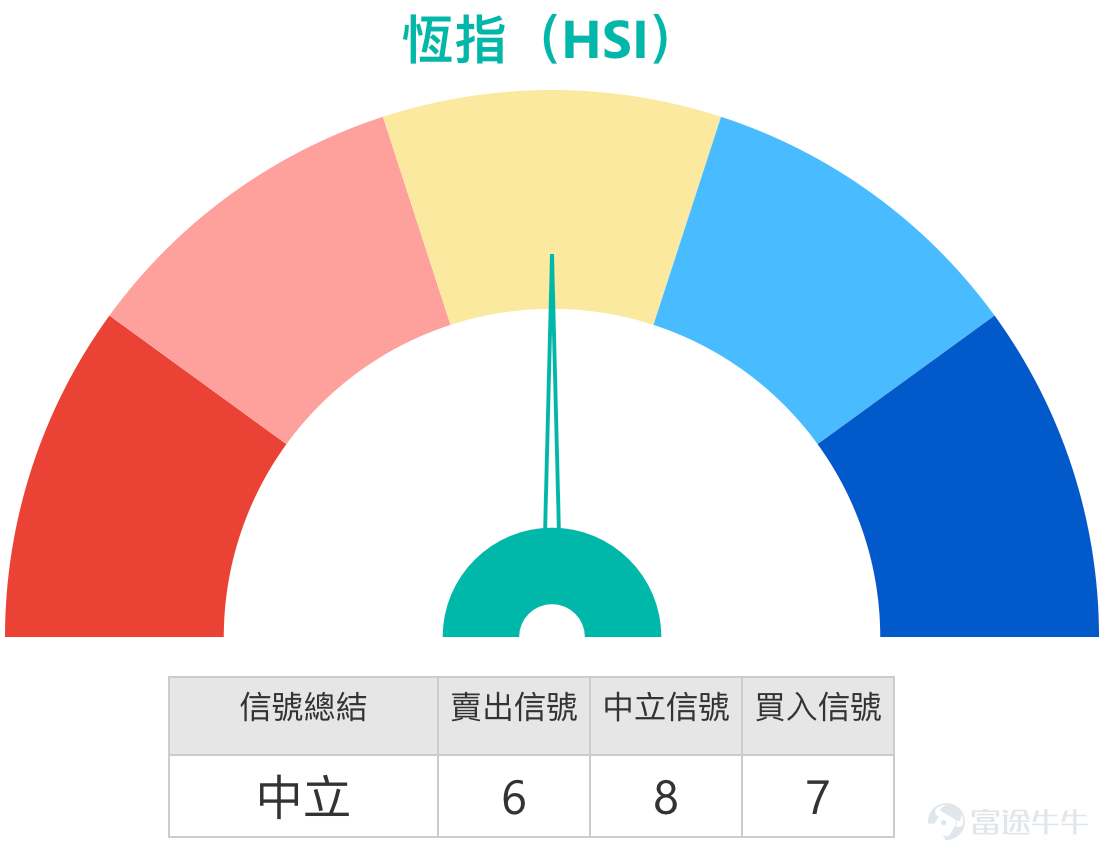
A closer observation of technical indicators reveals a state of contradictions and tug-of-war. On one hand, the MACD indicator, which represents mid-term trend momentum, is issuing a sell signal, showing that downward adjustment pressure persists; on the other hand, indicators such as Bollinger Bands are giving buy signals. The Relative Strength Index (RSI) hovers around 48, a neutral level, neither entering overbought nor oversold territory, suggesting that bullish and bearish forces are temporarily at a delicate balance. This “intertwined bull-bear” signal distribution means that either side needs greater momentum to make a breakthrough, also hinting that market volatility may continue.
Core Support and Resistance Analysis:
* Key Resistance Zone (27,266 - 27,677 points): The first major resistance above is near 27,266 points, which closely aligns with the 27,450-point resistance area mentioned in technical analysis (a recent Fibonacci retracement level). Stronger resistance lies in the 27,677 to 27,770-point region, close to the previous consolidation range, making it difficult to break through. For the index to reverse its short-term downward trend, a breakout with high trading volume in this zone is essential.
* Core Support Zone (26,020 - 25,458 points): The primary line of defense below is at 26,020 points, which not only acts as a psychological integer level but also serves as a focal point for recent market sentiment battles. The more critical second support lies between 25,458 and 25,679 points, deeply tied to the 50-day moving average support. This level is seen as a “litmus test” for assessing the depth of the market correction and the determination of bullish defenses.

Notably, from a technical perspective, the Hang Seng Index's volatility this month (February), with a difference of about 695 points between the high and low, has been far from sufficient to meet the standard volatility needs of a complete trading month. Therefore, larger fluctuations are expected to occur in the remaining trading days. Considering that the index has mostly oscillated tightly around the 27,000-point level, technically, the likelihood of the market testing higher levels appears relatively higher.
II. Market Sentiment and Expert Opinion Integration: Decoding Collective Wisdom from 'Street Positioning Charts'
To understand the current market, one must look beyond candlestick charts and delve into investors' real behaviors. In the February 3 episode of 'BOC Guest,' Niki, Director of BOC International, shared a 'Hang Seng Index Bull/Bear Warrant Street Position Distribution Chart,' providing an invaluable sentiment thermometer. Data showed that after the market fell to around 26,500 points, the proportion of street positions representing long positions (bull warrants) surged to approximately 76%, while short positions (bear warrants) accounted for only 24%. Niki explicitly pointed out: 'This 76% ratio is the highest level I've seen in the past six months.' This indicates that many investors are eager to buy at lower levels, anticipating a rebound, with the market generally viewing the 26,000-point area as having strong support.
However, while this consensus exists, it may also become a risk. When the majority of capital is concentrated in one direction, if the market fails to rebound as expected, these 'bottom-fishing forces' could turn into potential liquidation pressure. Niki also reminded investors that since the beginning of the year, due to international news and commodity price impacts, the broader market has frequently experienced gains or losses of around 800 points, significantly increasing volatility. Therefore, she advised adopting a more cautious strategy: 'Wait until the market clearly stabilizes before betting on a rebound... I suggest checking where the heavy concentration areas of relevant bull warrants are and whether they might fall near these zones, then consider rebound opportunities, which will yield a relatively higher success rate.'
The February 4 episode of 'HK Stock Podcast' echoed the above cautious stance. The program noted that the current market is highly volatile, making operations challenging. For short-term traders, clear technical support and resistance levels (e.g., narrow range of 26,200-27,500 points, wide range of 25,800-27,900 points) serve dual purposes: both as directional investment references and as bases for range trading. For example, when selecting bull warrants, avoid products with strike prices set at 26,200 points, instead considering those with strike prices further down at around 26,000 or even 25,800 points. Though leverage may slightly decrease, this offers a higher margin of safety and better resistance against market turbulence.
III. Warrant and Bull/Bear Deployment: Deeply Linking Terms with Key Price Levels
In the current highly volatile and directionally unclear Hang Seng Index conditions, warrants and bull/bear certificates provide investors with efficient trading tools. Their core advantage lies in allowing precise positioning on index short-term fluctuations with limited capital, enabling diverse strategies. The following product analysis will closely integrate the previously mentioned technical levels and market sentiment.
1. Bullish Strategy: Betting on Technical Rebound
If investors believe that the market has strong support at the 26,000-point level and expect the index to rebound towards the 27,266-point or even higher resistance levels, they can focus on the following products:
* BOC Bull Certificate (69532) $BI#HSI RC28089.C (69532.HK)$ : The product’s stop-loss level is set at 26,005 points, almost overlapping with the key first support level of 26,020 points. With an actual leverage of up to 48.1 times, it provides higher capital efficiency, suitable for investors with a strong risk tolerance who predict the index will rebound sharply from this position. However, it is important to remember that bull/bear certificates have a mandatory stop-loss mechanism; if the index falls below 26,005 points, the product will terminate trading.
* UBS Group Bull Certificate (69185) $UB#HSI RC2811E.C (69185.HK)$ : The terms are similar to the BOC Bull Certificate, with a stop-loss level at 26,000 points, making it another choice closely aligned with key support levels. Its actual leverage of 50.9 times is one of the highest among similar products.
* BOC Call Warrant (23128) $BI-HSI @EC2605B.C (23128.HK)$ / UBS Group Call Warrant (23091): For investors who do not wish to bear the mandatory stop-loss risk of bull/bear certificates, call warrants can be considered. Both products have an exercise price of 28,341 points, which is moderately out-of-the-money. Their relatively lower 'premium' characteristic reduces holding costs. They are suitable for betting that the index will break through the current consolidation range and embark on a trending upward movement.
2. Bearish or Hedging Strategy: Guarding Against Downside Risk
If investors believe the market will struggle to digest the dense resistance above in the short term, or are concerned about the 76% concentration of bull certificate street inventory forming a 'crowded long' risk, they may consider the following tools for bearish bets or hedging:
* BOC Bear Certificate (62750) $BI#HSI RP2803Y.P (62750.HK)$ : The core advantage of this product lies in its recovery price set at 27,275 points, just above the first resistance level at 27,266 points, offering the combination of 'highest actual leverage with lowest premium.' This makes it highly suitable for scenarios where the index is expected to rebound to the 27,200–27,450 point range before encountering resistance and retreating, providing a high-leverage tool for bearish views.
* UBS Put Warrant (23089) $UB-HSI @EP2605A.P (23089.HK)$ / BOC Put Warrant (23127) $BI-HSI @EP2605B.P (23127.HK)$ : Put warrants are ideal for expressing expectations that the market may continue to test the second support level at 25,458 points. BOC Put Warrant (23127) has an exercise price of 24,875 points, which offers 'relatively ideal leverage and implied volatility.' Meanwhile, UBS Put Warrant (23089) benefits from having a 'relatively lower premium.'


Interactive Q&A Session
Based on the current technical pattern of the Hang Seng Index, characterized by mixed bullish and bearish signals, along with market sentiment, we pose the following question and invite investors to share their insights:
Directional Poll: Within the trading range formed by the key support level (around 26,020 points) and resistance level (around 27,266 points), which direction do you believe the Hang Seng Index is more likely to break out in the short term?
A. Break upward through resistance, challenging higher levels.
B. Fall below support, extending the correction trend.
C. Continues to consolidate with fluctuations within the current range.
Friendly reminder: The above analysis is for reference only and does not constitute any investment advice. Warrants and bull/bear certificates are high-risk derivatives, and their prices can go up or down, potentially leading to a total loss of investment. Before investing, be sure to carefully read the relevant listing documents, assess your own risk tolerance, and make independent judgments.
#Hang Seng Index #Technical Analysis #Support and Resistance Levels #Bull and Bear Certificates #Warrants #Hong Kong Stock Deployment #Implied Volatility #Street Stock Analysis #Bank of China Guest #Hong Kong Stock Podcast$Hang Seng China Enterprises Index (800100.HK)$$Hang Seng TECH Index (800700.HK)$
Risk Disclaimer: The above content only represents the author's view. It does not represent any position or investment advice of Futu. Futu makes no representation or warranty.Read more
Comments
to post a comment
9