

[Warrant Perspective] Oversold tech stocks, stable financial stocks, and the Hang Seng Index mainly moving within a range
February 4th,$Hang Seng Index (800000.HK)$
The day closed at 26,847.32 points, up slightly by 0.05% in a day, with a turnover of 285.433 billion yuan. The 5-day volatility was 6.1%, showing a narrow-range consolidation pattern, with both bulls and bears temporarily in balance.
Looking at specific technical indicators, the breakdown is as follows: The latest price of the Hang Seng Index is 26,847.32 points, below the MA10 (27,091.17 points) but above the MA30 (26,584.16 points) and MA60 (26,261.04 points), indicating short-term weakness but medium-term support. In the short term, it is necessary to watch whether it can stabilize above the MA10.

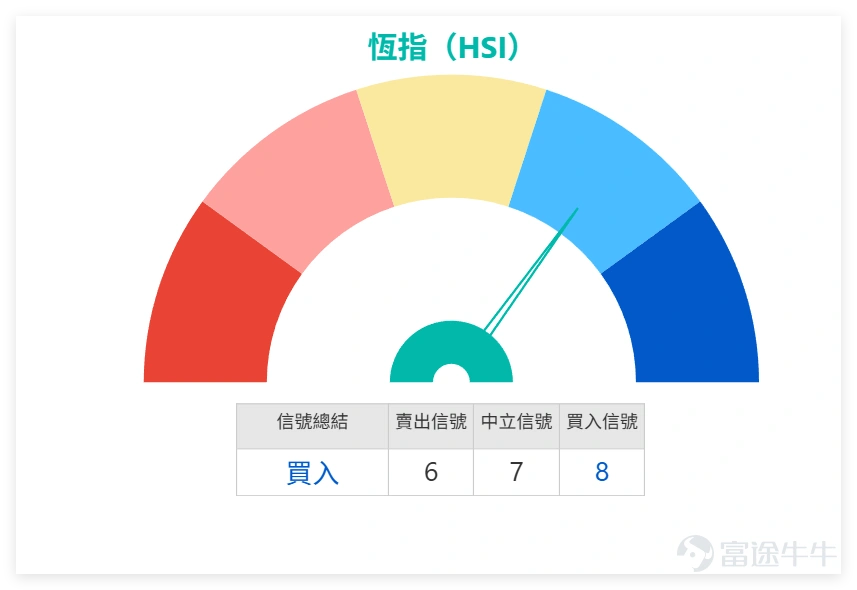
The RSI is at 51, in a completely neutral zone with no overbought or oversold signals; the MACD signal is buy, CCI indicator shows a buy signal, but Williams %R and Stochastic Oscillator are neutral, ADX indicator is neutral, with minor divergence among multiple indicators.
Technical indicators summary is 'Buy,' signal strength 8. Overall, although the short-term Hang Seng Index is suppressed by MA10, mid-term moving averages provide support. Multiple indicators lean towards buying, and in the short term, it will likely remain in consolidation, awaiting clearer direction.
Support below is divided into two levels: first support at 26,208 points, second support at 25,802 points; resistance above is also divided into two levels: first resistance at 27,524 points, second resistance at 27,893 points, with a clear short-term trading range.
A concise summary of key blue-chip stock movements and technical highlights on February 4th, focusing on closing prices, daily changes, and key technical signals for quick understanding:
1、 $TENCENT (00700.HK)$ : Closed at 558.00 yuan, down 3.96%, stock price below MA10/MA30, RSI 28 oversold, technical signal 'Buy' (strength 10)
2、 $BABA-W (09988.HK)$ : Closed at 159.50 yuan, down 0.93%, stock price near MA30, below MA10, RSI 49 neutral, technical signal 'Neutral' (strength 10)
3、 $MEITUAN-W (03690.HK)$ : Closed at 92.15 yuan, down 1.13%, stock price below all major moving averages, RSI 29 oversold, technical signal 'Buy' (strength 10)
4、 $CCB (00939.HK)$ : Closed at 7.88 yuan, up 0.90%, stock price slightly above MA10/MA30, RSI 55 neutral-leaning-strong, technical signal 'Buy' (strength 8)
5、 $HSBC HOLDINGS (00005.HK)$ : Closed at 139.00 yuan, up 0.07%, stock price above all major moving averages, RSI 71 nearing overbought, technical signal 'Strong Sell' (strength 10)
6、 $AIA (01299.HK)$ : Closed at 90.70 yuan, up 1.40%, stock price above all major moving averages, RSI 68 nearing overbought, technical signal 'Buy' (strength 7)
7、 $HKEX (00388.HK)$ Closed at 420.20 yuan, down 0.43%, stock price near MA30, below MA10, RSI 46 neutral, technical signal 'Neutral' (strength 10)
8、 $PING AN (02318.HK)$ Closed at 72.05 yuan, up 1.05%, stock price above MA10/MA30, RSI 63 slightly bullish, technical signal 'Strong Sell' (strength 8)
9、 $ICBC (01398.HK)$ Closed at 6.43 yuan, up 0.78%, stock price above MA10/MA30, RSI 57 moderately strong, technical signal 'Buy' (strength 8)
10、 $BYD COMPANY (01211.HK)$ Closed at 90.00 yuan, unchanged, stock price below MA10, near MA30, RSI 33 oversold, technical signal 'Strong Buy' (strength 12)
Overall, the performance of key blue-chip stocks in Hong Kong's market on February 4th was significantly divergent. Tech stocks (Tencent, Alibaba, Meituan) generally closed lower, showing oversold signs with some indicators hinting at potential rebound opportunities; financial stocks (China Construction Bank, ICBC, AIA) rose slightly, but HSBC and Ping An's technical indicators showed overbought conditions, facing downward pressure. The overall market sentiment was cautious, with investors adjusting positions based on individual stock technical signals without clustering operations. In this divergent pattern, focus should be placed on individual stock technical analysis for strategic positioning.
Review and Selection of Warrants and Bull/Bear Products:
(1) Review of previous warrant and bull/bear products
Reviewing the Hang Seng Index-related warrants and bull/bear products recommended on January 29th, their performance after two days was impressive, with specific data as follows:
1、 $JP-HSI @EP2605B.P (22980.HK)$ : Increased by 57% after two days, corresponding to a 4.26% drop in the Hang Seng Index after two days, perfectly aligned with market trends;
2. UBS Group bear contract ( $UB#HSI RP2802T.P (59433.HK)$ 、 $UB#HSI RP27102.P (58879.HK)$ ): Both products increased by 109% after two days, achieving higher returns following the decline of the Hang Seng Index;
3、 $BP-HSI @EP2603A.P (21062.HK)$ : Increased by 92% after two days, also benefiting from the short-term adjustment of the Hang Seng Index.

Friendly reminder:Warrants and callable bull/bear contracts have leverage characteristics, where returns and risks coexist. Past performance does not indicate future trends. Investors should rationally participate based on their risk tolerance and strictly control position sizes.
(2) Today's selected warrant products:
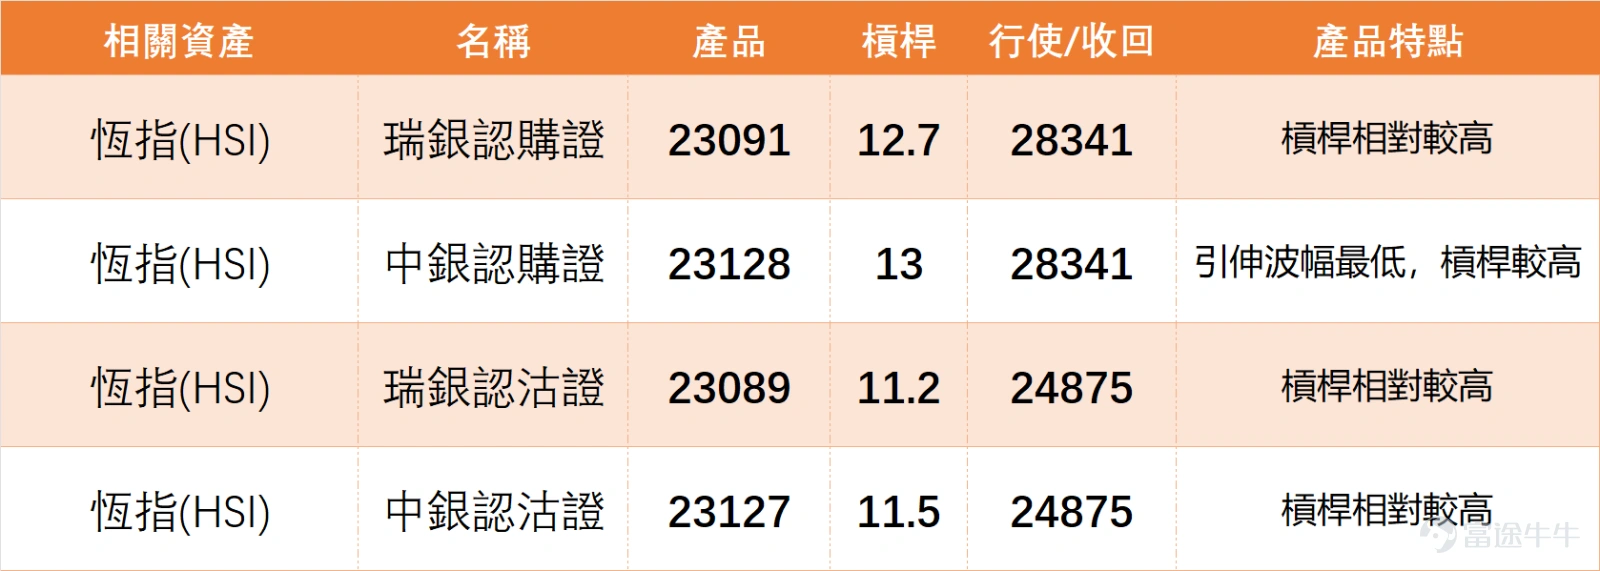
Based on the Hang Seng Index’s technical trend (neutral-bullish, consolidation), two high-quality warrant products are selected with a focus on reasonable leverage and premium levels for investors' reference:
1、 $BI-HSI @EC2605B.C (23128.HK)$Leverage of 13x, strike price at 28,341 points, lowest implied volatility, with leverage at a reasonable level; suitable for investors optimistic about a short-term breakout above resistance levels in the Hang Seng Index.
2、 $BI#HSI RC28087.C (64010.HK)$Leverage of 24.6x, recovery price at 25,854 points, relatively lower premium, corresponding to the support level below the Hang Seng Index, offering strong risk controllability. Suitable for investors favoring low-premium products.

Risk Warning:All warrant products require attention to real-time market trends, as exercise prices, recovery prices, and leverage fluctuate with the underlying stock. Investors need to monitor product data in real time and make rational decisions.
What do you prioritize when choosing warrants? A. Low premium. B. High leverage. C. Implied volatility.
Come to the comment section and share your thoughts! Want to see more analysis? Remember to follow 'HK Stock Warrants Jenny' for daily updates!
Disclaimer: This article does not constitute any investment advice.
This article is for reference only and does not constitute any investment advice. The market data, opinions, and analysis contained herein may change at any time without prior notice. We are not responsible for any loss or damage caused by reliance on the information in this article. Technical analysis only shows whether certain technical conditions are met; a comprehensive assessment of asset performance should be conducted using additional data. Decisions to trade should not be based solely on this article. Please note that past performance is not indicative of future results.
#HongKongStocks #RealTimeAnalysis #WarrantsSelection #WarrantsStrategy #DerivativesHedging #HongKongWarrantsJenny #HangSengIndex #BlueChipStocks #TechnicalAnalysis #HongKongTechnicalBreakdown
Risk Disclaimer: The above content only represents the author's view. It does not represent any position or investment advice of Futu. Futu makes no representation or warranty.Read more
Comment (1)
to post a comment