

February 4th [Hong Kong Stock Podcast] Hang Seng Index, Tencent, Xiaomi Group, Li Auto, China Resources Beer, Li Ning
1. Hang Seng Index $Hang Seng Index (800000.HK)$: Investors who are optimistic about the future market expect the index to rebound to 27,000 points and thus hold bullish certificates with a stop-loss level at 26,250 points. On the other hand, investors who are bearish believe that the index may drop to 26,500 points and therefore hold bearish certificates with a stop-loss level at 28,000 points.
Simon: First, looking at the Hang Seng Index, there has been significant volatility over the past two days with substantial declines, likely causing concern among many investors. Although the index touched a high of 28,000 points, it has now retreated to near the middle line of the Bollinger Bands, which is within normal or controllable range. However, such large daily fluctuations increase the difficulty for short-term traders. If the market moves in a single direction, whether up or down, it would be easier to manage; but with current heightened volatility, incorrect predictions or choosing products too close to the market price could easily lead to forced liquidation. We provide support and resistance levels for various indices, individual stocks, and related markets daily, helping investors avoid stop-loss levels when selecting products and facilitating range trading in volatile markets—i.e., buying bullish products at lows and bearish products at highs. Therefore, support and resistance levels can be used bidirectionally: as references for directional investment and as bases for intraday range trading, thereby reducing the risk of product liquidation.
Regarding today’s (February 4th) market conditions, the Hang Seng Index closed at 26,847 points, slightly below the middle line of the Bollinger Bands, but overall showed some recovery compared to the previous day. In terms of trading volume, it was lower than during the recent two days of decline, but still remained at relatively high levels compared to December last year.
Currently, some investors remain optimistic about the future market, believing that the index could rebound to 27,000 points, only about 160 points away. On the other hand, those with a bearish view anticipate a further drop of 300 points to 26,500 points, with market attention focused on these key levels. In short, the expected range in the short term is between 26,500 and 27,000 points.
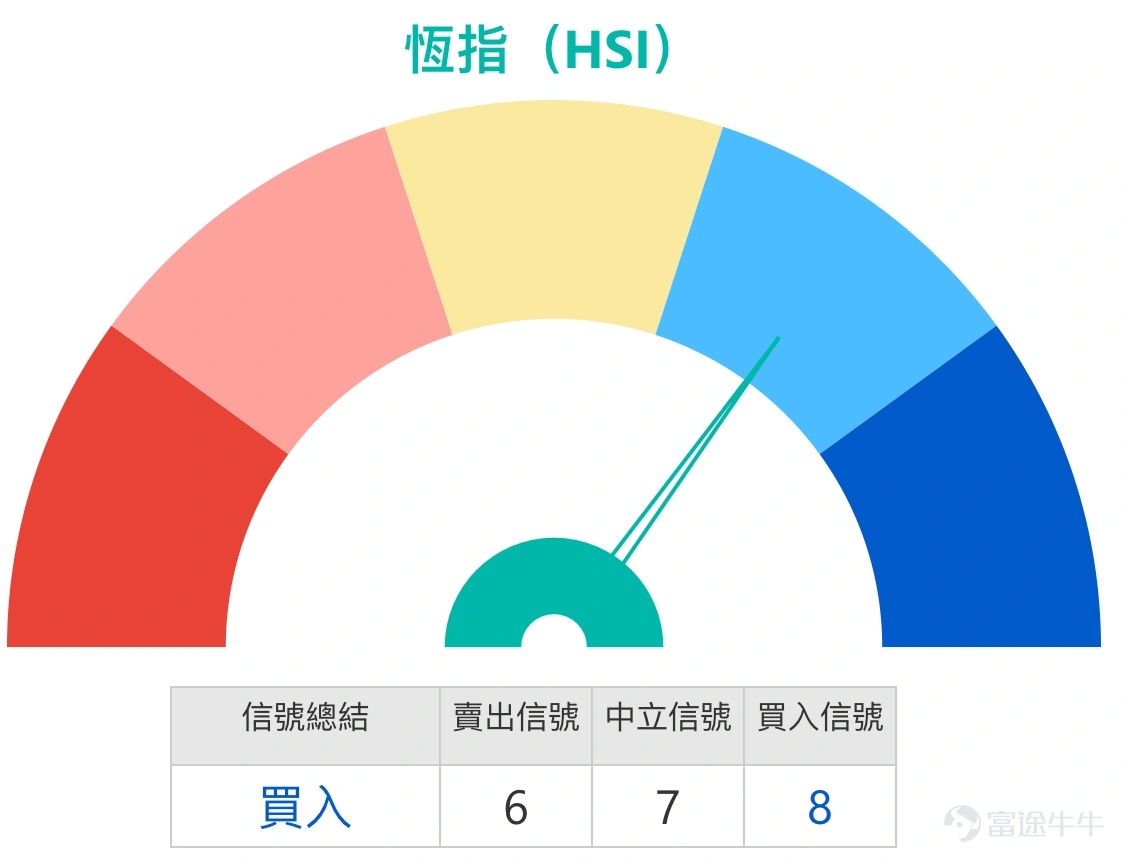
If we refer to technical levels, the narrow range is between 26,200 and 27,500 points, while the wider range is between 25,800 and 27,900 points. How to utilize this? Some investors mention that given there are two support levels at 26,200 and 25,800 points, they would typically choose an intermediate level around 26,000, closer to 25,800. The rationale is that if the price falls below 26,200, it might not necessarily break further below 25,800. Therefore, when selecting bullish warrants (bulls), one can avoid products with a forced call price at 26,200, while maintaining leverage by considering products with a forced call price near 26,000. Currently, in the market, bulls with a forced call price around 25,800 offer leverage of up to 24 to 25 times, with little difference compared to more closely priced products but with a higher margin of safety. In other words, choosing products with slightly lower forced call prices and less risk does not significantly reduce leverage but enhances protection. At present, the leverage difference between bullish and bearish warrants is limited, so investors are advised to focus slightly more on risk control to avoid being forced out due to market volatility. Especially in a high-volatility environment, products too close to the current price carry higher risks, making slightly more conservative options more suitable. Additionally, from a technical signal perspective, the Hang Seng Index shows a predominant "sell" signal in the short term.$BP-HSI @EP2603A.P (21062.HK)$$UB#HSI RP27102.P (58879.HK)$$UB#HSI RP2802T.P (59433.HK)$$JP-HSI @EP2605B.P (22980.HK)$

2. Tencent (00700.HK) $TENCENT (00700.HK)$Some investors noted that many Tencent bulls have been recently forced out, asking whether there is support below. Another investor holds a bull with a forced call price at HKD 539.
Simon: First, analyzing Tencent (0700), the stock's performance over the past two days has been quite volatile. It previously showed a downward trend, which intensified recently, breaking below the lower Bollinger Band on both daily and weekly charts. With the closing price at HKD 558, it indeed broke through the technical support mentioned above, a situation unseen for some time. Regarding trading volume, it increased for two consecutive days compared to earlier periods, which may attract some investors' attention as a potential investment opportunity.
Investors noted that many bulls were recently forced out, reminding us again that whether investing in the Hang Seng Index or individual stock bulls/bears, managing the risk of forced call prices is crucial. Taking Tencent as an example, when the share price undergoes significant adjustment, it easily hits the product’s forced call price. Thus, selecting products with a forced call price further away increases the safety factor, reducing the risk of being called even amidst volatile price movements. Moreover, if the forced call price is too close to the market price, even without being called, the risk continues to rise, potentially leading to reduced market demand, a point requiring special attention.
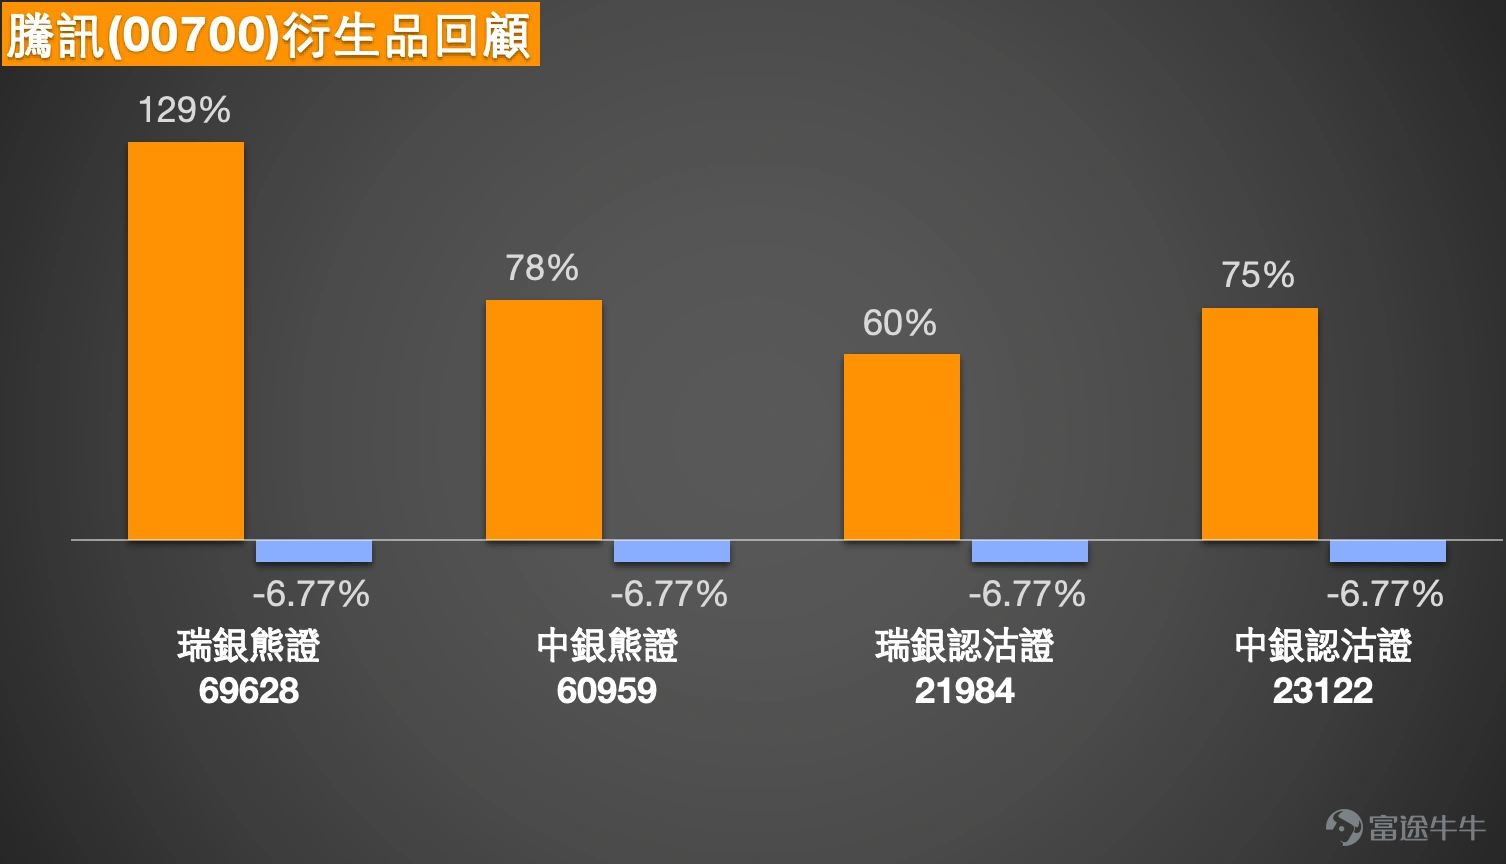
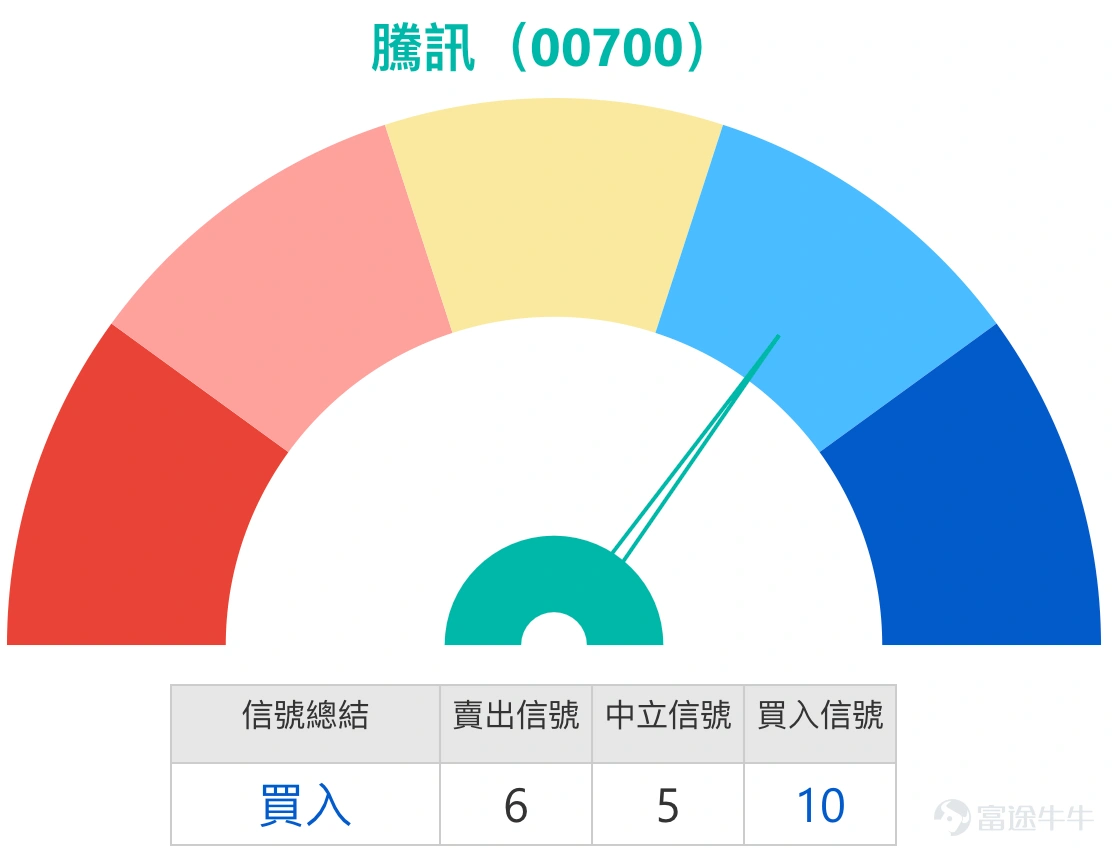
Some investors asked where the support level would be if the stock price continues to fall. The initial support is currently at HKD 548, and if broken, it may test HKD 521. These levels have not yet reached the middle line of the monthly Bollinger Band (around HKD 501), making it difficult to predict if the price will drop to that level—this is for chart analysis reference only. From a technical signal standpoint, Tencent currently shows more "buy" signals (10 buy signals, 6 sell signals).$UB#TENCTRP2812H.P (69628.HK)$$BI#TENCTRP2812A.P (60959.HK)$$UBTENCT@EP2606A.P (21984.HK)$$BITENCT@EP2606A.P (23122.HK)$
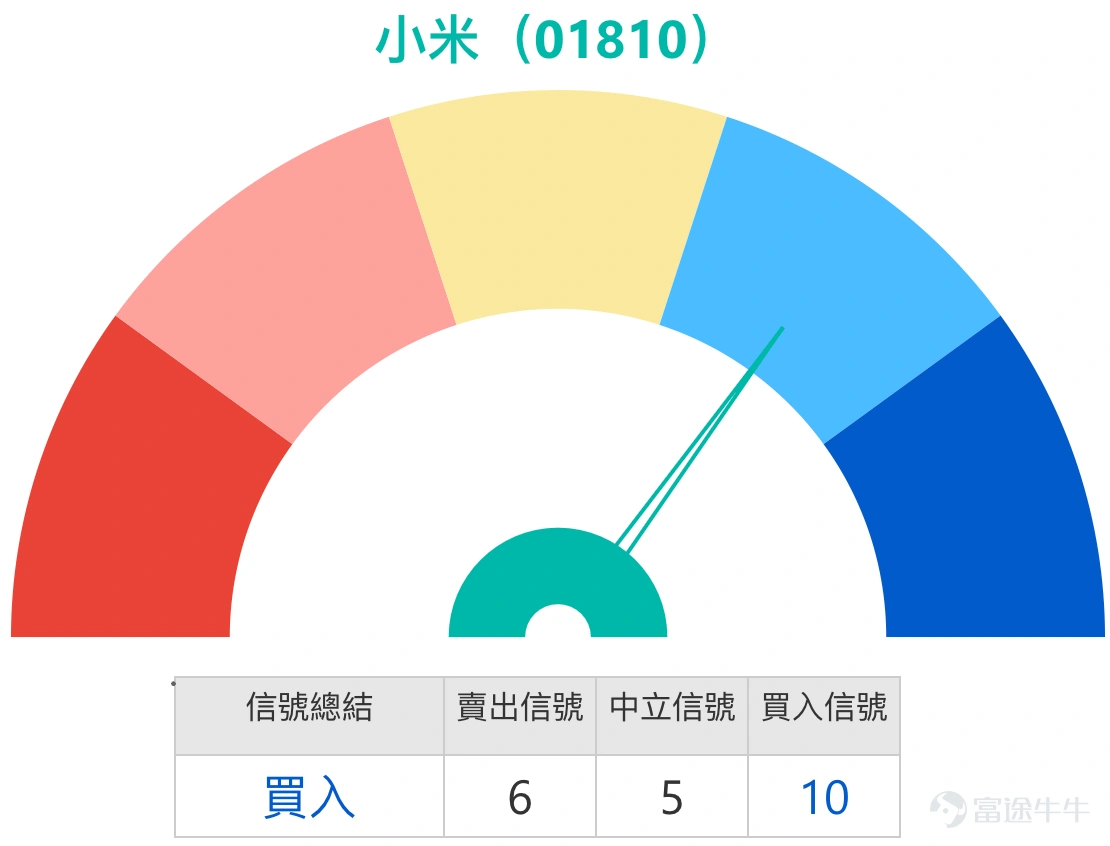
3. Xiaomi Group-W (01810.HK) $XIAOMI-W (01810.HK)$The stock’s performance remains weak, with investors concerned whether it might fall below HKD 30 before the Chinese New Year. Another investor is bearish down to HKD 20 and holds put options.
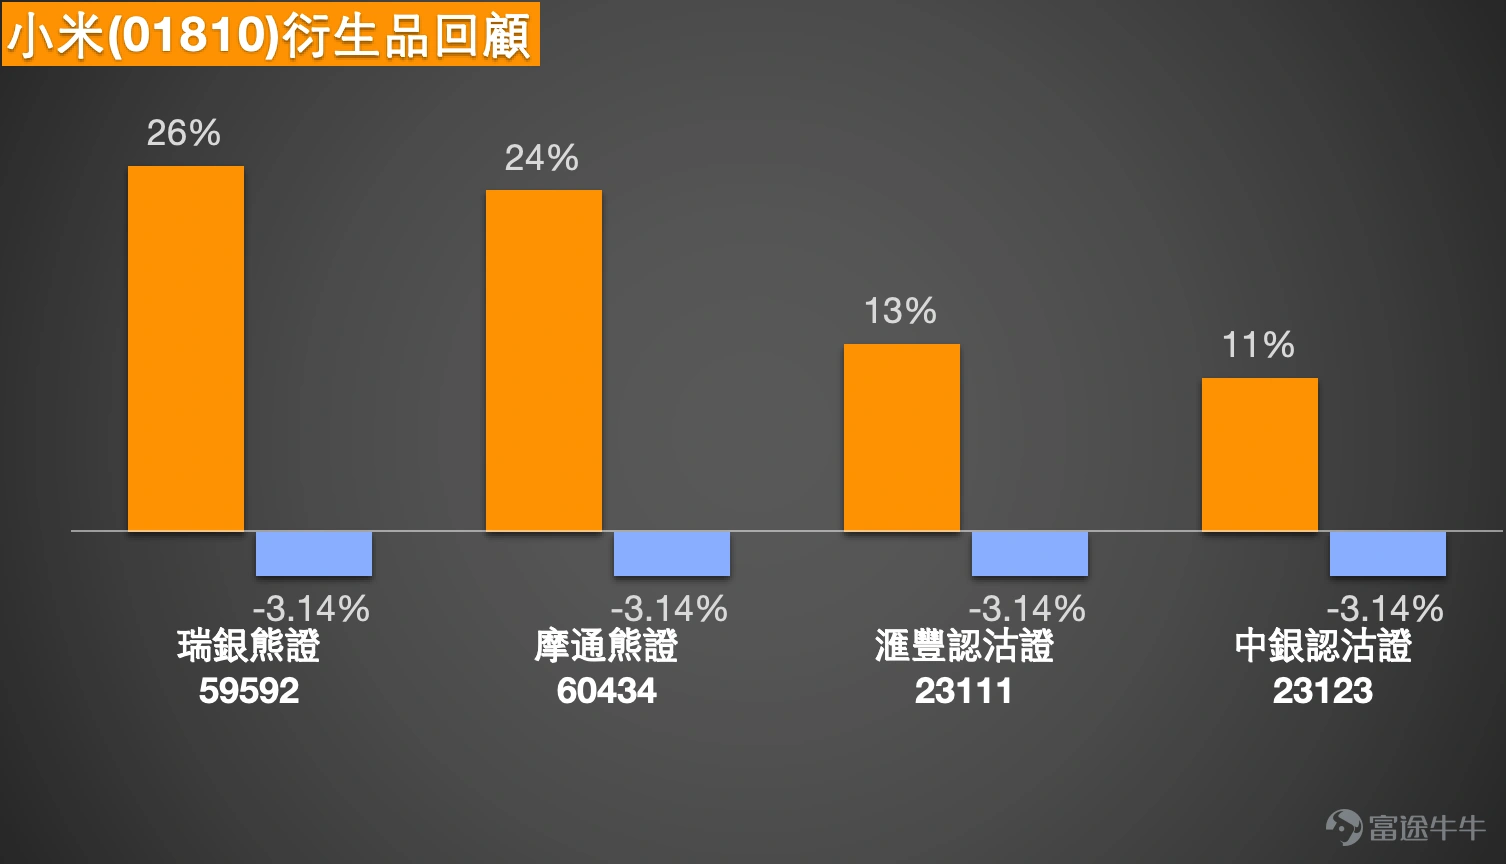
Simon: Next, analyzing Xiaomi (1810), the stock’s recent performance has disappointed investors, with its price continuously declining and showing a pattern of lower lows. Today (the 4th), despite the price drop, trading volume increased, which may not be a positive sign, reflecting weakened investor confidence. Some investors asked whether it might break below HKD 33 or even go lower. Gradually observing, Xiaomi's current support level is around HKD 33, and if it breaks below, it may test HKD 31.3.
It is reasonable for investors to hold put options. From the trend perspective, Xiaomi is not experiencing a sharp decline like Tencent; instead, it is slowly trending down along the lower band of the Bollinger Bands. This type of gradual decline is more challenging to manage, and holders are troubled whether to continue holding or stop losses. Therefore, some investors choose put options to hedge risks or generate returns. If they do not hold the underlying stock, put options can offer profit opportunities; however, if they hold the underlying stock, they must endure the pressure of a gradually declining share price, which is also a common challenge in the market.
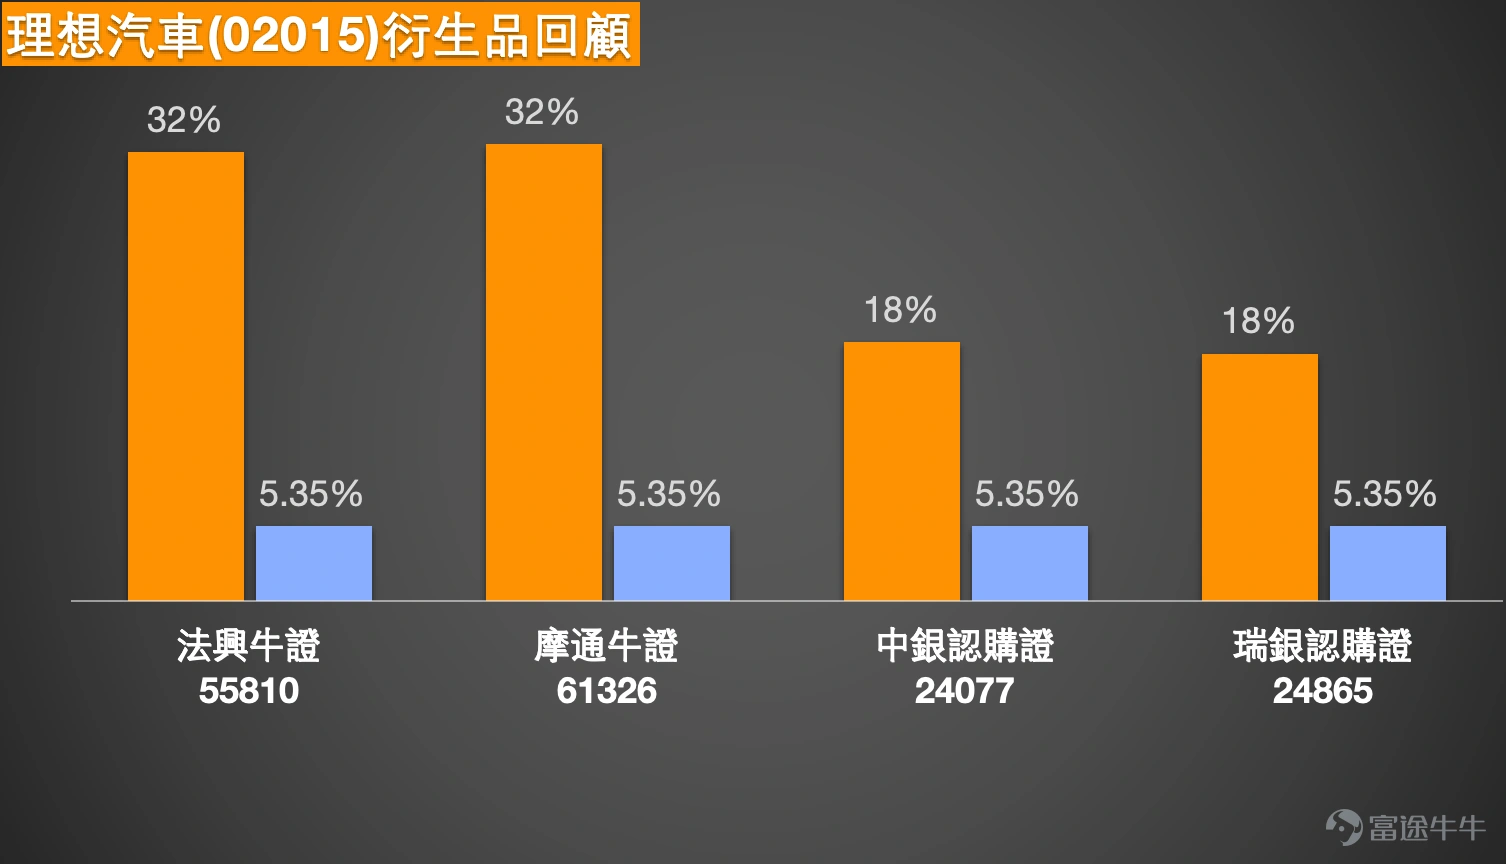
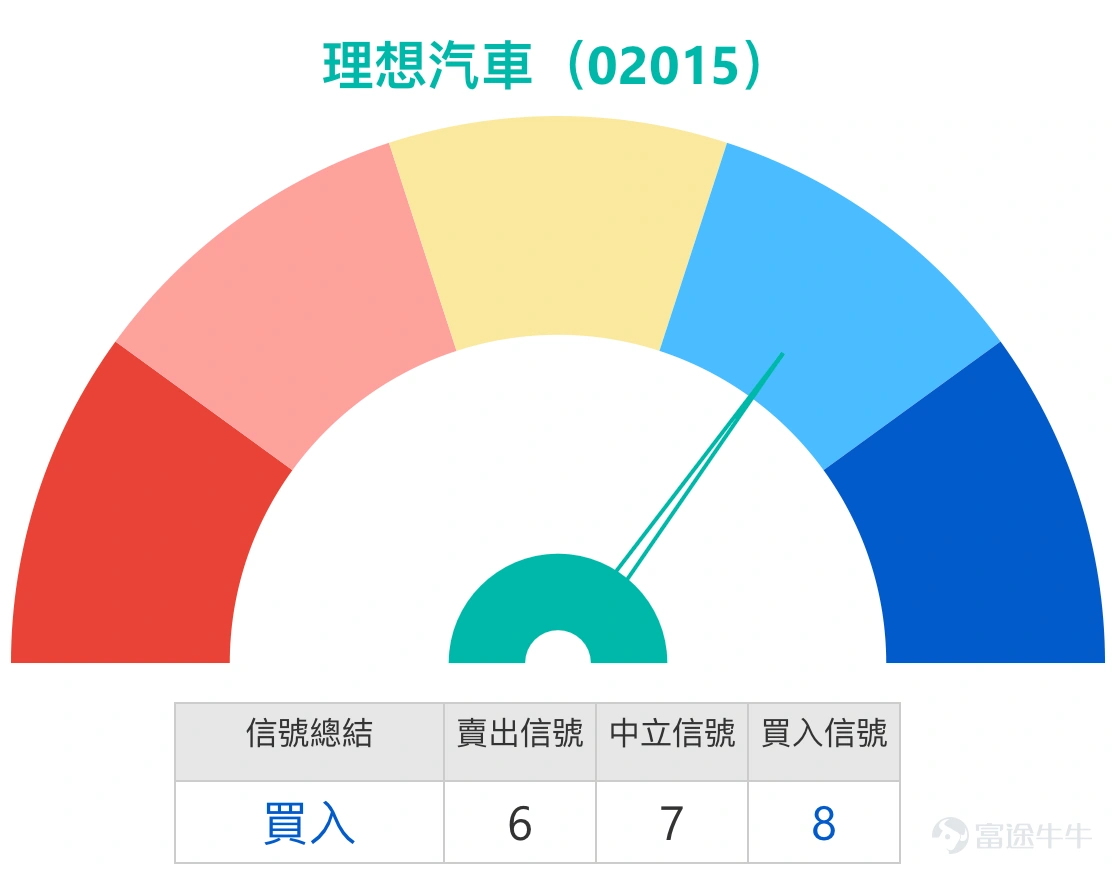
4. Li Auto-W (02015.HK) $LI AUTO-W (02015.HK)$: The trend appears to be upward, and investors are watching whether it can first rebound to $70.
Simon: Turning to Li Auto (2015), the stock price rebounded today (4th), breaking above the upper band of the Bollinger Bands on the daily chart during trading, bringing some positive signals to the market. Today's rise was accompanied by increased trading volume, prompting investor inquiries about whether this indicates a recovery and whether it can return to $70. Current technical signals primarily suggest a 'buy,' with slightly more bullish indications. If the uptrend continues, the resistance level lies above $70, with the first target at $72.1, and a potential test of $73.9 upon a breakout.$SG#LIAUTRC2609B.C (55810.HK)$$JP#LIAUTRC2608A.C (61326.HK)$$BILIAUT@EC2609A.C (24077.HK)$$UBLIAUT@EC2609A.C (24865.HK)$
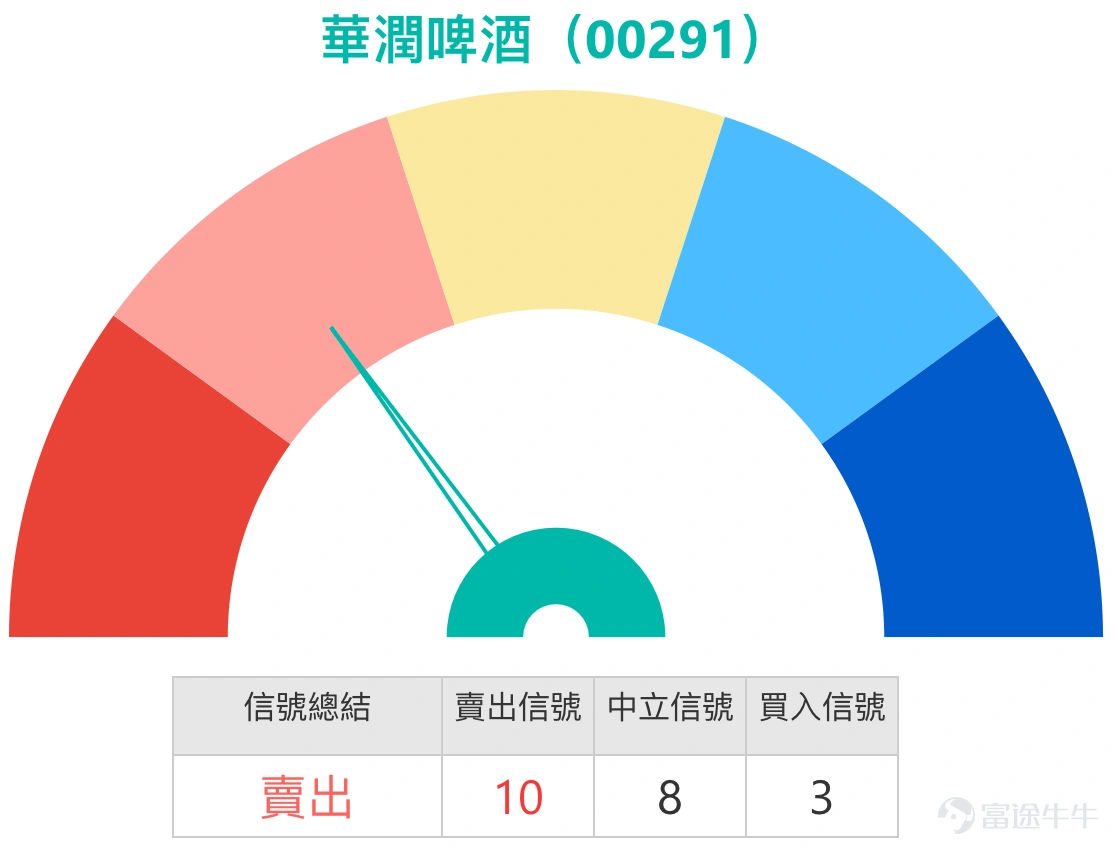
5. China Resources Beer (00291.HK) $CHINA RES BEER (00291.HK)$: The stock price has been rising for several consecutive days, leading investors to believe it may first test $30, and next month challenge $40. Some investors hold call warrants with an exercise price of $34.88.
Simon: Looking again at China Resources Beer (0291), the stock performed relatively well recently, briefly surpassing the upper band of the Bollinger Bands during trading today (4th). It closed at $27.16, just above the upper band, showing a relatively stable trend. Some investors remain optimistic, expecting a chance to rebound to $30, but consolidation might be needed in the short term. The current resistance level is at $28.1, and a potential move to $28.9 could follow a breakout. Reaching $30 will require more time and patience.
For investors holding the underlying stock, patience is advised. Others are paying attention to related call warrants, but there are few suitable options for China Resources Beer recently, as many out-of-the-money levels exceed 10%. Note that if the out-of-the-money degree is high, such products may experience significant declines when the stock undergoes technical adjustments. Given limited product choices, investors are advised to wait and observe until more suitable terms emerge before participating, to improve their chances of success. Investments in the underlying stock can still be patient, but the margin for error with options like warrants or bull/bear contracts is smaller, so caution is essential.
6. Li Ning (02331.HK) $LI NING (02331.HK)$: The stock price has shown strength against the market trend, with investors noting signs of an upward breakout on the monthly chart, inquiring whether it has the potential to challenge $30.
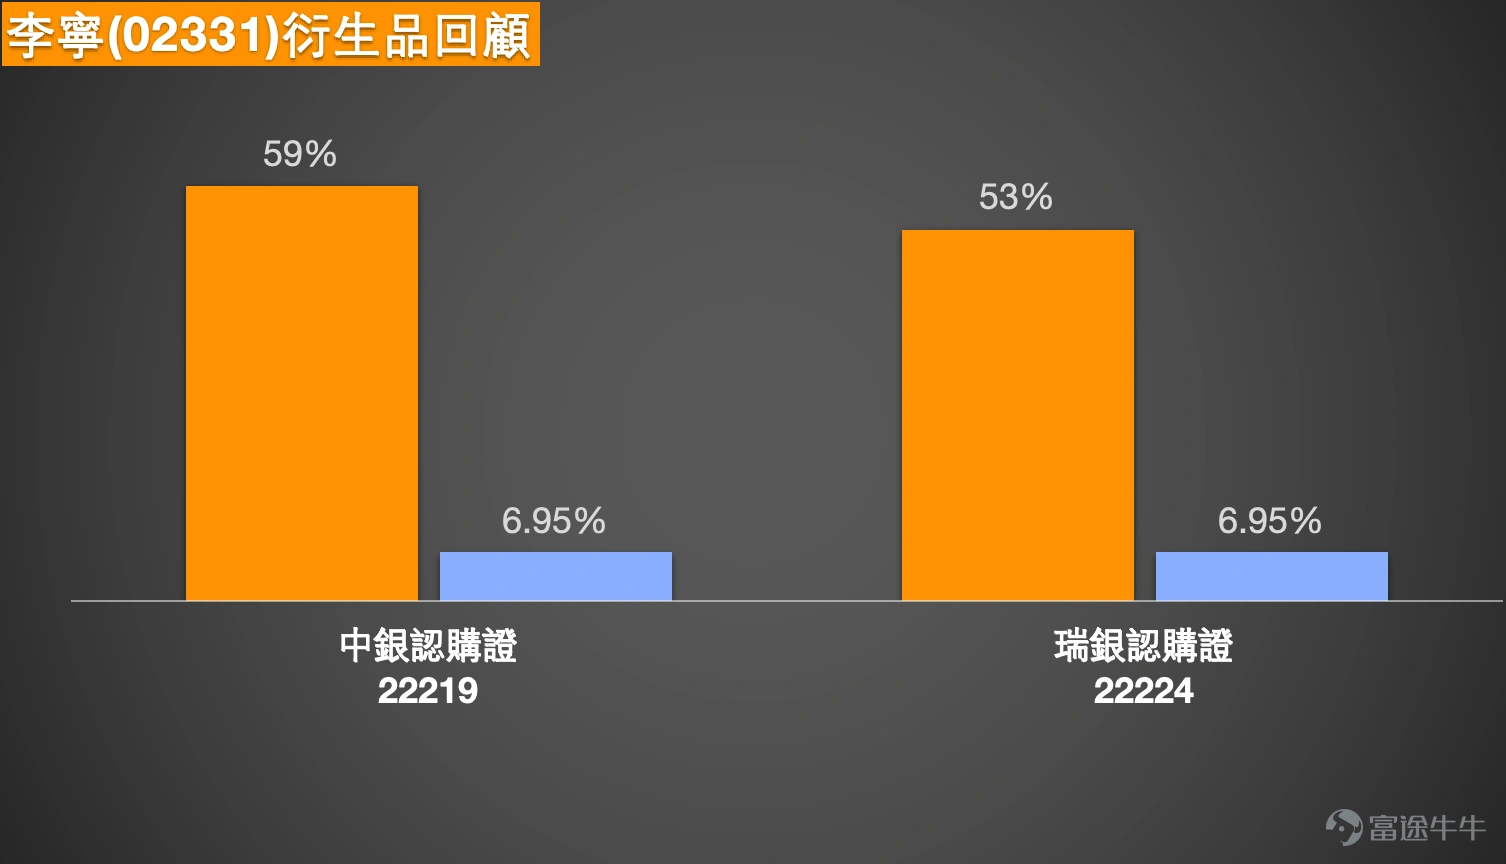
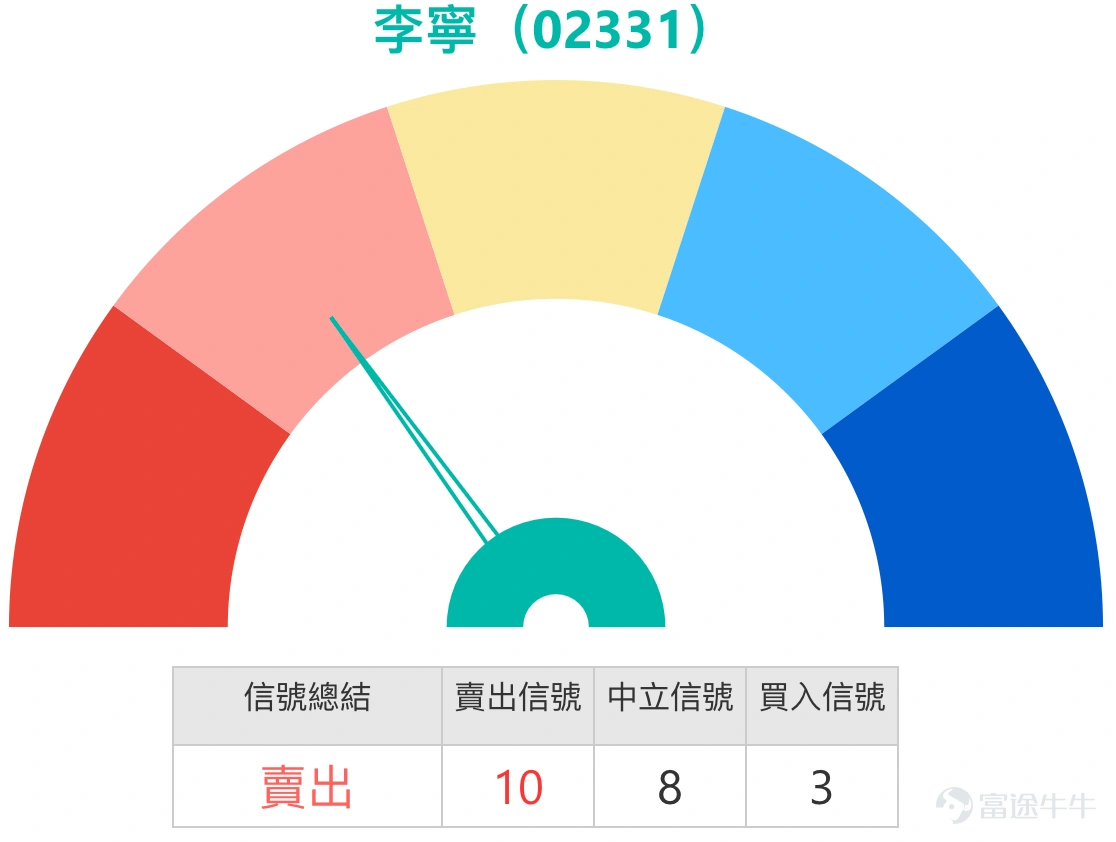
Simon: Finally analyzing Li Ning (2331), today's (4th) share price continued to rise, closing at HK$20.92, but trading volume fell for two consecutive days. The divergence between price and volume is worth noting. Investors asked if it could challenge HK$30. Gradually speaking, the short-term resistance level is around HK$21.5, and after breaking through that, it may test HK$22.5. Reaching HK$30 will take longer and might not be achievable in the short term. It is recommended to observe the performance near HK$21.5 and HK$22.5 step by step. Currently, Li Ning’s short-term technical signals are mainly indicating 'sell', for your reference.$BILININ@EC2605B.C (22219.HK)$$UBLININ@EC2605B.C (22224.HK)$
Today’s (4th) sharing will temporarily end here, thank you all for listening. If you have any other questions about individual stocks, feel free to leave a comment. See you again tomorrow at the same time. Goodbye!
Friendly reminder: This article does not constitute any investment advice.
This article is for reference only and does not constitute any investment advice. The market data, opinions, and analysis contained herein may change at any time without prior notice. We are not responsible for any loss or damage caused by reliance on the information in this article. Technical analysis only shows whether certain technical conditions are met; a comprehensive assessment of asset performance should be conducted using additional data. Decisions to trade should not be based solely on this article. Please note that past performance is not indicative of future results.
Risk Disclaimer: The above content only represents the author's view. It does not represent any position or investment advice of Futu. Futu makes no representation or warranty.Read more

Comments
to post a comment
1
10