
In-depth Analysis: 'BOC Guest' Examines Heavyweight Hang Seng Index Bull Contracts, Technical Analysis Defines Key Support and Resistance Levels
The recent performance of the Hang Seng Index (HSI) has been volatile. Just yesterday, Hong Kong stocks opened lower due to overnight declines in U.S. equities, with the Hang Seng Index (HSI) initially trading lower. Technology stocks were the main drag, causing the Hang Seng Tech Index to drop more than 2.2% during intraday trading. However, the market quickly found support at the lows, and as of the close on February 4th, the HSI settled at 26,724.5 points. Although it still fell slightly by 0.41% for the day, there was some recovery from the intraday lows. The index is currently hovering between several key technical levels, leaving the market direction unclear. Internal market data reveals the real tug-of-war and sentiment temperature between bulls and bears.
Technical Analysis: Battle Over Key Levels Amid Mid-Term Consolidation
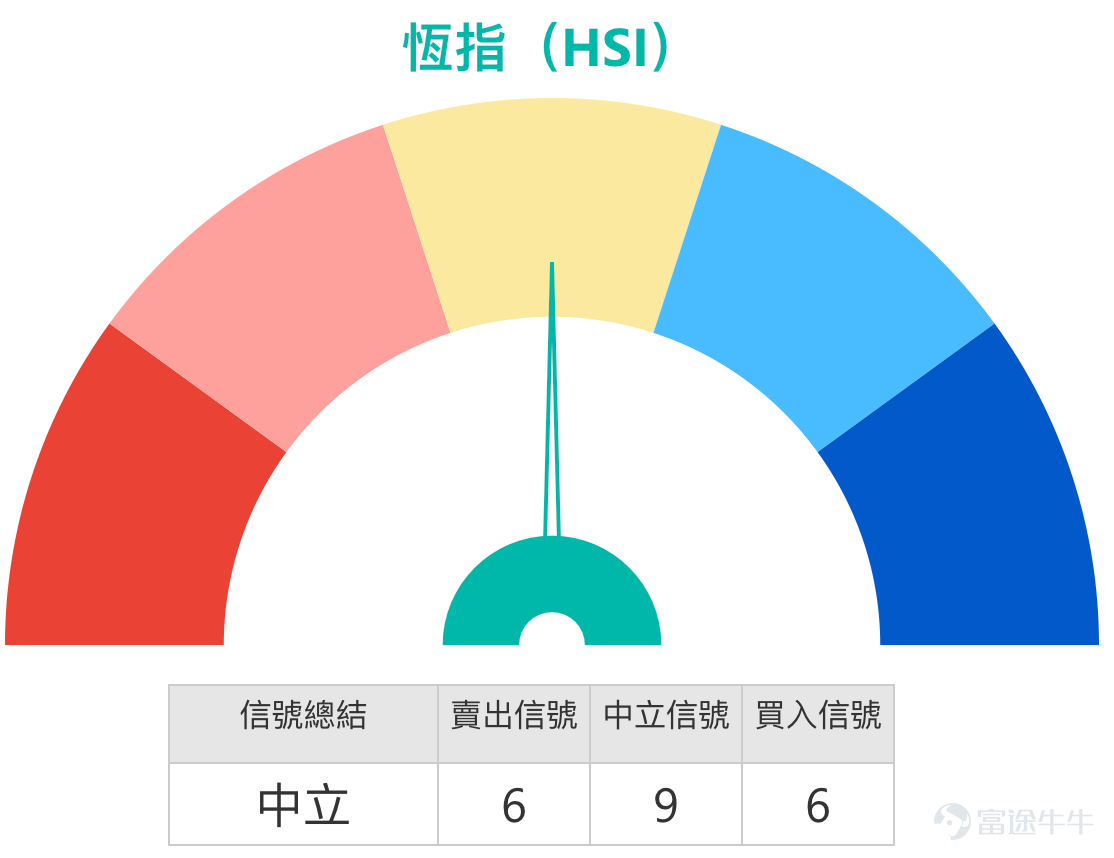
From a technical perspective, the Hang Seng Index (HSI) is in a typical consolidation phase. As of February 4th, the two most important technical indicators for the HSI — the 10-day moving average (around 27,078 points) and the 50-day moving average (around 26,259 points) — form the current range boundaries. After reaching a recent high of about 28,056 points at the end of January, the index began to pull back, and is now constrained below the 10-day moving average, indicating that short-term upward momentum has been hindered. However, the support from the 50-day moving average is also relatively evident, forming a defensive line for the medium-term trend.
A closer observation shows an intensifying divergence in the market. Multiple technical signals present contradictory and seesawing states. On one hand, the MACD indicator, which represents short-term momentum, issues a sell signal, showing adjustment pressure; on the other hand, technical indicators like the Bollinger Bands issue buy signals. This “one bullish, one bearish” distribution of signals precisely confirms the chaotic state of the market currently lacking a unified direction. Meanwhile, the Relative Strength Index (RSI) stands at 51, an absolutely neutral position, indicating that the market hasn't entered overbought or oversold conditions, while also hinting at a temporary balance of power between bulls and bears. Any breakthrough from either side will require greater momentum as a catalyst.
Support and Resistance Analysis: Two Core Battle Zones
In this complex technical backdrop, confirming key support and resistance levels is particularly crucial. Based on multiple analyses and technical models, the core battleground for Hang Seng Index (HSI) is clearly visible.
* Lower Support Area: 26,140 points and 25,679 points
The HSI's first critical line of defense in the near term lies around 26,140 points, which coincides with the support region near the 50-day moving average. If market selling pressure intensifies, the more important second support level will shift lower to 25,679 points, a key area that tests the depth of the market correction and the determination of the bulls' defense.
* Upper Resistance Area: 27,450 points and 27,770 points
If the index attempts to recover upwards, the primary challenge is breaking through the resistance zone at 27,450 points. This is not only where the Fibonacci retracement resistance lies (with the key 0.382 level from the recent high calculated at approximately 26,921 points), but it also aligns closely with the short-term pressure zone near the 10-day moving average. A stronger resistance level lies further above at 27,770 points, close to the previous consolidation range, making it even harder to break through.
![[Share Link: February 3rd [BOC Guest]: Hang Seng Index, China Mobile, Zijin Mining, Zijin Gold International, Pop Mart, Xiaomi Group] The recent performance of the Hang Seng Index (HSI) has been volatile. Just yesterday, Hong Kong stocks opened lower due to overnight declines in U.S. equities, with the Hang Seng Index (HSI) initially trading lower. Technology stocks were the main drag, causing the Hang Seng Tech Index to drop more than 2.2% during intraday trading. However, the market quickly found support at the lows, and as of the close on February 4th, the HSI settled at 26,724.5 points. Although it still fell slightly by 0.41% for the day, there was some recovery from the intraday lows. The index is currently hovering between several key technical levels, leaving the market direction unclear. Internal market data reveals the real tug-of-war and sentiment temperature between bulls and bears. Technical Analysis: Battle Over Key Levels Amid Mid-Term Consolidation From a technical perspective, the Hang Seng Index (HSI) is in a typical consolidation phase. As of February 4th, the two most important technical indicators for the HSI — the 10-day moving average (around 27,078 points) and the 50-day moving average (around 26,259 points) — form the current range boundaries. After reaching a recent high of about 28,056 points at the end of January, the index began to pull back, and is now constrained below the 10-day moving average, indicating that short-term upward momentum has been hindered. However, the support from the 50-day moving average is also relatively evident, forming a defensive line for the medium-term trend. A closer observation shows an intensifying divergence in the market. Multiple technical signals present contradictory and seesawing states. On one hand...](https://nnqimage.futunn.com/sns_client_feed/1162342/20260204/web-1770187181358-sMXoXSM1EM.png/big?area=1&is_public=true&imageMogr2/ignore-error/1/format/webp)
Market Sentiment Consolidation: 'Street Inventory Map' Reveals Collective Wisdom and Market Consensus
Understanding the current market hinges on interpreting investors’ real behavior rather than relying solely on price movements. In the February 3rd episode of the latest 'BOC Guest' program, Niki, Director at BOC International, provided a series of insightful market perspectives and practical advice, clearly outlining the market sentiment and trading strategies.
Niki first pointed out that the current market volatility is intense, and fluctuations in one sector could impact overall sentiment. She strongly advised investors to closely monitor market dynamics and shared a critical observation tool—the Hang Seng Index (HSI) bull and bear warrant distribution map on the BOC International website. She emphasized that on February 3rd, the chart showed that the red zone representing short positions (bear warrants) accounted for about 24%, while the golden zone representing long positions (bull warrants) was as high as 76%. Niki explicitly noted during the program: 'This 76% proportion is the highest I've seen in the past six months. It means that after the market fell to around 26,500 points, investors were quite enthusiastic about bottom-fishing at lower levels, waiting for a rebound.' She further interpreted that 76% of funds are concentrated in bull warrants, with heavy accumulation zones approaching 1,100 futures contracts every 100 points, reflecting the general belief that the HSI has strong support around the 26,000-point level.
When discussing specific strategies, Niki gave cautious yet concrete advice. She reminded viewers: 'Recently, since the beginning of the year—January—many international news events and commodity price fluctuations have been affecting investor sentiment. As a result, the volatility in the broader market has significantly increased, often reaching gains or losses of around 800 points.' Therefore, she recommended investors be more cautious in such highly volatile markets and avoid jumping to conclusions after declines of just one or two hundred points. She offered a core operational strategy: 'I suggest everyone check where the heavy accumulation zones of relevant bull warrants are, and whether there’s potential for a fall towards these zones before considering a rebound play, which would relatively increase success rates.'
For investors looking to deploy tools such as callable bull/bear contracts (CBBCs), Niki also provided specific guidance during the program. She mentioned that given the market had dropped from 28,000 points to near 26,000 points in a short period, volatility expanded, and BOC International offered 'relatively well-priced tools.' For instance, for bull contracts, there are products with stop-loss levels close to 26,400 points (codes 60960 and 60495). $BI#HSI RC2809S.C (60960.HK)$ $BI#HSI RC2809P.C (60495.HK)$; for bear contracts, there are products with stop-loss levels at 27,100 points and 27,200 points respectively (codes 62722 and 62750). $BI#HSI RP2803X.P (62722.HK)$$BI#HSI RP2803Y.P (62750.HK)$She specifically reminded that these products would be updated according to market conditions, advising investors to closely monitor website information.
Lastly, regarding how investors can respond to rapidly changing markets during trading hours, host Simon and Niki also engaged in an interactive discussion. Niki stated that many investors call for consultation when the market moves too quickly, aiming to promptly find the most suitable market tools. She announced BOC International’s CBBC hotline (00+852 3988 6909), recommending that investors with questions can call during market hours so colleagues can provide product suggestions based on real-time data.
Callable Bull/Bear Contracts: Finding Efficiency and Balance in Volatile Markets
In highly volatile Hang Seng Index (HSI) conditions with unclear direction, callable bull/bear contracts (CBBCs) and warrants offer investors more flexible tools for expressing their views. Compared to directly investing in a basket of underlying stocks, their core advantage lies in capital efficiency and strategy diversity, allowing investors to utilize leveraged instruments to make directional bets or hedge against short-term fluctuations in indices or individual stocks with smaller funds.
Current product terms analysis and associated deployment
Considering the HSI's current oscillation between key levels, along with the “heavy accumulation zones for bull contracts” and high street inventory phenomenon analyzed in-depth in 'BOC Guest,' we have outlined the following product strategies for investors with different outlooks:
Investors who agree with the “buying at lows” market consensus revealed in the program, believing the HSI will find support and rebound in the 25,679-26,140 point range, may focus on bull contract products. For example, the BOC bull contract (code 63486) has a stop-loss level set at 25,695 points, very close to the second support level at 25,679 points, offering about 23 times actual leverage. Another BOC bull contract (code 64015) has a stop-loss level at 25,750 points, still above the key support zone, with relatively higher actual leverage of approximately 24.1 times. These products are suitable for investors who believe the downside is limited and wish to capture rebound opportunities with higher leverage but must remain vigilant about the risk of forced stop-loss if the index touches the stop-loss level, aligning with Niki's suggestion of “looking at heavy bull contract zones before betting on a rebound.”
If investors think the 76% street inventory proportion for bull contracts might imply that short-term rebound momentum has been largely priced in, and the market may continue to test lower support levels, they could consider bear contracts as hedging or short-selling tools. For instance, the BOC bear contract (code 53379) has a stop-loss level set at 27,827 points, slightly above the first resistance level at 27,450 points, providing a wider safety buffer and around 22.6 times actual leverage. This is suitable for speculating on market rebounds encountering resistance and falling back or as a tool for hedging existing long stock positions.
For investors wishing to participate in index direction without bearing the forced stop-loss risk of CBBCs, warrants are another option. The BOC call warrant (code 23128) has an exercise price of 28,341 points, with implied volatility being the lowest among similar products, making it ideal for investors expecting the market to sustain upward momentum and break through current resistance levels. The BOC put warrant (code 23127) has an exercise price of 24,875 points, with a favorable combination of leverage and implied volatility, suitable for investors anticipating the market may continue to search for lower support levels.
It is important to emphasize again that callable bull/bear contracts (CBBCs) have a mandatory recall mechanism. Once the index hits the recall price, trading of the product will terminate, potentially resulting in the loss of the entire principal. Meanwhile, the value of warrants will erode over time. Investors should carefully read relevant listing documents before making any decisions and choose instruments based on their own independent judgment and ability to withstand market volatility.
![[Share Link: February 3rd [BOC Guest]: Hang Seng Index, China Mobile, Zijin Mining, Zijin Gold International, Pop Mart, Xiaomi Group] The recent performance of the Hang Seng Index (HSI) has been volatile. Just yesterday, Hong Kong stocks opened lower due to overnight declines in U.S. equities, with the Hang Seng Index (HSI) initially trading lower. Technology stocks were the main drag, causing the Hang Seng Tech Index to drop more than 2.2% during intraday trading. However, the market quickly found support at the lows, and as of the close on February 4th, the HSI settled at 26,724.5 points. Although it still fell slightly by 0.41% for the day, there was some recovery from the intraday lows. The index is currently hovering between several key technical levels, leaving the market direction unclear. Internal market data reveals the real tug-of-war and sentiment temperature between bulls and bears. Technical Analysis: Battle Over Key Levels Amid Mid-Term Consolidation From a technical perspective, the Hang Seng Index (HSI) is in a typical consolidation phase. As of February 4th, the two most important technical indicators for the HSI — the 10-day moving average (around 27,078 points) and the 50-day moving average (around 26,259 points) — form the current range boundaries. After reaching a recent high of about 28,056 points at the end of January, the index began to pull back, and is now constrained below the 10-day moving average, indicating that short-term upward momentum has been hindered. However, the support from the 50-day moving average is also relatively evident, forming a defensive line for the medium-term trend. A closer observation shows an intensifying divergence in the market. Multiple technical signals present contradictory and seesawing states. On one hand...](https://nnqimage.futunn.com/sns_client_feed/1162342/20260204/web-1770187113835-1CDZV3K4up.jpeg/big?area=1&is_public=true&imageMogr2/ignore-error/1/format/webp)
Interaction and Reminder
After discussing so much, with the Hang Seng Index caught in a tug-of-war between support at 26,140 points and resistance at 27,450 points, as well as the “bottom-fishing sentiment” revealed by 'BOC Visits,' where up to 76% of the street's holdings are bullish certificates, what are your thoughts?
A. Strength in numbers; follow the trend for a rebound
B. Contrarian thinking; be cautious when everyone is optimistic
C. Unclear outlook; stay on the sidelines for now
Feel free to share your choice or opinion in the comment section; let’s discuss!
For analysis of Hong Kong stock warrants and bull/bear contracts, this is Jenny, see you again next time!
Disclaimer: This article does not constitute any investment advice.
This article is for reference only and does not constitute any investment advice. The market data, opinions, and analyses contained herein may change at any time without prior notice. We assume no responsibility for any loss or damage resulting from reliance on the information provided in this article. Technical analysis only indicates whether certain technical conditions are met. A comprehensive evaluation of asset performance should be conducted by integrating additional data. Trading decisions should not be made solely based on this article. Please note that past performance is not indicative of future results.
#Hang Seng Index #Technical Analysis #Support and Resistance Levels #Bull and Bear Certificates Street Holdings #Bank of China Guest Appearance #Hong Kong Stock Short-term #Warrants #Bull and Bear Certificates #Market Sentiment #Derivatives
Risk Disclaimer: The above content only represents the author's view. It does not represent any position or investment advice of Futu. Futu makes no representation or warranty.Read more

Comments
to post a comment
2