English
Back
Open Account
港股窩輪Jenny
wrote a column · Feb 4 11:50

[Warrant Insights] CNOOC’s resistance at 24.5 yuan, how can bull certificates capture the breakout?

On February 3, $CNOOC (00883.HK)$
Closing price of 23.36 yuan, a slight increase of 0.60% in a single day, with a trading volume of 1.654 billion yuan. The trading volume remained stable without unusual spikes or drops, reflecting relatively calm market sentiment.
From a technical indicator analysis:
The stock price is currently holding firmly above the MA30 (21.95 yuan) and MA60 (21.74 yuan), and is only slightly below the MA10 (23.48 yuan), indicating a healthy consolidation pattern in a strong uptrend. The medium-term upward trend remains unchanged, with short-term temporary pullbacks seeking support from the moving averages.
On February 3, $CNOOC (00883.HK)$ Closing price of 23.36 yuan, a slight increase of 0.60% in a single day, with a trading volume of 1.654 billion yuan. The trading volume remained stable without unusual spikes or drops, reflecting relatively calm market sentiment. From a technical indicator analysis: The stock price is currently holding firmly above the MA30 (21.95 yuan) and MA60 (21.74 yuan), just slightly below the MA10 (23.48 yuan), indicating a healthy consolidation pattern. The medium-term uptrend remains intact, with only a temporary pullback to seek support from moving averages. The RSI indicator stands at 58, within a moderately strong range, neither entering the overbought zone above 70 nor breaking below the weak boundary of 50, suggesting that the rise and fall of the share price is moderate, with no signs of excessive speculation. The overall technical signal is “neutral” with a strength of 8, further confirming the current consolidation pattern. The current trend favors consolidation; there's no need to rush in or out, and investors can patiently observe the stock price’s potential breakout above the MA10. On February 3, the oil and gas sector experienced a small overall rise. Apart from CNOOC, the performance of two other core stocks is as follows: 1、 $PETROCHINA (00857.HK)$ : Closing price of 8.97 yuan, a slight increase of 0.22% in a single day. The stock price is higher than the MA10 (8.88 yuan) and MA30 (8.43 yuan). The RSI indicator is 62 (moderately strong). The comprehensive technical signal is also “neutral,” with a strength of 8. The trend is highly similar to CNOOC’s, both showing strong consolidation...
The RSI indicator stands at 58, within a neutral-to-strong range, neither entering the overbought zone above 70 nor breaking below the weak dividing line of 50, suggesting that the rise and fall rhythm of the stock price is moderate without signs of excessive speculation. The overall technical signal is 'Neutral', with a strength level of 8, further confirming the current consolidation pattern. The current trend is consolidating, so there's no rush to enter or exit; investors can patiently observe whether the stock price breaks through the MA10.
On February 3, $CNOOC (00883.HK)$ Closing price of 23.36 yuan, a slight increase of 0.60% in a single day, with a trading volume of 1.654 billion yuan. The trading volume remained stable without unusual spikes or drops, reflecting relatively calm market sentiment. From a technical indicator analysis: The stock price is currently holding firmly above the MA30 (21.95 yuan) and MA60 (21.74 yuan), just slightly below the MA10 (23.48 yuan), indicating a healthy consolidation pattern. The medium-term uptrend remains intact, with only a temporary pullback to seek support from moving averages. The RSI indicator stands at 58, within a moderately strong range, neither entering the overbought zone above 70 nor breaking below the weak boundary of 50, suggesting that the rise and fall of the share price is moderate, with no signs of excessive speculation. The overall technical signal is “neutral” with a strength of 8, further confirming the current consolidation pattern. The current trend favors consolidation; there's no need to rush in or out, and investors can patiently observe the stock price’s potential breakout above the MA10. On February 3, the oil and gas sector experienced a small overall rise. Apart from CNOOC, the performance of two other core stocks is as follows: 1、 $PETROCHINA (00857.HK)$ : Closing price of 8.97 yuan, a slight increase of 0.22% in a single day. The stock price is higher than the MA10 (8.88 yuan) and MA30 (8.43 yuan). The RSI indicator is 62 (moderately strong). The comprehensive technical signal is also “neutral,” with a strength of 8. The trend is highly similar to CNOOC’s, both showing strong consolidation...
On February 3, the oil and gas sector saw slight gains overall. Apart from CNOOC, the performances of two other key stocks are as follows:
1、 $PETROCHINA (00857.HK)$ : Closing price at 8.97 yuan, up 0.22% for the day. The stock price is above the MA10 (8.88 yuan) and MA30 (8.43 yuan). The RSI indicator is 62 (neutral-to-strong), and the overall technical signal is also 'Neutral' with a strength level of 8. Its trend is highly similar to that of CNOOC, both in a strong consolidation phase.
2、 $SINOPEC CORP (00386.HK)$ : Closing price at 5.32 yuan, up 1.33% for the day, making it the best-performing stock among the three. The stock price remains stable above the short-term moving averages, but note that its RSI has reached 70, just entering the overbought region. It may face profit-taking pressure in the short term, so investors are advised to closely monitor its trend changes.
As of 11:35 AM today (February 4), CNOOC's latest price was 23.6 yuan, up temporarily by 1.03%.Key resistance levels are at 24.5 yuan (first-level resistance) and 25.9 yuan (second-level resistance); key support levels are at 22.1 yuan (first-level support) and 20.8 yuan (second-level support). The stock price is currently in the middle zone between support and resistance. Subsequent attention should focus on whether the price can break through resistance or hold onto support to determine the next move.
Review and Selection of Bull/Bear Warrants:
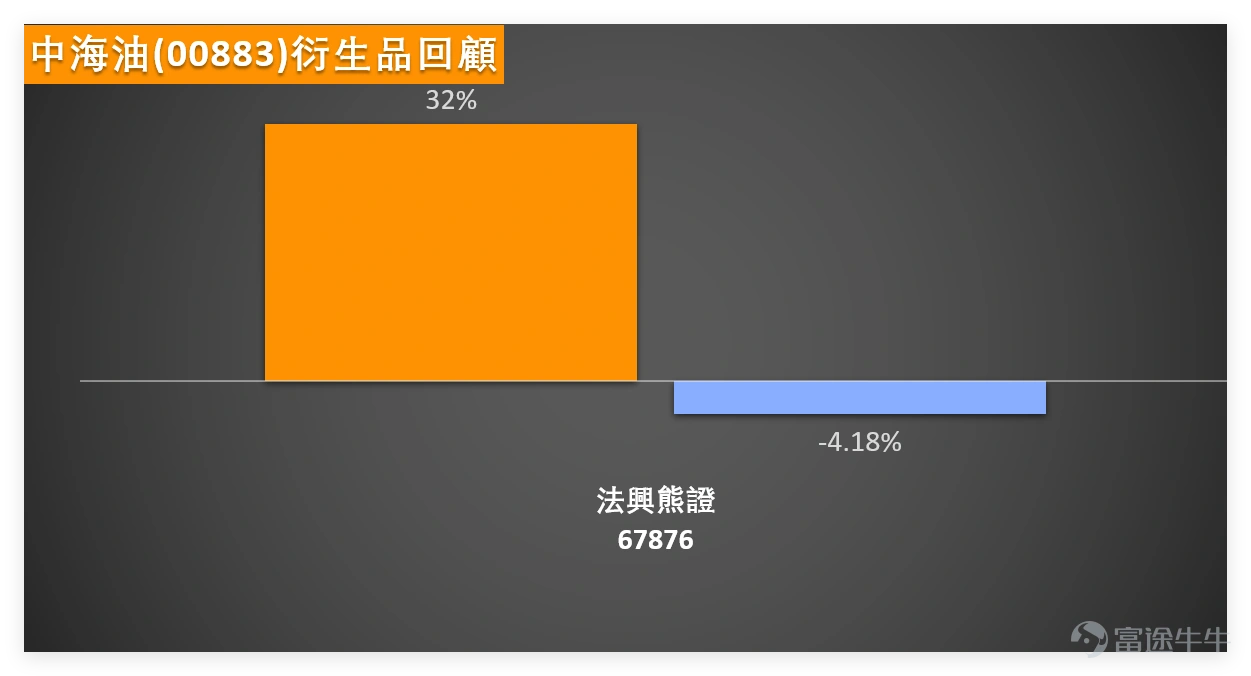
Product Review: The CNOOC-related warrant mentioned on January 30, 2026, $SG#CNOOCRP2605B.P (67876.HK)$ rose 32% in two days, while the underlying stock fell 4.18% during the same period. The product performance matched the underlying stock’s movement, reminding investors that warrants have high volatility, and profits should be secured promptly while managing risks.
On February 3, $CNOOC (00883.HK)$ Closing price of 23.36 yuan, a slight increase of 0.60% in a single day, with a trading volume of 1.654 billion yuan. The trading volume remained stable without unusual spikes or drops, reflecting relatively calm market sentiment. From a technical indicator analysis: The stock price is currently holding firmly above the MA30 (21.95 yuan) and MA60 (21.74 yuan), just slightly below the MA10 (23.48 yuan), indicating a healthy consolidation pattern. The medium-term uptrend remains intact, with only a temporary pullback to seek support from moving averages. The RSI indicator stands at 58, within a moderately strong range, neither entering the overbought zone above 70 nor breaking below the weak boundary of 50, suggesting that the rise and fall of the share price is moderate, with no signs of excessive speculation. The overall technical signal is “neutral” with a strength of 8, further confirming the current consolidation pattern. The current trend favors consolidation; there's no need to rush in or out, and investors can patiently observe the stock price’s potential breakout above the MA10. On February 3, the oil and gas sector experienced a small overall rise. Apart from CNOOC, the performance of two other core stocks is as follows: 1、 $PETROCHINA (00857.HK)$ : Closing price of 8.97 yuan, a slight increase of 0.22% in a single day. The stock price is higher than the MA10 (8.88 yuan) and MA30 (8.43 yuan). The RSI indicator is 62 (moderately strong). The comprehensive technical signal is also “neutral,” with a strength of 8. The trend is highly similar to CNOOC’s, both showing strong consolidation...
Next, we’ve selected two CNOOC-related warrant and bull certificate products, focusing on the rationality of leverage and premium levels for your reference:
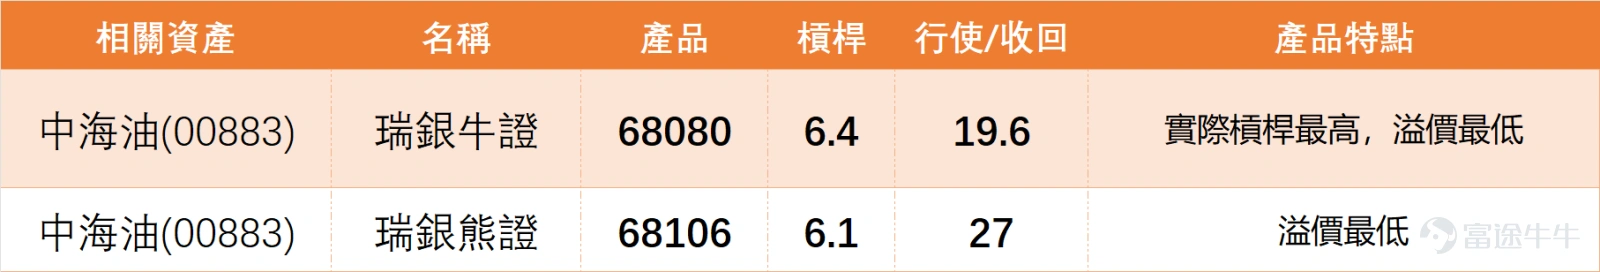
1、 $UB#CNOOCRC26106.C (68080.HK)$: Actual leverage is 6.4, with a strike price of HK$19.6. The core advantage is the highest actual leverage and the lowest premium, making it relatively cost-effective. Suitable for investors who are optimistic about CNOOC’s short-term strength and are willing to take corresponding risks.
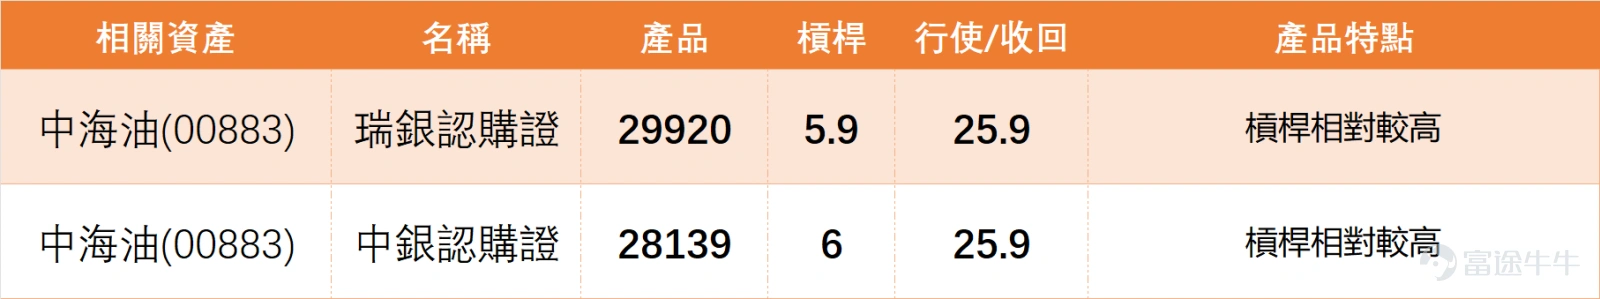
2、 $BICNOOC@EC2611A.C (28139.HK)$: Leverage is 6.0, with a strike price of HK$25.9. The leverage is within a reasonable range, and the product liquidity is relatively stable. Suitable for investors looking to capitalize on CNOOC breaking through resistance levels while seeking moderate leveraged returns.
On February 3, $CNOOC (00883.HK)$ Closing price of 23.36 yuan, a slight increase of 0.60% in a single day, with a trading volume of 1.654 billion yuan. The trading volume remained stable without unusual spikes or drops, reflecting relatively calm market sentiment. From a technical indicator analysis: The stock price is currently holding firmly above the MA30 (21.95 yuan) and MA60 (21.74 yuan), just slightly below the MA10 (23.48 yuan), indicating a healthy consolidation pattern. The medium-term uptrend remains intact, with only a temporary pullback to seek support from moving averages. The RSI indicator stands at 58, within a moderately strong range, neither entering the overbought zone above 70 nor breaking below the weak boundary of 50, suggesting that the rise and fall of the share price is moderate, with no signs of excessive speculation. The overall technical signal is “neutral” with a strength of 8, further confirming the current consolidation pattern. The current trend favors consolidation; there's no need to rush in or out, and investors can patiently observe the stock price’s potential breakout above the MA10. On February 3, the oil and gas sector experienced a small overall rise. Apart from CNOOC, the performance of two other core stocks is as follows: 1、 $PETROCHINA (00857.HK)$ : Closing price of 8.97 yuan, a slight increase of 0.22% in a single day. The stock price is higher than the MA10 (8.88 yuan) and MA30 (8.43 yuan). The RSI indicator is 62 (moderately strong). The comprehensive technical signal is also “neutral,” with a strength of 8. The trend is highly similar to CNOOC’s, both showing strong consolidation...
Risk Warning:Warrants and bull/bear certificates are derivatives that carry expiry and leverage risks. Investors should choose according to their risk tolerance and act within their means.
What’s your outlook on CNOOC's next move? A. Breakthrough above the resistance at HK$24.5. B. Pullback to support at HK$22.1. C. Continue consolidating sideways.
Come to the comment section and share your thoughts! Want to see more analysis? Remember to follow 'HK Stock Warrants Jenny' for daily updates!
Disclaimer: This article does not constitute any investment advice.
This article is for reference only and does not constitute any investment advice. The market data, opinions, and analysis contained herein may change at any time without prior notice. We are not responsible for any loss or damage caused by reliance on the information in this article. Technical analysis only shows whether certain technical conditions are met; a comprehensive assessment of asset performance should be conducted using additional data. Decisions to trade should not be based solely on this article. Please note that past performance is not indicative of future results.
#HongKongStocks #RealTimeAnalysis #WarrantsSelection #WarrantsStrategy #DerivativesHedging #HongKongWarrantsJenny #CNOOC #OilAndGasSector #TechnicalAnalysis
Risk Disclaimer: The above content only represents the author's view. It does not represent any position or investment advice of Futu. Futu makes no representation or warranty.Read more
156K Views
Report
Comment (1)
Write a Comment...
1