

How to view the post-holiday market trend in Hong Kong stocks?

[Warrant Insights] TaiTech soars, technical indicators flash buy signal, how to capture peak opportunities with warrants?
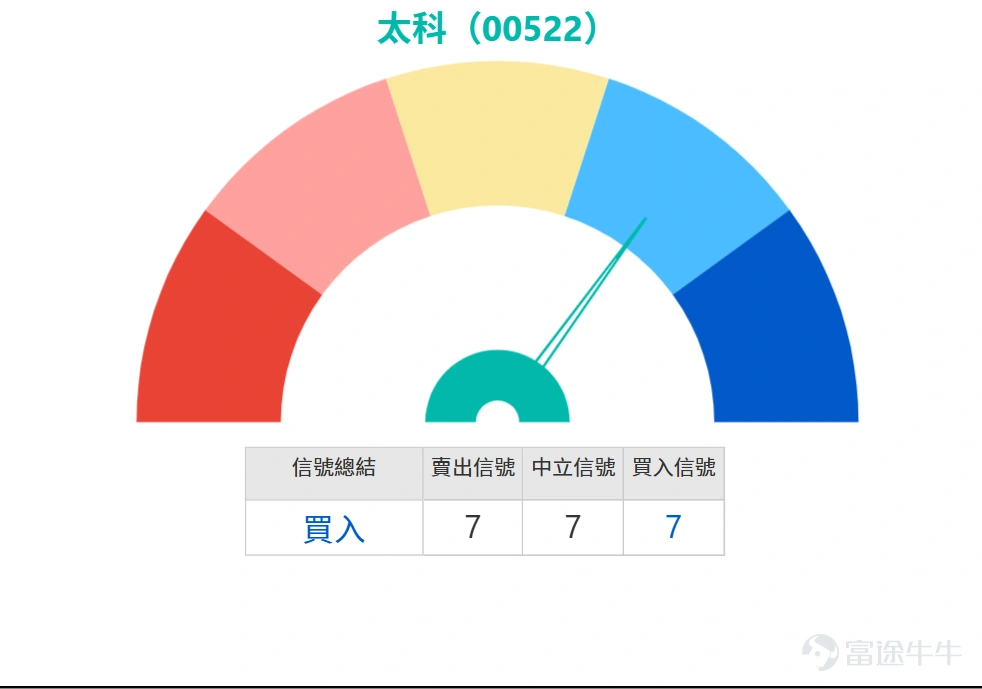
Hello everyone, in this issue let's talk about the trend of Pacific Tech (00522). This stock was quite eye-catching today (February 3rd), reaching a new price of $104.7 as of 11:54 AM, with a single-day increase of 4.86%. The turnover reached nearly $80,000, and market sentiment seems fairly active. Looking back at the technical indicators, RSI stands at 66, with a buy signal strength of 7 points. Many indicators are showing bullish signals—is it really time to enter the market? What do you all think?
From a technical analysis perspective, TaiTech’s current price is slightly below the MA10 level of $104.45 but significantly above the MA30 level of $92.21 and MA60 level of $84.50, indicating that the medium- to long-term trend remains upward. The five-day volatility is 11.7%, showing substantial share price fluctuations and decent room for short-term trading. However, it’s important to note that the MACD signal shows a sell indication, conflicting with other buy signals. Could there be a market correction ahead? Have you set your profit-taking and stop-loss levels?
Support and resistance level analysis is critical. Currently, the first support level is at $95.6, and the second support level is at $87. The first resistance level is at $110, and the second resistance level is at $114.9. If the stock price can break through the $110 mark, upside potential may open up; however, if it falls below the support levels, downward pressure will intensify. There is a 52% probability of an uptrend, meaning the future direction is not yet entirely clear. How do you assess the role of these key levels?
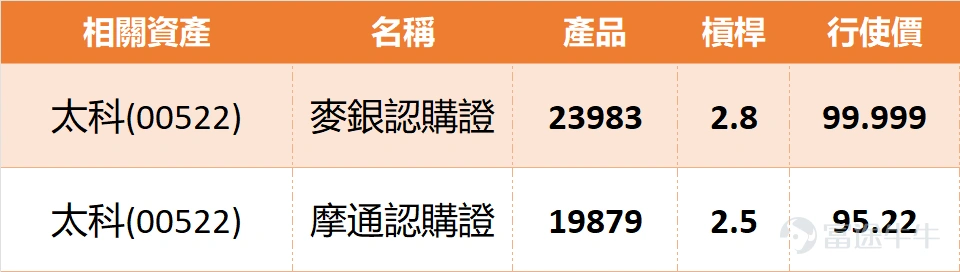
When discussing warrant opportunities, there are two call warrants in the market worth studying further. One of them is the Macquarie Call Warrant 23983. $MBASMPT@EC2607A.C (23983.HK)$ , with a leverage of 2.8 times, a strike price of 99.999 yuan, and the lowest implied volatility, suitable for investors looking for higher returns while being able to withstand fluctuations. Another option is the J.P. Morgan call warrant 19879.$JPASMPT@EC2607A.C (19879.HK)$ , with the highest leverage at 2.5 times, a strike price of 95.22 yuan, the lowest premium within the range, and relatively lower entry costs.
In terms of technical indicator summary and outlook, the overall signals lean towards buying, but the strength is moderate. The ADX indicator is neutral, the Psychological Line is neutral, the Momentum Oscillator is neutral, the ROC indicates buying, the VR trading ratio is neutral, the Bull-Bear Power shows buying, the Ichimoku Cloud indicates buying, and the MACD signal shows selling, while the Bollinger Bands indicate buying. With so many conflicting indicators, how should investors interpret them? For future prospects, if the stock price stabilizes above the support level, it may gradually challenge the resistance level, but one must be wary of risks from data fluctuations. Which indicator do you think is the most reliable? Or would you make a decision based on a combination of all factors?
Lastly, let me ask: Do you have confidence in Techtronic Industries' future performance? Is anyone already deploying strategies using warrants or bull/bear contracts? Feel free to leave comments and discuss; let’s exchange strategies and insights!
This article does not constitute any investment advice.
This article is for reference only and does not constitute any investment advice. The market data, opinions, and analysis contained herein may change at any time without prior notice. We are not responsible for any loss or damage caused by reliance on the information in this article. Technical analysis only shows whether certain technical conditions are met; a comprehensive assessment of asset performance should be conducted using additional data. Decisions to trade should not be based solely on this article. Please note that past performance is not indicative of future results.
#TaiKong #00522 #Semiconductors #Warrants #TechnicalAnalysis #SupportAndResistanceLevels #HongKongStocks #BrokerRatings #SouthboundCapital #MarketOutlook
Risk Disclaimer: The above content only represents the author's view. It does not represent any position or investment advice of Futu. Futu makes no representation or warranty.Read more
Comments
to post a comment