
How to view the post-holiday market trend in Hong Kong stocks?

Comprehensive Analysis of Alibaba's Short-Term Trend: Battle for Key Levels Begins, How to Position Warrants, Bull, and Bear Contracts?
$BABA-W (09988.HK)$The Hong Kong stock market has started the new year with significant volatility, and the performance of leading technology stocks is particularly concerning. Today, we will conduct an in-depth analysis of Alibaba's (09988.HK) short-term technical pattern and the latest market trends, and provide a clear strategy for using derivative tools for short-term deployment by combining key support and resistance levels.
Technical Analysis: Trend Weakening and Key Support Level Battle
As of February 2, 2026, Alibaba's share price closed at HKD 163.3, marking a significant single-day drop of 3.49%, with the price retreating to a recent critical zone. From a technical perspective, the market is undergoing an adjustment from strength to weakness.
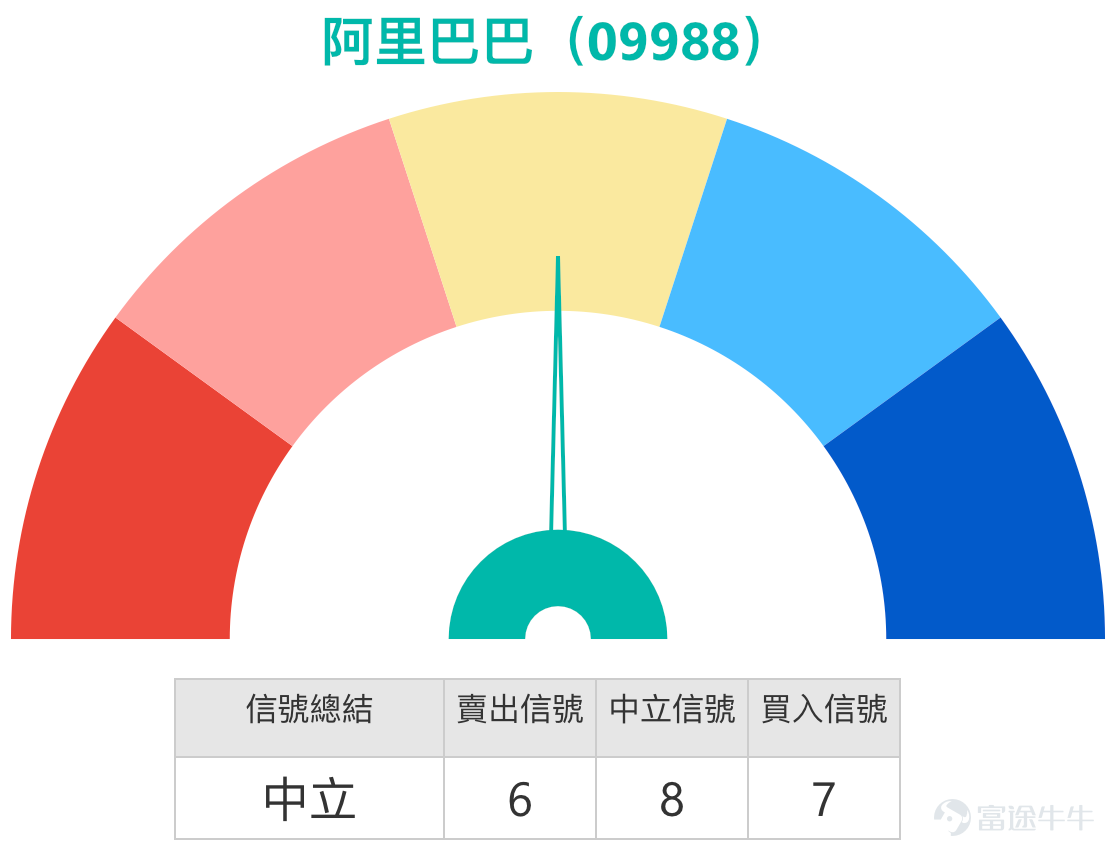
On one hand, the short-term trend is being tested. The stock price has fallen below the 10-day moving average (HKD 167.06) but remains above the critical 30-day (HKD 156.41) and 60-day (HKD 155.47) moving averages. Diverging signals from multiple moving averages indicate that short-term adjustment pressures are competing with the medium-term upward trend. The MACD indicator turning into a sell signal also confirms the strengthening of short-term downward momentum.
On the other hand, oscillation indicators as a whole present a neutral stance, showing significant market divergence at the current level. The RSI (Relative Strength Index) is at a neutral level of 53, while Williams %R and Stochastic Oscillators show no clear overbought or oversold signals. This technical combination suggests that the market is awaiting new directional guidance, and in the short term, the stock price may fluctuate between key price levels.

Support and Resistance Analysis: Two Key Price Ranges
Based on the comprehensive technical pattern and market consensus, Alibaba's key price range at present is very clear.
* Core Support Zone: 155.8 yuan and 149.5 yuan
The most critical defense line is currently near 155.8 yuan. This level not only serves as an important psychological threshold but also closely aligns with the 30-day and 60-day moving averages (156.41 yuan and 155.47 yuan), expected to provide strong technical support. If this area breaks down, the next substantial support will be at 149.5 yuan, which will be a key turning point to determine whether the current uptrend undergoes a fundamental reversal.
* Key Resistance Zone: 171.6 yuan and 174.6 yuan
Looking upward, the first strong resistance is at 171.6 yuan. This level represents not only a previous area of heavy trading but also a pressure point near the 10-day moving average, where rebounds might face significant selling pressure. Stronger resistance lies near 174.6 yuan, close to the previous rebound high. A successful breakout here would restore upward momentum and potentially lead to testing higher levels.
Market View Consolidation: Resilience of Fundamentals and Market Trends in Sync
Currently influencing Alibaba’s share price is a synergy of solid fundamentals and positive market trends. According to the January 28 column 'UBS Visit,' the market’s attention on Alibaba is mainly based on three positive factors: First, the company plans to spin off its semiconductor business through an IPO, which could increase the group’s overall valuation; second, the 'discount trend' on its Ele.me platform might come to an end, potentially reducing related losses; third, the company’s AI business has been integrated into platforms like Fliggy and AutoNavi, which could drive future growth.
The combination of these short-term hotspots with medium- to long-term earnings resilience forms the foundation for stock price support. In a report from November last year, BOC International pointed out that Alibaba's core e-commerce and cloud businesses showed steady growth, maintaining a 'Buy' rating. However, after a rapid rise in stock price, profit-taking emerged at higher levels, reflecting market demand for cashing out gains when prices are high.
Warrants and Bull/Bear Contracts: Review of Product Advantages and Recent Performance
In volatile market conditions, warrants and bull/bear contracts provide investors with strategic tools different from direct investment in underlying stocks. Their core advantages lie in the efficiency of capital utilization and the flexibility of risk-return structures, allowing investors to establish positions matching their clear judgments on future market directions (whether bullish or bearish) to manage risks or capture trading opportunities.
Reviewing some products mentioned on January 29, we can clearly see the characteristics of derivative products amid market volatility. Against the backdrop of Alibaba’s stock price falling by 5.77% over the following two days:
- Societe Generale Alibaba Bear Contract (61344) $SG#ALIBARP2810S.P (61344.HK)$ Price increased by 129%.

These products effectively amplify the profit potential from a decline in the underlying stock, vividly demonstrating the ability of derivatives to enhance capital efficiency when directional judgment is correct.
Current product terms analysis and associated deployment
Considering that Alibaba’s share price is currently testing a key support level, we have screened the following products for investors with different directional views, providing detailed explanations of their terms and strategic relevance:
Bullish direction: Betting on a rebound after stabilization at the key support level
If investors believe that the key support area at HKD 155.8 can hold, the share price may stabilize and rebound. The following products could be considered:
* Call Warrants: J.P. Morgan Alibaba Call Warrant (14611) offers approximately 5.9 times effective leverage, with a strike price of HKD 190.10, which is quite far from the current share price, making it an out-of-the-money warrant characterized by relatively low implied volatility. HSBC Alibaba Call Warrant (14335), with a strike price of HKD 190.00 and leverage of about 5.8 times, is considered to have an ideal balance of leverage and implied volatility levels.
* Bull Contracts: Societe Generale Alibaba Bull Contract (55803) provides up to approximately 17.2 times actual leverage, a sharp tool for capturing rebounds. Its stop-loss level is set at HKD 155.5, very close to the first support level at HKD 155.8. This means that if the share price successfully stabilizes and rebounds at this support level, the bull contract will fully leverage its high-leverage effect. Its advantage lies in “the lowest premium and relatively higher actual leverage.” Another option, Morgan Stanley Alibaba Bull Contract (55551), has a stop-loss level of HKD 155 and offers about 15.3 times actual leverage, also characterized by high leverage and low premium.

Bearish direction: Betting on a breakdown below the support level
If investors believe that the stock price may fall below 155.8 yuan and look for support at the next support level of 149.5 yuan, they can pay attention to the following products:
* Put Warrants: UBS Group Alibaba Put Warrant (21397) offers about 8.3 times effective leverage, with a strike price of 140.88 yuan, below the second support level of 149.5 yuan, providing a deeper margin of safety, and its implied volatility is relatively low. BOC Alibaba Put Warrant (21943), with a strike price of 144.90 yuan and leverage of about 5 times, has an ideal combination of leverage and implied volatility.
* Bear Contracts: Societe Generale Alibaba Bear Contract (58217) has a recovery price set at 185 yuan, far from the current share price, offering about 8.2 times actual leverage, with the advantage of being 'lowest premium, higher actual leverage.' J.P. Morgan Alibaba Bear Contract (59171) has a recovery price of 188 yuan and actual leverage of about 6.9 times; its features are also high leverage and low premium, suitable for investors who are bearish on the future market.

Interaction and Reminder
Faced with this battle between bulls and bears near Alibaba's key support level, which side would you choose?
A. Support Defender! Believe that the 155.8 yuan line is unbreakable, ready to deploy bull contracts or call warrants to bet on a technical rebound.
B. Trend Pessimists. Believe that the adjustment is not over yet, and any rebound is an opportunity to reduce positions or use bear contracts and put warrants to capitalize on the downtrend.
C. Cool Observers. With such market divergence, wait until the share price clearly breaks through 171.6 yuan or falls below 155.8 yuan before making a decision.
Feel free to share your letter choice or specific opinions in the comment section, let’s discuss!
Lastly, a reminder to all friends: Derivative products are high-risk investment tools with significant price fluctuations and potential loss of entire principal. Before investing, be sure to carefully read the relevant listing documents, fully understand the product characteristics, and make decisions based on your own independent judgment.
For analysis of Hong Kong stock warrants and bull/bear certificates, this is Jenny. See you again next time!
Disclaimer: This article does not constitute any investment advice.
This article is for reference only and does not constitute any investment advice. The market data, opinions, and analysis contained herein may change at any time without prior notice. We assume no responsibility for any loss or damage caused by reliance on the information in this article. Technical analysis only shows whether certain technical conditions are met; a comprehensive assessment of asset performance should combine other data sources, and trading decisions should not be made solely based on this article. Please note that past performance is not indicative of future results.
#Alibaba #TechnicalAnalysis #SupportResistanceLevels #Derivatives #BullBearCertificates #ImpliedVolatility #ShortTermHKStocks #TechStocks #DerivativeTools #CapitalEfficiency
Risk Disclaimer: The above content only represents the author's view. It does not represent any position or investment advice of Futu. Futu makes no representation or warranty.Read more

Comments
to post a comment
1
9