English
Back
Open Account
How to view the post-holiday market trend in Hong Kong stocks?

港股窩輪Jenny
joined discussion · Feb 3 09:23

[Warrant Perspective] Hang Seng Index 5-day volatility at 5.8%, focus on key support levels for future trends

On February 2, the Hong Kong stock market experienced widespread adjustments, $Hang Seng Index (800000.HK)$
The full-day closing was at 26,775.57 points, a single-day drop of 2.23%, with a trading volume of 347.886 billion yuan. The five-day volatility reached 5.8%.
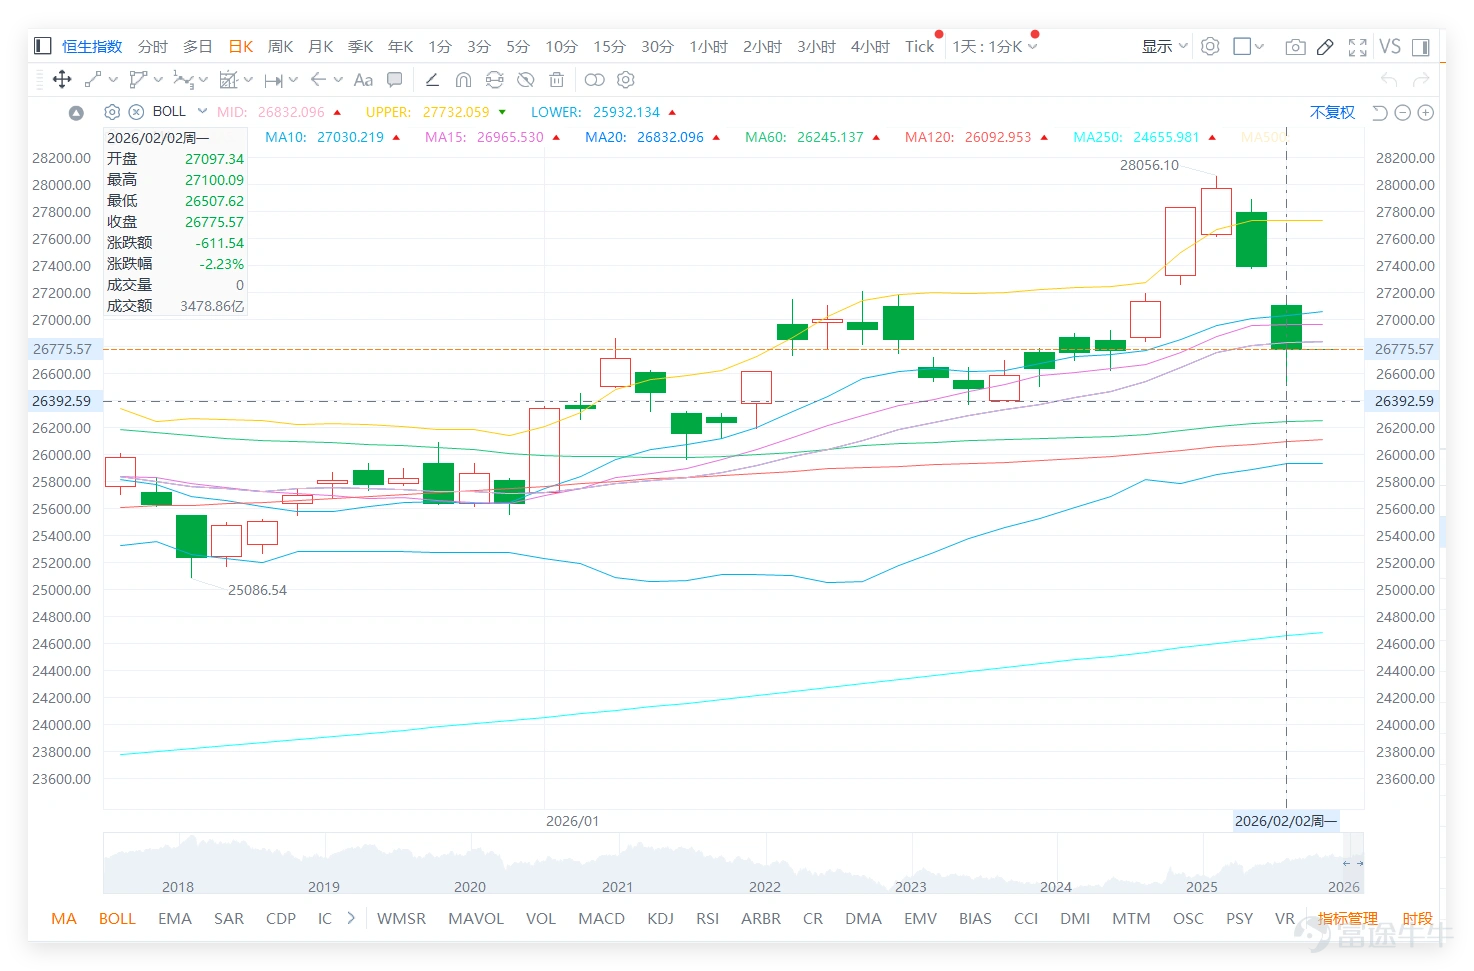
On February 2, the Hong Kong stock market experienced widespread adjustments, $Hang Seng Index (800000.HK)$ Closing at 26,775.57 points for the day, down 2.23% in a single day, with a trading volume of 347.886 billion yuan and a 5-day volatility reaching 5.8%. In terms of indicators, the Hang Seng Index RSI is 50, in the neutral zone; the overall technical indicator summary signal is neutral, with a signal strength of 8; multiple moving averages show buy signals, but several oscillation indicators remain neutral, leaving the overall direction unclear. From a support and resistance perspective, short-term support levels for the Hang Seng Index are 26,180 points and 25,730 points, with resistance levels at 27,487 points and 27,891 points, with subsequent focus recommended on the support level near 26,180 points. In terms of individual stock performance, the top ten major blue chips closed lower across the board, with declines ranging from 1.01% to 3.49%. Among them, technology stocks (Alibaba, Meituan) and financial stocks (HSBC, Ping An) showed relatively significant adjustments. Technically, some individual stocks entered the oversold region, while others remained in a volatile pattern, showing notable divergence. Investors can pay close attention to how indicator signals align with support and resistance levels: 1. $TENCENT (00700.HK)$ : Closing at 598.5 HKD (down 1.24%), bearish alignment, RSI 40 (neutral), short-term suppressed by the moving average; 2. $AIA (01299.HK)$ : Closing at 89.05 HKD (down 1.44%), range-bound fluctuation, RSI 63 (approaching overbought)...
From the indicators' perspective, the Hang Seng Index RSI is 50, in the neutral zone; the technical indicator summary signal is neutral, with a signal strength of 8; multiple moving averages show buy signals, but several oscillation indicators are neutral, leaving the overall direction unclear.
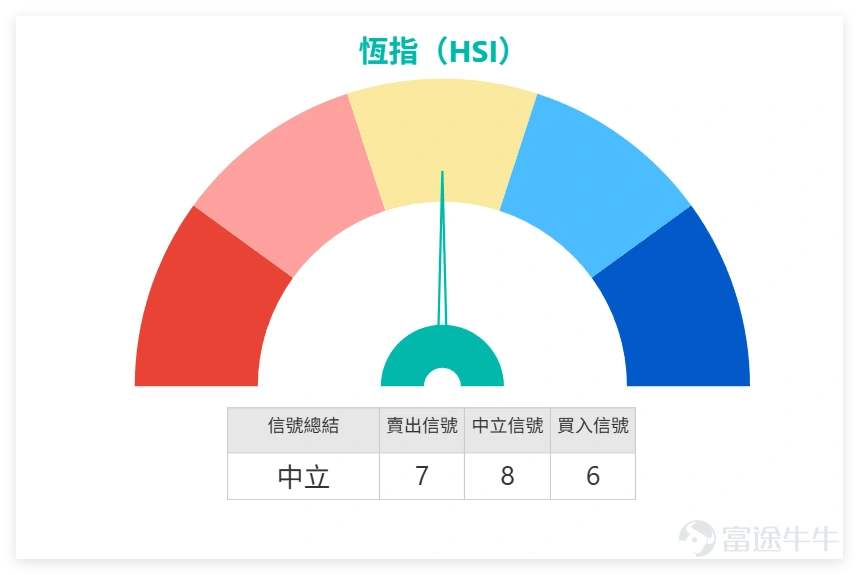
On February 2, the Hong Kong stock market experienced widespread adjustments, $Hang Seng Index (800000.HK)$ Closing at 26,775.57 points for the day, down 2.23% in a single day, with a trading volume of 347.886 billion yuan and a 5-day volatility reaching 5.8%. In terms of indicators, the Hang Seng Index RSI is 50, in the neutral zone; the overall technical indicator summary signal is neutral, with a signal strength of 8; multiple moving averages show buy signals, but several oscillation indicators remain neutral, leaving the overall direction unclear. From a support and resistance perspective, short-term support levels for the Hang Seng Index are 26,180 points and 25,730 points, with resistance levels at 27,487 points and 27,891 points, with subsequent focus recommended on the support level near 26,180 points. In terms of individual stock performance, the top ten major blue chips closed lower across the board, with declines ranging from 1.01% to 3.49%. Among them, technology stocks (Alibaba, Meituan) and financial stocks (HSBC, Ping An) showed relatively significant adjustments. Technically, some individual stocks entered the oversold region, while others remained in a volatile pattern, showing notable divergence. Investors can pay close attention to how indicator signals align with support and resistance levels: 1. $TENCENT (00700.HK)$ : Closing at 598.5 HKD (down 1.24%), bearish alignment, RSI 40 (neutral), short-term suppressed by the moving average; 2. $AIA (01299.HK)$ : Closing at 89.05 HKD (down 1.44%), range-bound fluctuation, RSI 63 (approaching overbought)...
In terms of support and resistance, the short-term support levels for the Hang Seng Index are 26,180 points and 25,730 points, while the resistance levels are 27,487 points and 27,891 points. Subsequent focus can be placed on the support strength near 26,180 points.
In terms of individual stock performance, all ten key blue-chip stocks closed lower, with declines ranging from 1.01% to 3.49%. Among them, tech stocks (Alibaba, Meituan) and financial stocks (HSBC, Ping An) saw relatively significant adjustments. Technically, some stocks have entered the oversold region, while others remain in a consolidation pattern. The divergence is prominent, and investors can focus on the alignment between indicator signals and support/resistance levels.
1. $TENCENT (00700.HK)$ : Closed at 598.5 yuan (down 1.24%), bearish alignment, RSI 40 (neutral), short-term suppressed by the moving average;
2. $AIA (01299.HK)$ : Closed at 89.05 yuan (down 1.44%), range-bound consolidation, RSI 63 (approaching overbought), composite signal suggests selling;
3. $BABA-W (09988.HK)$ : Closed at 163.3 yuan (down 3.49%), weak trend, RSI 53, technical signal suggests selling;
4. $HSBC HOLDINGS (00005.HK)$ : Closed at 134.7 yuan (down 1.39%), contention near MA10, RSI 65, strong sell signal;
5. $MEITUAN-W (03690.HK)$ : Closed at 94.85 yuan (down 2.42%), pressured below the moving average, RSI 36 (approaching oversold), technical signal suggests buying;
6. $CCB (00939.HK)$ : Closed at 7.83 yuan (down 1.01%), consolidation pattern, RSI 53, technical signal suggests selling, with smaller fluctuations;
7. $PING AN (02318.HK)$ : Closed at 70.7 yuan (down 2.75%), trend is bearish, RSI 59, strong sell signal;
8. $HKEX (00388.HK)$ : Closed at 424.2 yuan (down 1.85%), hovering near the moving average, RSI 49 (neutral), direction unclear;
9. $CHINA MOBILE (00941.HK)$ : Closed at 78 yuan (down 2.26%), broke below MA10, RSI 26 (oversold), strong buy signal;
10. $WUXI BIO (02269.HK)$ : Closed at 35.86 yuan (down 3.08%), showing weak momentum, RSI 47, technical signal indicates buy.
Warrant Bull-Bear Review: Products performed impressively
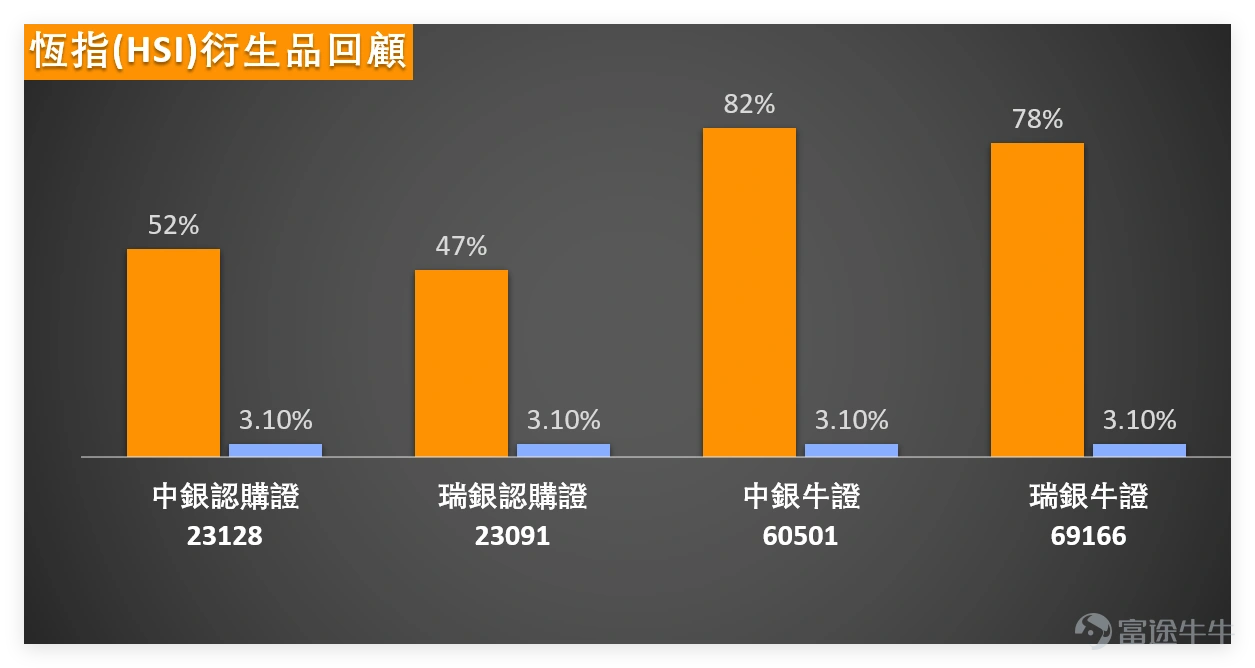
Reviewing the Hang Seng Index-related warrant bull-bear products recommended on January 27, they performed impressively over the past two trading days, tracking the Hang Seng Index's upward movement and achieving notable gains. Specific review as follows: $UB#HSI RC2809T.C (69166.HK)$ : 2-day increase of 78%, corresponding to a 3.10% rise in the Hang Seng Index over two days. $UB-HSI @EC2605B.C (23091.HK)$ : 2-day increase of 47%, corresponding to a 3.10% rise in the Hang Seng Index over two days. $BI-HSI @EC2605B.C (23128.HK)$ : 2-day increase of 52%, corresponding to a 3.10% rise in the Hang Seng Index over two days. $BI#HSI RC2809Q.C (60501.HK)$ : 2-day increase of 82%, corresponding to a 3.10% rise in the Hang Seng Index over two days.
On February 2, the Hong Kong stock market experienced widespread adjustments, $Hang Seng Index (800000.HK)$ Closing at 26,775.57 points for the day, down 2.23% in a single day, with a trading volume of 347.886 billion yuan and a 5-day volatility reaching 5.8%. In terms of indicators, the Hang Seng Index RSI is 50, in the neutral zone; the overall technical indicator summary signal is neutral, with a signal strength of 8; multiple moving averages show buy signals, but several oscillation indicators remain neutral, leaving the overall direction unclear. From a support and resistance perspective, short-term support levels for the Hang Seng Index are 26,180 points and 25,730 points, with resistance levels at 27,487 points and 27,891 points, with subsequent focus recommended on the support level near 26,180 points. In terms of individual stock performance, the top ten major blue chips closed lower across the board, with declines ranging from 1.01% to 3.49%. Among them, technology stocks (Alibaba, Meituan) and financial stocks (HSBC, Ping An) showed relatively significant adjustments. Technically, some individual stocks entered the oversold region, while others remained in a volatile pattern, showing notable divergence. Investors can pay close attention to how indicator signals align with support and resistance levels: 1. $TENCENT (00700.HK)$ : Closing at 598.5 HKD (down 1.24%), bearish alignment, RSI 40 (neutral), short-term suppressed by the moving average; 2. $AIA (01299.HK)$ : Closing at 89.05 HKD (down 1.44%), range-bound fluctuation, RSI 63 (approaching overbought)...
Reminder: Warrants and bull/bear products have leverage properties, with large fluctuations in gains and losses. Previous profits do not represent future performance. Investors should operate based on their own risk tolerance and proceed within their means.
Selected Warrant Products:
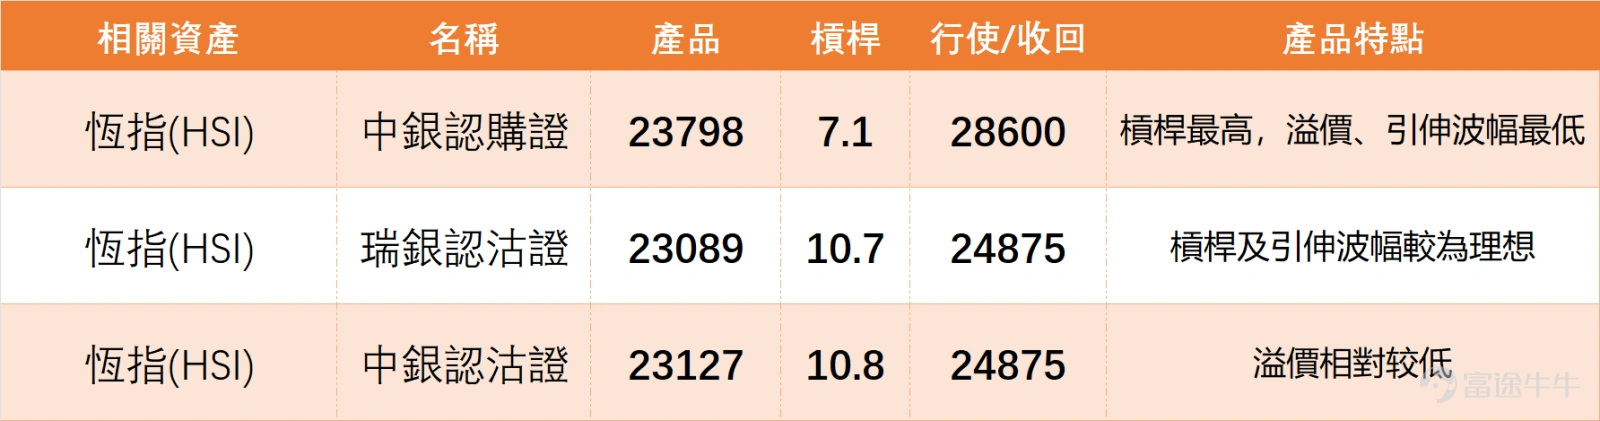
Based on the Hang Seng Index trend and technical signals, two superior warrant products with relatively controllable risks are selected. Key focus areas include premium, leverage, and implied volatility, for technical reference only:
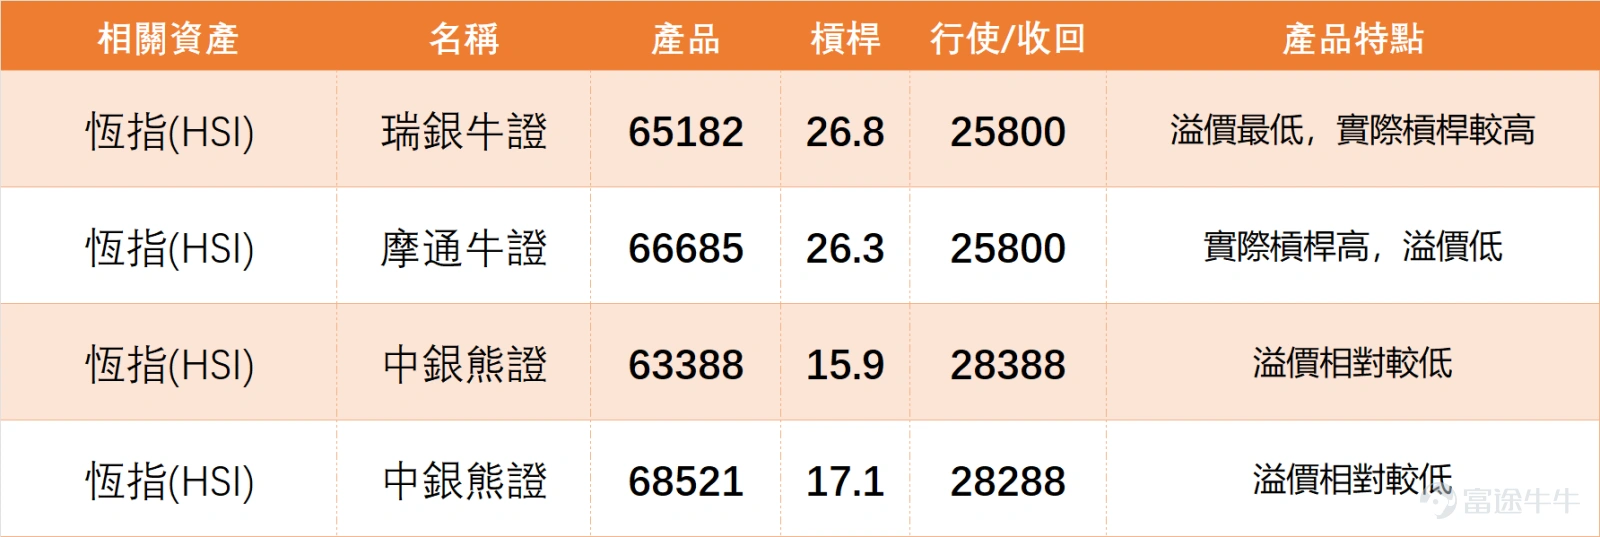
1. $BI-HSI @EC2609A.C (23798.HK)$Core feature: Leverage of 7.1 times, the highest among currently recommended products, while premium and implied volatility are at the lowest levels, offering excellent cost-performance. Strike price: 28,600 points. Suitable for investors optimistic about a short-term rebound in the Hang Seng Index who can tolerate appropriate leverage risk.
2. $UB#HSI RC2811Z.C (65182.HK)$Core feature: Lowest premium, actual leverage as high as 26.8 times, better cost-performance than similar products, recovery price: 25,800 points. Suitable for investors confident in a short-term stabilization and rebound of the Hang Seng Index and experienced in derivatives trading.
On February 2, the Hong Kong stock market experienced widespread adjustments, $Hang Seng Index (800000.HK)$ Closing at 26,775.57 points for the day, down 2.23% in a single day, with a trading volume of 347.886 billion yuan and a 5-day volatility reaching 5.8%. In terms of indicators, the Hang Seng Index RSI is 50, in the neutral zone; the overall technical indicator summary signal is neutral, with a signal strength of 8; multiple moving averages show buy signals, but several oscillation indicators remain neutral, leaving the overall direction unclear. From a support and resistance perspective, short-term support levels for the Hang Seng Index are 26,180 points and 25,730 points, with resistance levels at 27,487 points and 27,891 points, with subsequent focus recommended on the support level near 26,180 points. In terms of individual stock performance, the top ten major blue chips closed lower across the board, with declines ranging from 1.01% to 3.49%. Among them, technology stocks (Alibaba, Meituan) and financial stocks (HSBC, Ping An) showed relatively significant adjustments. Technically, some individual stocks entered the oversold region, while others remained in a volatile pattern, showing notable divergence. Investors can pay close attention to how indicator signals align with support and resistance levels: 1. $TENCENT (00700.HK)$ : Closing at 598.5 HKD (down 1.24%), bearish alignment, RSI 40 (neutral), short-term suppressed by the moving average; 2. $AIA (01299.HK)$ : Closing at 89.05 HKD (down 1.44%), range-bound fluctuation, RSI 63 (approaching overbought)...
The Hang Seng Index is adjusting; do you think it will continue to fluctuate or rebound in the short term? A. Continue to fluctuate. B. Short-term rebound. C. Uncertain.
Come to the comment section and share your thoughts! Want to see more analysis? Remember to follow 'HK Stock Warrants Jenny' for daily updates!
Disclaimer: This article does not constitute any investment advice.
This article is for reference only and does not constitute any investment advice. The market data, opinions, and analysis contained herein may change at any time without prior notice. We are not responsible for any loss or damage caused by reliance on the information in this article. Technical analysis only shows whether certain technical conditions are met; a comprehensive assessment of asset performance should be conducted using additional data. Decisions to trade should not be based solely on this article. Please note that past performance is not indicative of future results.
#HongKongStocks #HangSengIndex #RealTimeAnalysis #WarrantsSelection #WarrantsStrategy #DerivativesHedging #HongKongWarrantsJenny #HongKongBlueChips #TechnicalAnalysis #HangSengIndexTechnicalAnalysis
Risk Disclaimer: The above content only represents the author's view. It does not represent any position or investment advice of Futu. Futu makes no representation or warranty.Read more
Thumbs Up
5
286K Views
Report
Comment (1)
Write a Comment...
1
5