
How to view the post-holiday market trend in Hong Kong stocks?
Short-term Analysis of Tencent: AI Red Packet Ignites Enthusiasm, Key Technical Levels Face Crucial Test
$TENCENT (00700.HK)$ Recently, tech giant Tencent (00700.HK) has been engaged in an intense battle around the HKD 600 mark. On one hand, the company is aggressively promoting its AI product 'Yuanbao' with a RMB 1 billion Lunar New Year red packet campaign, showcasing its determination to capture traffic entry points in the AI era. On the other hand, the stock price failed to maintain its pre-Lunar New Year strength, experiencing continued pressure since late January and even briefly breaking below the psychological threshold of HKD 600 on February 2, testing long-term platform support at the bottom. This subtle situation of 'positive fundamentals but weak technicals' forms the core background for analyzing Tencent's short-term price movement.
I. Technical Analysis: The Struggle Between Key Platform Support and Oversold Signals
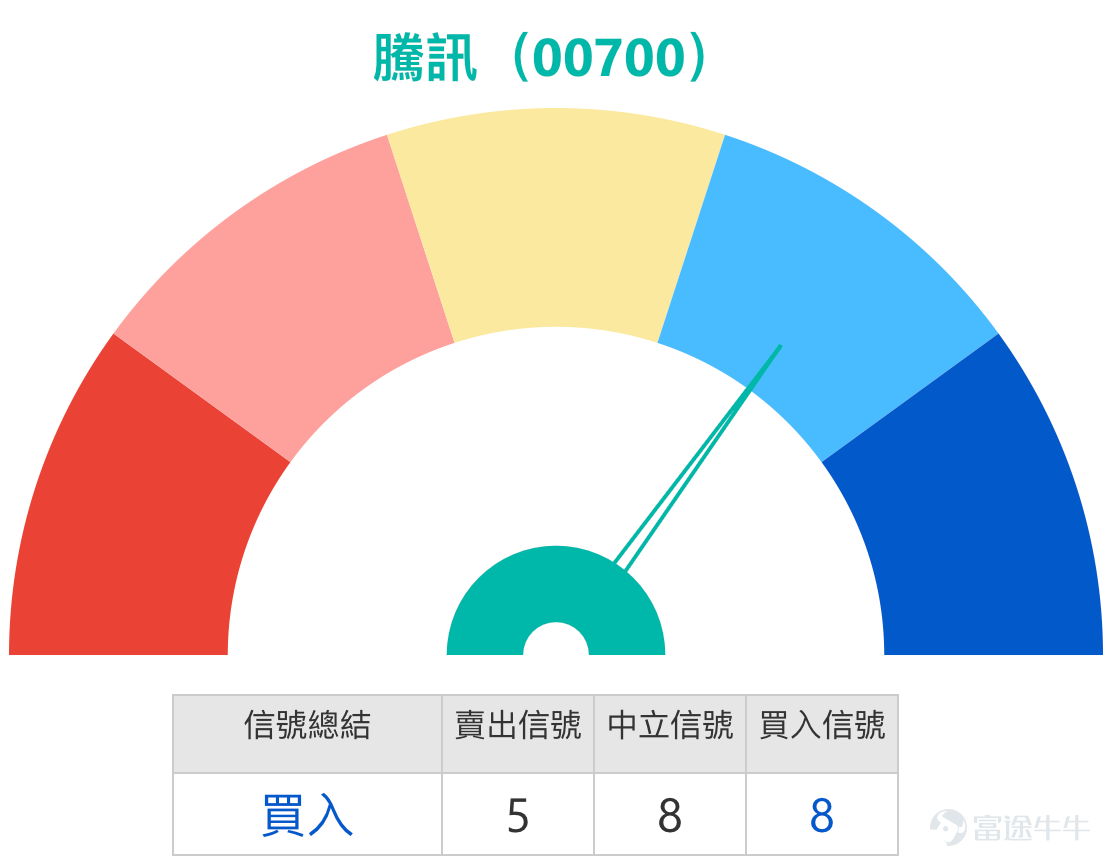
From the technical chart perspective, Tencent’s stock price is at a critical decision point. Recently, the share price has retreated significantly, fully filling the previous upward gap and retesting the important platform bottom that has formed over the past four months, located near HKD 595. The weakening price has put the short-term trend under scrutiny, with multiple moving averages forming overhead resistance. Overall technical signals suggest a 'sell'.
However, several oscillation indicators are showing strong oversold conditions along with potential rebound signals, which is a key highlight in the current market. The 14-day Relative Strength Index (RSI) has dropped to 43, indicating a clear oversold region. The Williams %R indicator also shows the stock is in oversold territory and issuing a buy signal. This contradiction in technical signals reflects the coexistence of caution due to 'price drops with increasing volume' and bargain-hunting sentiment among investors. As pointed out in the January 22 episode of [Hong Kong Stock Podcast], although short-term technical signals are slightly positive, suggesting a potential technical rebound, investors still need to observe whether the stock can stabilize at key support levels. In summary, the current technical picture presents a pattern where 'the short-term trend is pressured by moving averages, but demand for a rebound is accumulating after a deep correction.' January 22nd [Hong Kong Stock Podcast] - Hang Seng Index, Tencent, Li Auto, Alibaba, Pop Mart, China Unicom
2. Key Support and Resistance: Defining the Core Battlefield for Bull-Bear Tussle
After the stock price falls to key levels, clear support and resistance are crucial for determining short-term direction.
* On the upside resistance, reclaiming HKD 614 is the first step in reversing the short-term weakness. Stronger resistance lies around HKD 630, which marks the upper boundary of the previous consolidation range and is an important observation point for judging whether the downtrend will reverse.
* On the downside support, the first line of defense recently is at HKD 582. According to [HK Stocks Podcast] analysis, this level is near the lower Bollinger Band on the daily chart, providing technical support significance. If this position breaks, market focus will quickly shift to the more decisive support level at HKD 566.
![$TENCENT (00700.HK)$ Recently, tech giant Tencent (00700.HK) has been engaged in an intense battle around the HKD 600 mark. On one hand, the company is aggressively promoting its AI product 'Yuanbao' with a RMB 1 billion Lunar New Year red packet campaign, showcasing its determination to capture traffic entry points in the AI era. On the other hand, the stock price failed to maintain its pre-Lunar New Year strength, experiencing continued pressure since late January and even briefly breaking below the psychological threshold of HKD 600 on February 2, testing long-term platform support at the bottom. This subtle situation of 'positive fundamentals but weak technicals' forms the core background for analyzing Tencent's short-term price movement. I. Technical Analysis: The Struggle Between Key Platform Support and Oversold Signals From the technical chart perspective, Tencent’s stock price is at a critical decision point. Recently, the share price has retreated significantly, fully filling the previous upward gap and retesting the important platform bottom that has formed over the past four months, located near HKD 595. The weakening price has put the short-term trend under scrutiny, with multiple moving averages forming overhead resistance. Overall technical signals suggest a 'sell'. However, several oscillation indicators are showing strong oversold conditions along with potential rebound signals, which is a key highlight in the current market. The 14-day Relative Strength Index (RSI) has dropped to 43, indicating a clear oversold region. The Williams %R indicator also shows the stock is in oversold territory and issuing a buy signal. This contradiction in technical signals reflects the coexistence of caution due to 'price drops with increasing volume' and bargain-hunting sentiment among investors. As pointed out in the January 22 episode of [Hong Kong Stock Podcast], although short-term technical signals are slightly positive, suggesting a potential technical rebound, investors still need to observe whether the stock can stabilize at key support levels. In summary, the current technical picture presents a pattern where 'the short-term trend is pressured by moving averages, but demand for a rebound is accumulating after a deep correction.'](https://nnqimage.futunn.com/sns_client_feed/1162342/20260202/web-1770015092686-fWetJ115Ek.png/big?area=1&is_public=true&imageMogr2/ignore-error/1/format/webp)
3. Market Dynamics Integration: AI Strategy Push and Institutional Fund Flows
The core factor currently affecting Tencent's stock price is whether its heavy investment in AI strategy can win market confidence amidst macroeconomic and industry pressures.
The most direct market catalyst is Tencent's 'Red Packet Campaign' launched during the 2026 Spring Festival. On February 1, the company officially kicked off a HKD 1 billion Spring Festival red packet campaign for its AI assistant 'Yuanbao,' aiming to promote its AI applications on a large scale through social engagement and cash incentives. Following the launch, 'Yuanbao' quickly topped the Apple App Store free charts, showing strong user attraction. According to CITIC Securities, the red packet campaign, with its social scenarios and strong incentive mechanisms, is expected to significantly increase 'Yuanbao's' user reach and usage frequency, accelerating AI product penetration. Citi views this red packet battle as an 'important validation window for China’s AI assistants to become mainstream applications,' with its success or failure pivotal for gaining an edge in future AI ecosystem competition.
Contrasting with the heated AI marketing is the continuous adjustment of the stock price and some cautious investor sentiment. According to JPMorgan’s observations, as the stock price tests the HKD 600 level, the warrant market has shown characteristics of 'buying on dips,' where bullish positions (longs) have recorded noticeable net inflows while bearish positions (shorts) have seen outflows. This divergence in capital flows reflects that some investors believe the current downtrend is nearing its end and are beginning to make early-stage investments. However, as Simon, host of the January 22 [HK Stocks Podcast], reminded, despite the potential for technical rebounds, vigilance remains necessary when significant volume accompanies price drops; waiting patiently for stabilization signals is the more prudent strategy.
IV. Warrants and Bull/Bear Certificates: Review, Term Analysis, and Strategy Selection
1. Recent Product Performance Review
Reviewing the several bearish warrant products mentioned on January 29, their performance over the following two days serves as a classic example of derivatives amplifying risk hedging or directional gains in trending markets. During these two days, Tencent's stock fell by 3.86%, while related bearish derivatives delivered returns far exceeding the stock’s decline: Societe Generale Bear Certificate (55685) $SG#TENCTRP2812J.P (55685.HK)$ surged 78%, UBS Group Bear Certificate (55636) rose 70%, and two put warrants (UBS Put Warrant 21340, Bank of China Put Warrant 24406) also gained 58% and 43%, respectively.
![$TENCENT (00700.HK)$ Recently, tech giant Tencent (00700.HK) has been engaged in an intense battle around the HKD 600 mark. On one hand, the company is aggressively promoting its AI product 'Yuanbao' with a RMB 1 billion Lunar New Year red packet campaign, showcasing its determination to capture traffic entry points in the AI era. On the other hand, the stock price failed to maintain its pre-Lunar New Year strength, experiencing continued pressure since late January and even briefly breaking below the psychological threshold of HKD 600 on February 2, testing long-term platform support at the bottom. This subtle situation of 'positive fundamentals but weak technicals' forms the core background for analyzing Tencent's short-term price movement. I. Technical Analysis: The Struggle Between Key Platform Support and Oversold Signals From the technical chart perspective, Tencent’s stock price is at a critical decision point. Recently, the share price has retreated significantly, fully filling the previous upward gap and retesting the important platform bottom that has formed over the past four months, located near HKD 595. The weakening price has put the short-term trend under scrutiny, with multiple moving averages forming overhead resistance. Overall technical signals suggest a 'sell'. However, several oscillation indicators are showing strong oversold conditions along with potential rebound signals, which is a key highlight in the current market. The 14-day Relative Strength Index (RSI) has dropped to 43, indicating a clear oversold region. The Williams %R indicator also shows the stock is in oversold territory and issuing a buy signal. This contradiction in technical signals reflects the coexistence of caution due to 'price drops with increasing volume' and bargain-hunting sentiment among investors. As pointed out in the January 22 episode of [Hong Kong Stock Podcast], although short-term technical signals are slightly positive, suggesting a potential technical rebound, investors still need to observe whether the stock can stabilize at key support levels. In summary, the current technical picture presents a pattern where 'the short-term trend is pressured by moving averages, but demand for a rebound is accumulating after a deep correction.'](https://nnqimage.futunn.com/sns_client_feed/1162342/20260202/web-1770015189702-ctXwBeKLkW.png/big?area=1&is_public=true&imageMogr2/ignore-error/1/format/webp)
2. In-depth correlation analysis of selected product terms
When selecting warrant products, it is essential to closely align their core terms with the key technical levels of the underlying stock. This forms the foundation for building an effective offensive and defensive strategy.
* Bullish choices (call warrants and bull certificates):
* HSBC Call Warrant (15275) and UBS Call Warrant (15002)$UBTENCT@EC2607A.C (15002.HK)$The exercise prices for both HSBC Call Warrant (15275) and UBS Call Warrant (15002) are set at HKD 622.72. This price is slightly above the first resistance level at HKD 614. This feature indicates that these instruments are designed for investors who believe the share price will stabilize, rebound, and effectively break through the resistance zone at HKD 614. With actual leverage of approximately 7x, they offer upward flexibility while maintaining risk control.
* Morin Bull Certificate (57476) and FABA Bull Certificate (63246)$BP#TENCTRC2606E.C (63246.HK)$The forced call levels for both Macquarie Bull Certificate (57476) and BNP Paribas Bull Certificate (63246) are set at HKD 576. This position is very close to the critical second support level at HKD 566. This design provides a clear risk boundary, aiming to capitalize on potential rebounds near this strong support level using up to 21x actual leverage. However, it also implies that if the share price falls sharply to breach the HKD 566 support, the products will face a high risk of being called back.
![$TENCENT (00700.HK)$ Recently, tech giant Tencent (00700.HK) has been engaged in an intense battle around the HKD 600 mark. On one hand, the company is aggressively promoting its AI product 'Yuanbao' with a RMB 1 billion Lunar New Year red packet campaign, showcasing its determination to capture traffic entry points in the AI era. On the other hand, the stock price failed to maintain its pre-Lunar New Year strength, experiencing continued pressure since late January and even briefly breaking below the psychological threshold of HKD 600 on February 2, testing long-term platform support at the bottom. This subtle situation of 'positive fundamentals but weak technicals' forms the core background for analyzing Tencent's short-term price movement. I. Technical Analysis: The Struggle Between Key Platform Support and Oversold Signals From the technical chart perspective, Tencent’s stock price is at a critical decision point. Recently, the share price has retreated significantly, fully filling the previous upward gap and retesting the important platform bottom that has formed over the past four months, located near HKD 595. The weakening price has put the short-term trend under scrutiny, with multiple moving averages forming overhead resistance. Overall technical signals suggest a 'sell'. However, several oscillation indicators are showing strong oversold conditions along with potential rebound signals, which is a key highlight in the current market. The 14-day Relative Strength Index (RSI) has dropped to 43, indicating a clear oversold region. The Williams %R indicator also shows the stock is in oversold territory and issuing a buy signal. This contradiction in technical signals reflects the coexistence of caution due to 'price drops with increasing volume' and bargain-hunting sentiment among investors. As pointed out in the January 22 episode of [Hong Kong Stock Podcast], although short-term technical signals are slightly positive, suggesting a potential technical rebound, investors still need to observe whether the stock can stabilize at key support levels. In summary, the current technical picture presents a pattern where 'the short-term trend is pressured by moving averages, but demand for a rebound is accumulating after a deep correction.'](https://nnqimage.futunn.com/sns_client_feed/1162342/20260202/web-1770015240440-X4j0Y3gOvB.jpeg/big?area=1&is_public=true&imageMogr2/ignore-error/1/format/webp)
* Bearish/hedging options (put warrants and bear certificates):
* UBS Bear Certificate (69628) and Bank of ** Certificate (60959)$BI#TENCTRP2812A.P (60959.HK)$The forced call levels for UBS Bear Certificate (69628) and Bank of ** Certificate (60959) are set at HKD 620 and HKD 636.8, respectively. The forced call level at HKD 620 for the UBS Bear Certificate is just above the first resistance level of HKD 614. This means these are short-term tools prepared for investors predicting that the share price will fail to rebound and instead reverse downward below the resistance level. With over 27x actual leverage, they are highly sensitive to downward volatility.
* Bank of China Put Warrant (23122)$BITENCT@EP2606A.P (23122.HK)$Both Bank of China Put Warrant (23122) and UBS Put Warrant (21984) have exercise prices set at HKD 499.8. These exercise prices are significantly below all key support levels. This indicates that these warrants are not designed for betting on minor pullbacks but rather serve as deep out-of-the-money hedging tools for investors extremely bearish about the future market and anticipating potentially severe declines. Their high-leverage nature implies coexistence of high risk and high potential reward.
![$TENCENT (00700.HK)$ Recently, tech giant Tencent (00700.HK) has been engaged in an intense battle around the HKD 600 mark. On one hand, the company is aggressively promoting its AI product 'Yuanbao' with a RMB 1 billion Lunar New Year red packet campaign, showcasing its determination to capture traffic entry points in the AI era. On the other hand, the stock price failed to maintain its pre-Lunar New Year strength, experiencing continued pressure since late January and even briefly breaking below the psychological threshold of HKD 600 on February 2, testing long-term platform support at the bottom. This subtle situation of 'positive fundamentals but weak technicals' forms the core background for analyzing Tencent's short-term price movement. I. Technical Analysis: The Struggle Between Key Platform Support and Oversold Signals From the technical chart perspective, Tencent’s stock price is at a critical decision point. Recently, the share price has retreated significantly, fully filling the previous upward gap and retesting the important platform bottom that has formed over the past four months, located near HKD 595. The weakening price has put the short-term trend under scrutiny, with multiple moving averages forming overhead resistance. Overall technical signals suggest a 'sell'. However, several oscillation indicators are showing strong oversold conditions along with potential rebound signals, which is a key highlight in the current market. The 14-day Relative Strength Index (RSI) has dropped to 43, indicating a clear oversold region. The Williams %R indicator also shows the stock is in oversold territory and issuing a buy signal. This contradiction in technical signals reflects the coexistence of caution due to 'price drops with increasing volume' and bargain-hunting sentiment among investors. As pointed out in the January 22 episode of [Hong Kong Stock Podcast], although short-term technical signals are slightly positive, suggesting a potential technical rebound, investors still need to observe whether the stock can stabilize at key support levels. In summary, the current technical picture presents a pattern where 'the short-term trend is pressured by moving averages, but demand for a rebound is accumulating after a deep correction.'](https://nnqimage.futunn.com/sns_client_feed/1162342/20260202/web-1770015235086-RcuinwKVVI.jpeg/big?area=1&is_public=true&imageMogr2/ignore-error/1/format/webp)
Interactive Segment: What’s your take on the HKD 600 mark?
On the technical chart, Tencent's stock price is oscillating between the psychological level of 600 yuan and the technical support at 582 yuan. On one side is the grand narrative of the company rolling out a 1 billion yuan red packet and aggressively pushing its AI ecosystem, while on the other is the technical reality of a weak stock price testing long-term platform support.
Which direction do you think Tencent will break out to next?
A. Dramatic Rebound: Believe in the AI story and oversold signals, expecting a bounce off the support level.
B. Continue to Bottom Out: Believe the trend hasn’t changed and it might first test the 582 or even 566 yuan support levels.
C. Range-bound Fluctuation: Expect significant divergence between bulls and bears with ongoing contention around the 600 yuan mark.
Is your choice A, B, or C? Come share your intuition in the comments section and see which side market sentiment leans toward!
Final friendly reminder: Warrants and callable bull/bear contracts (CBBCs) are complex leveraged derivative investment products with expiration dates. Their prices can go up or down, and investors may lose their entire principal. Before investing, it’s essential to understand product characteristics, including the forced recall mechanism of CBBCs, as well as time decay and implied volatility risks for warrants. If you have any questions about product terms, seek professional advice. For more in-depth daily analysis of Hong Kong stocks and derivatives, follow “Jenny’s HK Stock Warrants.”
#Tencent Holdings #00700 #Technical Analysis #AI Applications #Warrants #Bull and Bear Certificates #Support and Resistance Levels #Hong Kong Stock Podcast #Chinese New Year Red Envelopes #Short-term Speculation
Risk Disclaimer: The above content only represents the author's view. It does not represent any position or investment advice of Futu. Futu makes no representation or warranty.Read more

Comments
to post a comment
2
10