
How to view the post-holiday market trend in Hong Kong stocks?
Standing above the moving average support, facing high-level resistance: A visual analysis of Pop Mart’s short-term critical battle
$KUAISHOU-W (01024.HK)$ Recently, the stock price movement of Pop Mart (09992.HK) has clearly outlined a typical 'rebound-consolidation-reassessment' technical pattern. After completing a strong rebound in mid-to-late January, driven by positive signals such as management buybacks, the stock price is currently undergoing lateral oscillation around the high levels above HKD 220. As of the close on January 30th, the share price was at HKD 223.6, with intense market battles between bulls and bears reflecting uncertainty in the short-term direction. The key concern now is whether the stock price can break through the upper resistance with new fundamental momentum or retreat to test lower support due to short-term overbought conditions.
I. Technical Analysis: Momentum Shifts within Consolidation Patterns
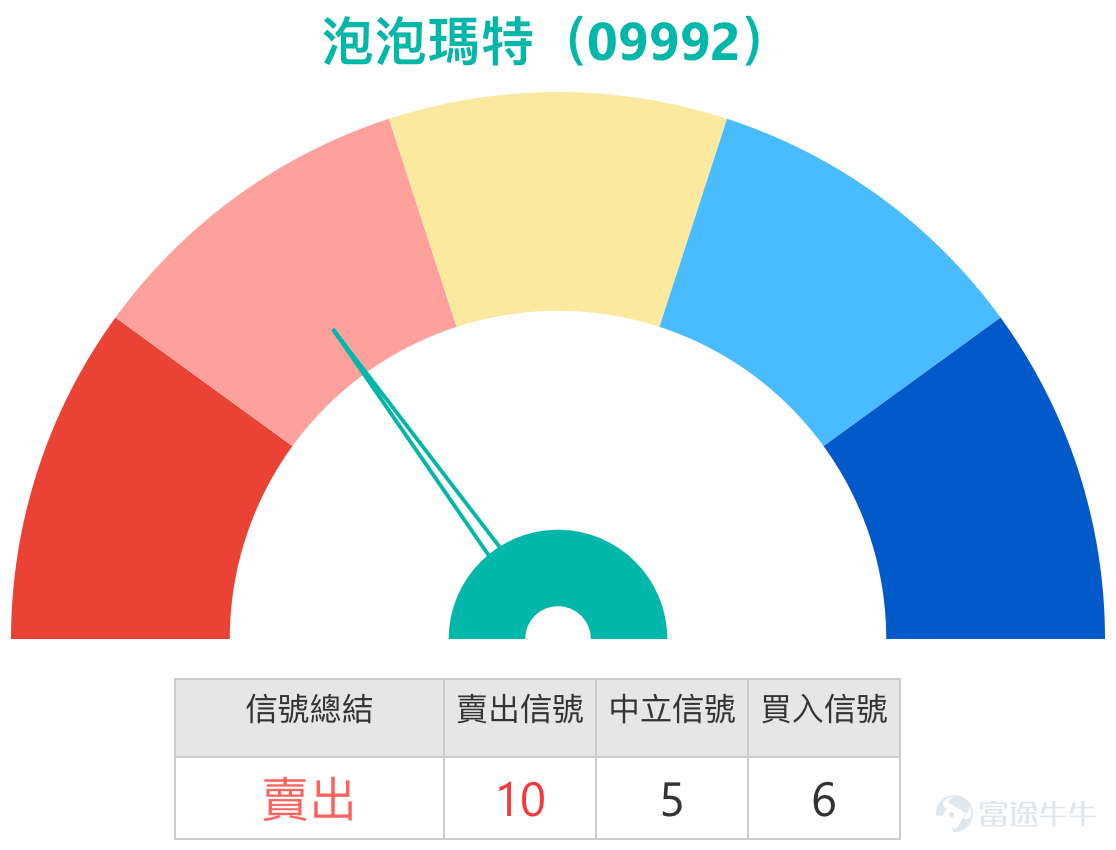
Observing the short-term technical charts, after continuous gains, Pop Mart has clearly entered a phase of high-level consolidation. The latest technical signal indicates a 'strong sell,' with multiple moving averages issuing the same signal, showing that buying momentum is weakening in the short term, with the market facing pressures from profit-taking and technical adjustments.
However, the analysis does not indicate complete pessimism. One positive phenomenon worth noting is that the stock price remains firmly above the 30-day (HKD 200.48) and 60-day (HKD 204.54) moving averages, providing important support for the medium-term trend. Currently, the 14-day Relative Strength Index (RSI) stands at 64, within the strong range but not yet in the extreme overbought zone, suggesting that although market sentiment is heated, there is still room for divergence. This comparison of technical indicators reveals a core market state: during the process of breaking through recent rebound highs, the stock price needs time and trading volume to digest short-term pressure, but the overall bullish structure remains intact, with consolidation viewed as a transitional period for momentum switching.
Key Support and Resistance: Clearly Defined Boundaries of the Trading Range
During periods when stock prices lack clear direction and move within a consolidation phase, well-defined key price levels become the core coordinates for delineating risk and opportunity.
* On the upside resistance, the primary test lies at CNY 239, a level that the stock price has repeatedly attempted but failed to break through effectively. If it can successfully stabilize above this price, the next target will point towards CNY 262, which is a critical resistance zone connecting previous highs, and breaking through this would carry significant implications.
* On the downside support, CNY 206 serves as the first important line of defense, close to the 10-day moving average and the previous trading platform. More notably, the crucial support at CNY 185 is worth watching. This level has been repeatedly validated as a strong technical support area and also marks the starting point of the January rebound, widely regarded by the market as the 'watershed' for the medium-term trend.

III. Market Dynamics Integration: Acceleration of Global Strategy and Institutional Perspective
The current stock price consolidation coincides with a window of positive fundamental developments for the company, creating a tug-of-war between short-term technicals and long-term narratives. The most eye-catching recent development is the company’s substantial leap in globalization. In late January, founder Wang Ning announced London as the European headquarters and plans to add 27 new stores across Europe. This strategic move not only opens up new growth opportunities but also signals the company’s ambition to expand its global footprint, providing a long-term value anchor for the stock price.
Looking back at the starting point of this rebound, the management's 'real money' share buyback was the first spark to ignite market confidence. According to commentary on the January 20 episode of [Bank of China Guest], the company conducted its first large-scale share repurchase in nearly two years, utilizing hundreds of millions of yuan. Niki, a director at Bank of China International, explicitly stated that this could be interpreted as a vote of confidence in the company’s future prospects, showing support for the stock price through concrete actions, directly boosting investor confidence in betting on a rebound.
Regarding the short-term rhythm of the stock price, two column programs provided deep insights from different perspectives. In the January 20 episode of [Bank of China Guest], Niki analyzed that although the stock price had rebounded from its lows, considering the overall Hong Kong stock market environment and the company’s positive signals, investors’ confidence in buying related products to bet on a rebound had increased. She emphasized that timing entry is crucial; if the probability of a rebound outweighs the likelihood of a decline, it may be a moment worth considering. Meanwhile, in the earlier January 22 episode of [Hong Kong Stock Podcast], host Simon provided a more technical and tool-focused analysis. He noted that after the stock price broke above CNY 205, investors set their sights on CNY 230. When selecting derivatives, he analyzed that call warrants with an exercise price of CNY 230 were scarce, whereas bull contracts with a stop-loss near CNY 170 still maintained a safe distance from the technical support level (around CNY 190) and offered moderate leverage, making them potentially advantageous in terms of contract selection. Combining the viewpoints of these two programs paints a complete short-term decision-making chain: First, assess market sentiment and timing ([Bank of China Guest]), then select the most appropriate tools based on specific price targets ([Hong Kong Stock Podcast]).
IV. Warrants and Bull/Bear Contracts: Review, Clause Analysis, and Core Knowledge
At stages where the market may face directional choices, warrants and bull/bear contracts provide investors with tools to deploy limited capital within specific price ranges. These products allow investors to participate in potential price movements of the underlying stock while capping maximum losses primarily within the initial investment amount.
1. Recent Product Performance Review
The performance of the bullish derivative products mentioned on January 27 over the following two days vividly illustrates the leverage effect of derivatives. During that time, Pop Mart's stock price rose by 6.94% over two days, while the gains of related derivative products were significantly amplified: UBS Group Call Warrant (23479).$UBPOMRT@EC2605A.C (23479.HK)$ Surged 37%, BOC Call Warrant (23339) $BIPOMRT@EC2605A.C (23339.HK)$ Rose 33%, two bull contracts (HSBC Bull 57271, UBS Group Bull) also recorded gains of 31% and 32% respectively.

2. In-depth correlation analysis of selected product terms
The key to selecting derivatives lies in precisely correlating the product’s core terms with the technical levels of the underlying stock to evaluate its risk-return characteristics.
* Bullish choices (call warrants and bull certificates):
* UBS Group Call Warrant (22315) $UBPOMRT@EC2604C.C (22315.HK)$ and BOC Call Warrant (22285) $BIPOMRT@EC2604B.C (22285.HK)$The exercise prices of these two products are both set at 260.12 yuan. This price is almost aligned with the second resistance level at 262 yuan. This indicates that they are aggressive tools designed for investors who strongly believe the stock price will break through the consolidation range and challenge the previous high region, offering approximately six times actual leverage for higher return potential.
* UBS Bull Certificate (59683)$UB#POMRTRC2608A.C (59683.HK)$With Bank of China Bull Certificate (61595)$BI#POMRTRC2609C.C (61595.HK)$The forced recovery prices of these two bull contracts are both set at 190 yuan. This price sits between the first support level at 206 yuan and the second support level at 185 yuan, but closer to the latter. This design provides a clear 'safety buffer' for bullish investors: as long as the stock price does not sharply retreat below the critical support line of 185 yuan, the product remains valid. These are suitable for investors who believe key supports hold firm and wish to use approximately five times leverage to participate in subsequent price movements.
* Bearish/hedging options (put warrants and bear certificates):
* UBS Bear Certificate (61609)$UB#POMRTRP2806A.P (61609.HK)$With Bank of ** Certificate (60705)$BI#POMRTRP2608A.P (60705.HK)$The forced recovery prices of these two bear contracts are set at 248 yuan and 246 yuan respectively. These positions are significantly above the first resistance level at 239 yuan. This means they are short-term tools prepared for investors predicting that the current rebound will not sustain, and that the stock price will reverse downward below the resistance level.
* Citigroup Put Warrant (21649)$CTPOMRT@EP2609A.P (21649.HK)$With BOC Put Warrants (15457)$BIPOMRT@EP2609A.P (15457.HK)$: The strike price of these two put warrants is 179.9 yuan. This strike price is already below the key second support level of 185 yuan. This indicates that they are not intended for speculating on minor pullbacks, but rather serve as hedging tools for investors expecting a possible deep market correction and retesting of lower levels.
Interactive Segment: Direction Decision
On the chart, the stock price is oscillating within a range bound by resistance at 239 yuan and support at 206 yuan. On one side is the company’s grand narrative of global expansion, while on the other is short-term technical pressure.
Which direction do you think Pop Mart will break out to next?
A. Breakout Upwards: Trust in the fundamentals and growth story, believing it can overcome the 239-yuan resistance.
B. Continue Consolidation: Believing that bullish and bearish forces are balanced, and the price will continue to fluctuate within the current range.
C. Downward Correction: Believing that technical consolidation is needed, possibly testing the 206-yuan support first.
Your choice is A, B, or C? Share your opinion in the comment section and let’s see where market sentiment is heading!
Disclaimer: This article does not constitute any investment advice.
This article is for reference only and does not constitute any investment advice. The market data, opinions, and analyses contained herein may change at any time without prior notice. We assume no responsibility for any loss or damage resulting from reliance on the information provided in this article. Technical analysis only indicates whether certain technical conditions are met. A comprehensive evaluation of asset performance should be conducted by integrating additional data. Trading decisions should not be made solely based on this article. Please note that past performance is not indicative of future results.
#Pop Mart #09992 #Technical Analysis #Trendy Toys #Warrants #Bull and Bear Certificates #Support and Resistance Levels #Hong Kong Stock Podcast #Bank of China Guest #Redemption Price Analysis
Risk Disclaimer: The above content only represents the author's view. It does not represent any position or investment advice of Futu. Futu makes no representation or warranty.Read more

Comment (1)
to post a comment
2
9