

How to view the post-holiday market trend in Hong Kong stocks?
[Warrant Perspective] The battle over the moving averages of the technology index has reached a deadlock; should investors focus on offense or defense in the short term?
January 30th,$Hang Seng TECH Index (800700.HK)$
The day closed at 5,718.18 points, down 2.10% in a single day, with a trading volume of 63.064 billion yuan. Trading activity was moderate, showing no obvious signs of significant increase or decrease in volume. From a technical perspective, the 5-day volatility of the tech index was 3.8%, with controllable fluctuations and a 55% probability of an upward movement, indicating an overall neutral pattern.
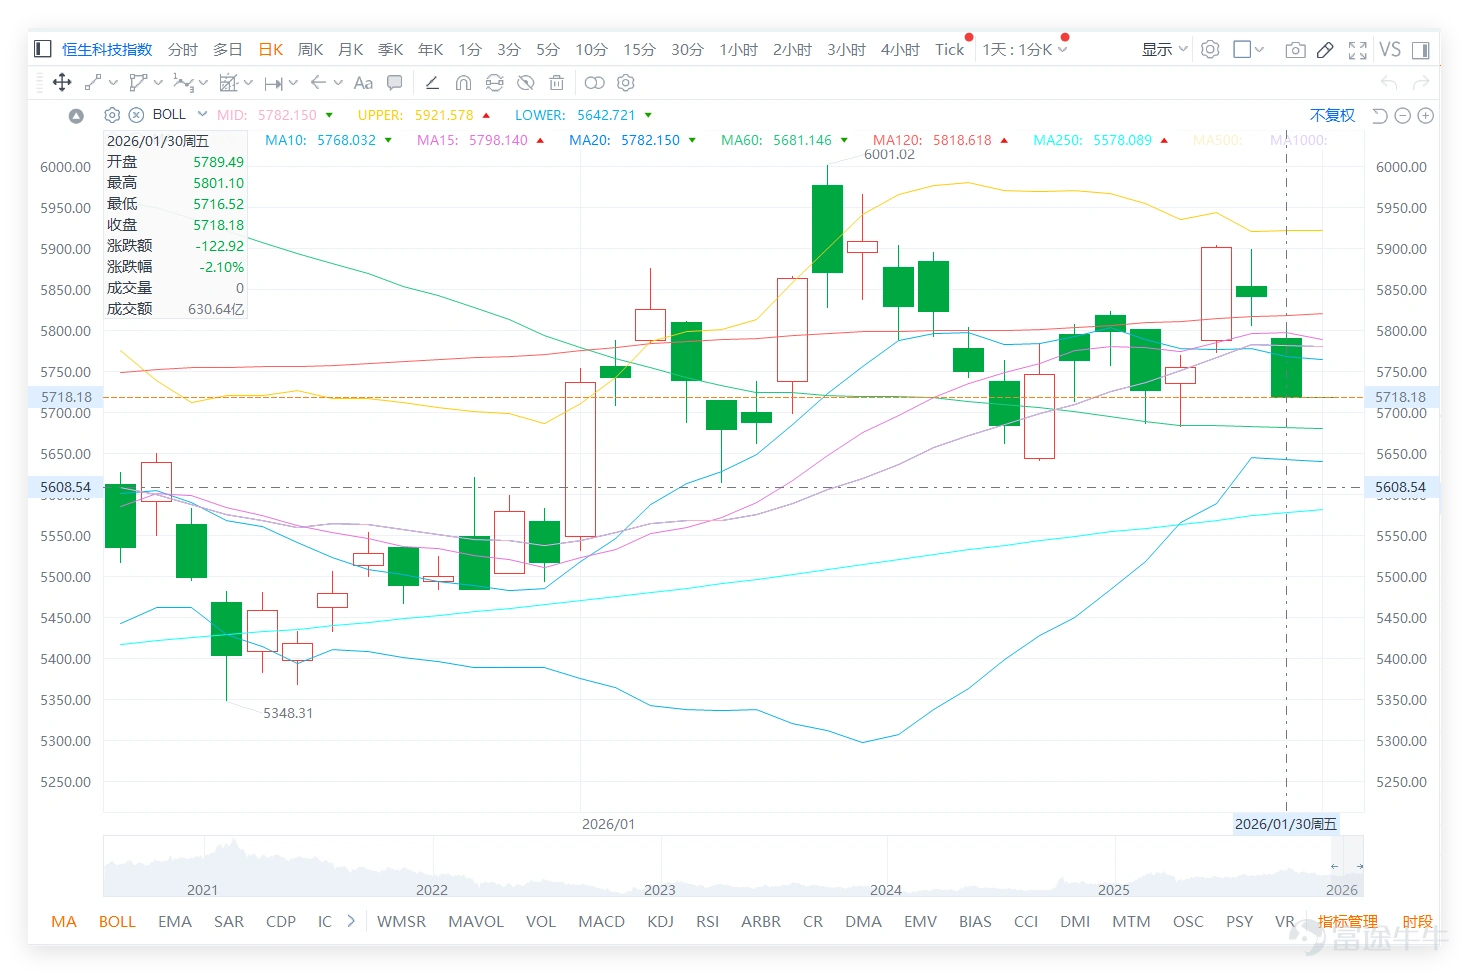
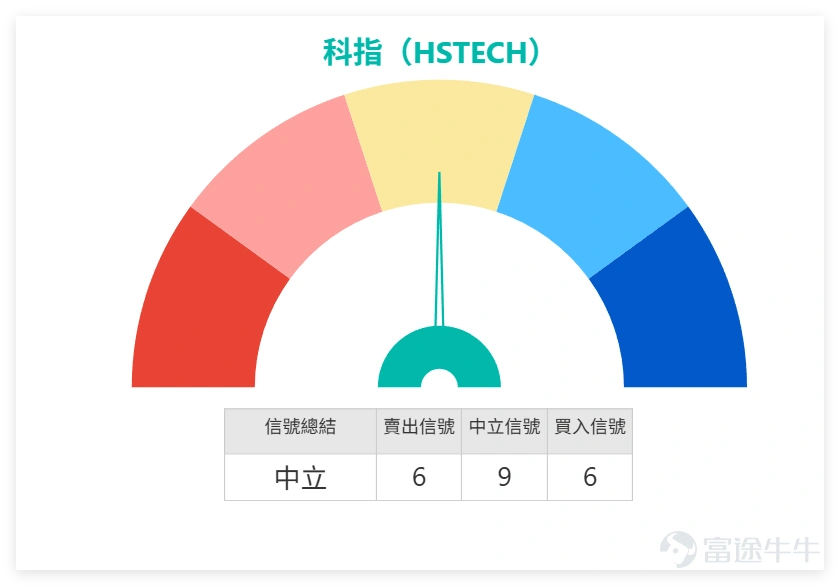
In terms of technical indicators, the RSI for the tech index is 52, which is within the neutral range, showing neither overbought nor oversold signals. The MACD indicates a sell signal, while multiple moving averages suggest a buy signal. Overall, oscillation indicators are leaning towards neutrality, with a signal strength of 9, reflecting that the current market is in a phase of tug-of-war between buyers and sellers, and the direction remains unclear.
Regarding support and resistance, the short-term support levels for the tech index are 5,560 points (Support 1) and 5,395 points (Support 2), while the resistance levels are at 5,876 points (Resistance 1) and 6,042 points (Resistance 2). On the previous day (the 30th), the closing price was below the 10-day moving average (5,768.03 points) but above the 30-day moving average (5,694.24 points). The short-term trend is constrained by the moving averages, necessitating attention to the strength of lower support levels.
On January 30, the technology and internet stock sector was generally under pressure, with many heavyweights recording declines, but individual stock technical trends showed divergence:
1. $TENCENT (00700.HK)$ : Closed at 606.0 yuan, down 2.57%. The stock price is almost in line with the 10-day moving average (606.15 yuan), slightly below the 30-day moving average (611.83 yuan). The technical indicator signal is 'Buy,' but the RSI is 49, which is in the neutral range. The trend has been relatively volatile, and the stock may consolidate near the moving averages in the short term; watch for whether it can hold above the 10-day line support.
2. $MEITUAN-W (03690.HK)$ : Closed at 97.2 yuan, down 1.42%. The stock price is already below major moving averages, showing a weaker short-term trend, but the RSI is 44, close to the oversold zone. Technical indicators show a 'Buy' signal, suggesting that the stock might be seeking technical support. Investors can pay attention to the strength of subsequent rebounds.
3. $BABA-W (09988.HK)$ : Closed at 169.2 yuan, down 2.37%. The technical indicator summary shows a 'Strong Sell' signal. Although the RSI is 62 and not in the overbought zone, selling pressure appears strong, and a weak short-term pattern is evident. Caution is advised regarding further downside risk.
4. $JD-SW (09618.HK)$ : Closed at 112.4 yuan, down 1.92%. The technical indicator also shows a 'Buy' signal, with an RSI of 46, close to the oversold zone. The trend is similar to Meituan's, where although weak in the short term, early signs of oversold conditions are emerging, potentially hinting at a rebound. Patience is required to confirm the signal.
5. $NTES-S (09999.HK)$ : Closed at 205.0 yuan, down 0.77%. It performed relatively well against the broader sector decline, with an RSI of 41, indicating more pronounced oversold signals. Technical indicators also suggest a 'Buy' signal, making it a relatively noteworthy stock in the tech sector. Monitor whether it approaches a short-term bottom.
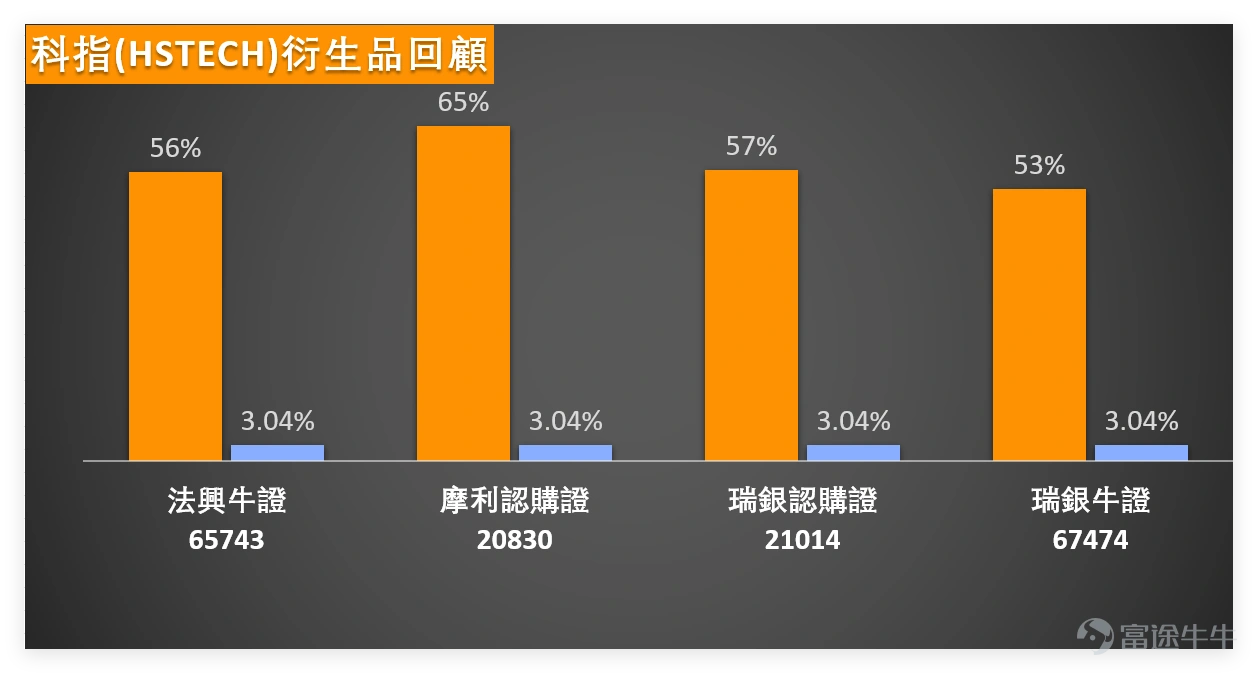
Review of Warrant Bull-Bear Products: Outstanding performance from prior recommendations
A review of the Hang Seng Tech Index-related warrant and bull certificate products recommended on January 26 shows overall impressive performance: $SG#HSTECRC2606A.C (65743.HK)$ : Increased by 56% within two days, corresponding to a 3.04% rise in the Hang Seng Tech Index. Following the underlying stock movement, the leverage advantage was demonstrated. $MSHSTEC@EC2603B.C (20830.HK)$ : Increased by 65% within two days, performing most prominently among peers during the same period. The premium was reasonable, and its upward momentum was strong. $UB#HSTECRC2609A.C (67474.HK)$ : Up 53% in two days, performing similarly to Societe Generale's bull certificates, also benefiting from the earlier rebound of the technology index; $UBHSTEC@EC2603A.C (21014.HK)$ : Up 57% in two days, showing strong upward momentum, delivering solid short-term returns for investors.
Friendly reminder: Warrants and bull/bear certificates are derivatives with leverage effects, which may lead to significant fluctuations in gains or losses. Although previous products have performed well, past performance does not guarantee future results. Investors should control their positions and proceed cautiously.
Warrant and Bull/Bear Product Selection:
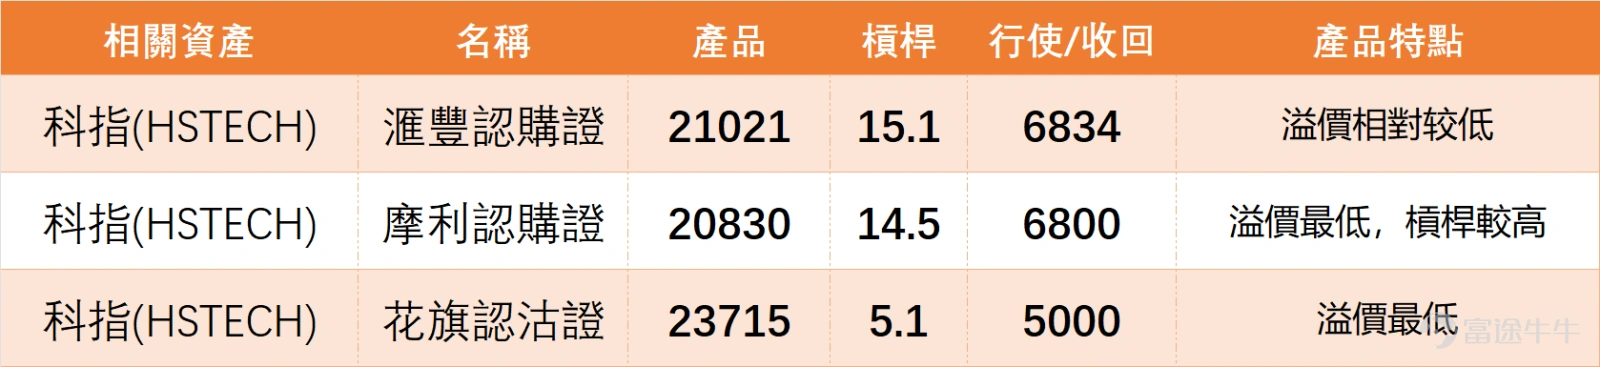
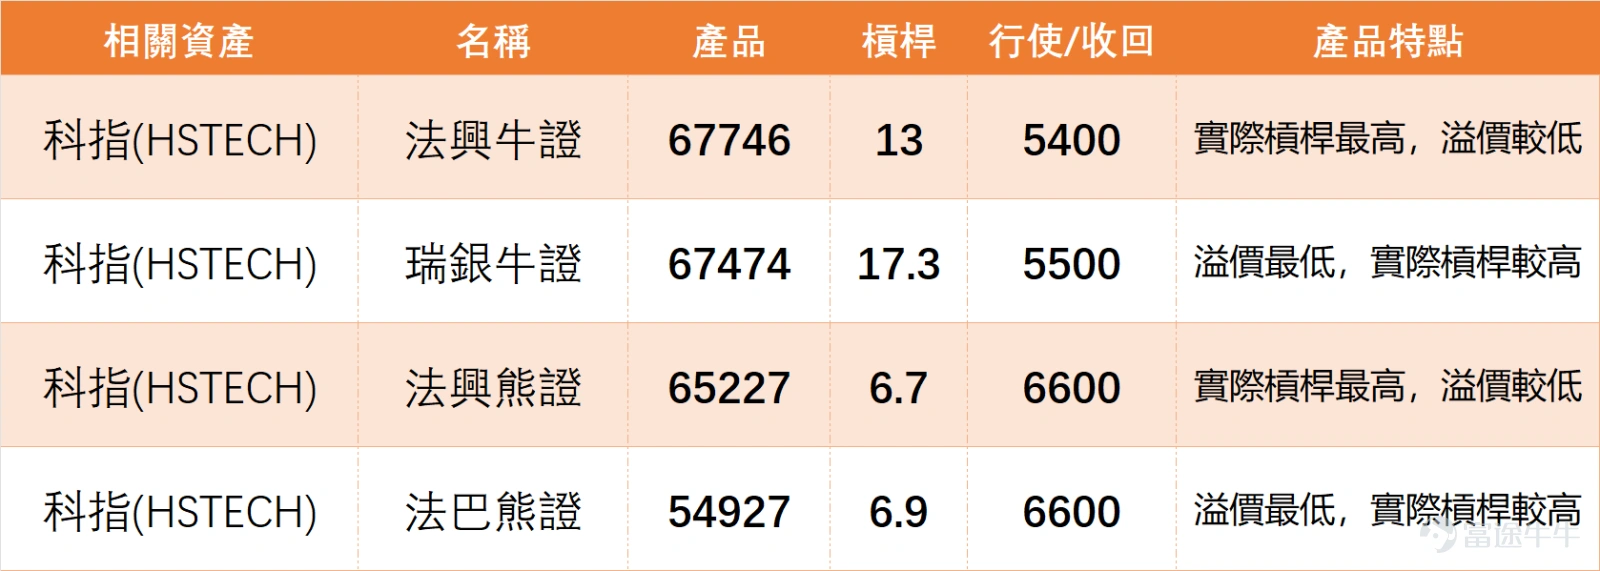
Based on the movement of the technology index and technical indicators, we have selected two technology index-related warrant and bull/bear products that offer relatively controllable risks and high cost-effectiveness, for investors' reference:
1. $SG#HSTECRC2606B.C (67746.HK)$ : Actual leverage of 13x, recovery price at 5400 points. The core feature is the highest actual leverage with relatively low premium, offering high sensitivity to the technology index’s movements. Suitable for investors expecting a short-term rebound in the technology index who are willing to bear some leverage risk.
2. $MSHSTEC@EC2603B.C (20830.HK)$ : Actual leverage of 14.5x, strike price at 6800 points. The core feature is the lowest premium and relatively high leverage, with outstanding upward momentum in previous periods. Suitable for investors optimistic about a mid-term rebound in the technology index who seek highly sensitive upward tracking.
Reminder again: Derivatives trading involves higher risks. Investors must fully understand product characteristics and choose based on their own risk tolerance; do not blindly follow.
Meituan and NetEase are showing signs of being oversold. Would you consider making a short-term move in related stocks or warrants?
A. Yes,试探性地分批轻仓布局 (Yes, test by gradually building light positions). B. No, wait for confirmation signals. C. Already positioned, holding and observing.
Come to the comment section and share your thoughts! Want to see more analysis? Remember to follow 'HK Stock Warrants Jenny' for daily updates!
Disclaimer: This article does not constitute any investment advice.
This article is for reference only and does not constitute any investment advice. The market data, opinions, and analysis contained herein may change at any time without prior notice. We are not responsible for any loss or damage caused by reliance on the information in this article. Technical analysis only shows whether certain technical conditions are met; a comprehensive assessment of asset performance should be conducted using additional data. Decisions to trade should not be based solely on this article. Please note that past performance is not indicative of future results.
#Hong Kong Stocks #Technology Index #Tech Stocks #Real-time Analysis #Warrants Selection #Warrant Strategies #Derivatives Hedging #HK Stock Warrants by Jenny #Tencent #Meituan #Alibaba #Technical Analysis
Risk Disclaimer: The above content only represents the author's view. It does not represent any position or investment advice of Futu. Futu makes no representation or warranty.Read more
Comment (1)
to post a comment