
[Warrant Perspective] HSI deadlock: stable volume vs conflicting indicators, how to break the deadlock?
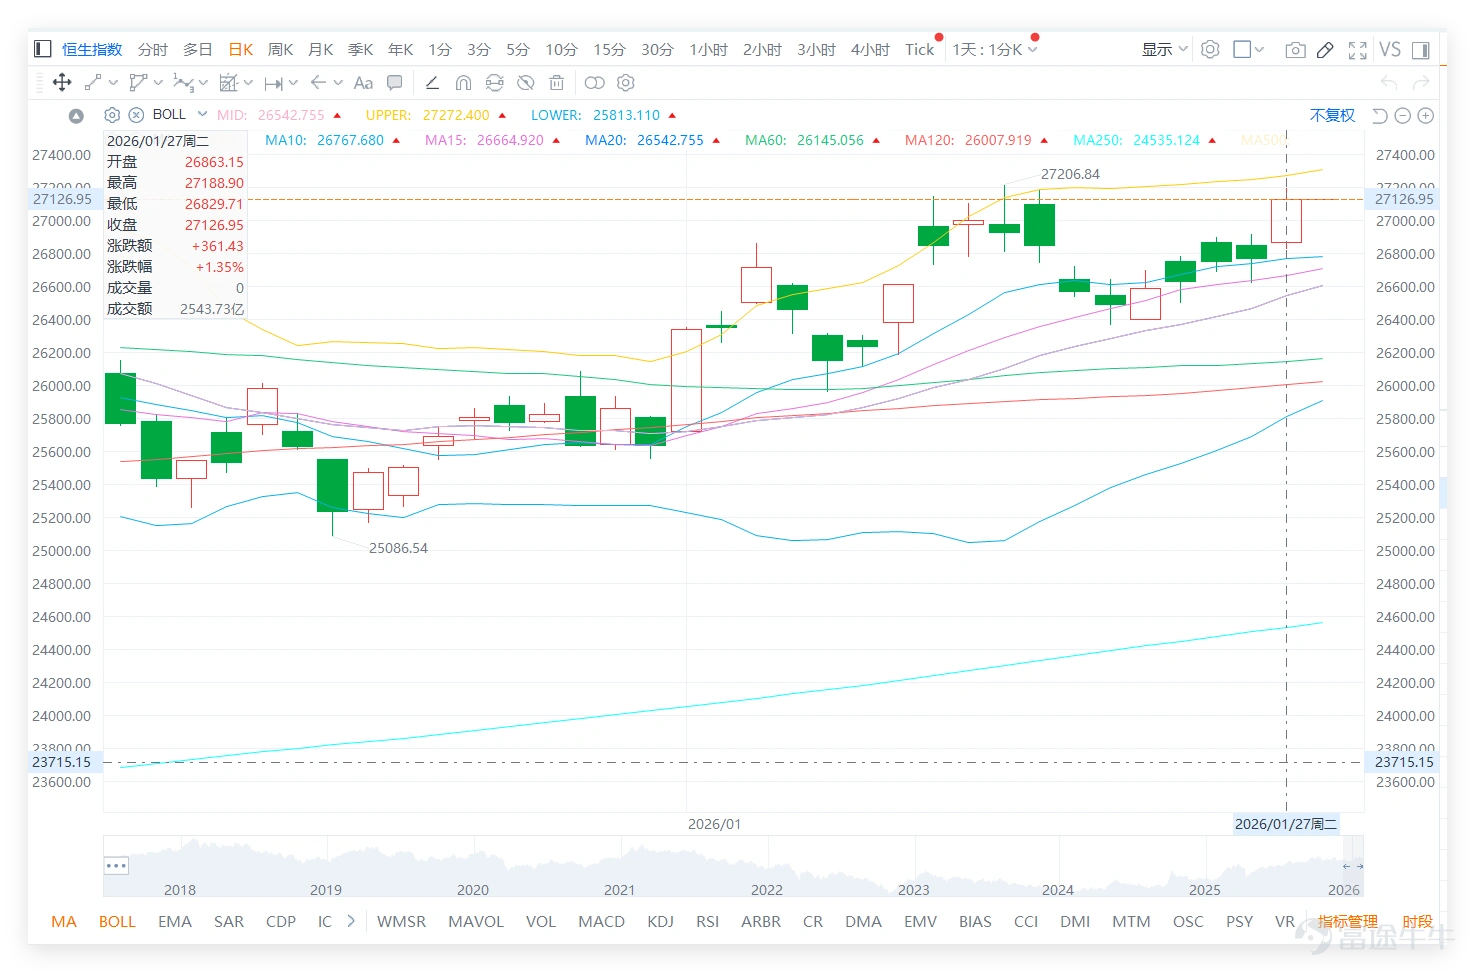
On January 27, $Hang Seng Index (800000.HK)$
The day closed at 27,126.95 points, up 1.35% in a single day, with a 5-day volatility of 2.9%. The trading volume was 254.373 billion yuan, and the trading activity remained stable.
In terms of technical indicators, buy signals were given by MACD, CCI, etc., and Bollinger Bands also showed a buy signal. However, the RSI is at 63, close to the overbought zone, while Williams %R and Stochastic Oscillator are in an overbought state, creating a tug-of-war between bullish and bearish signals.
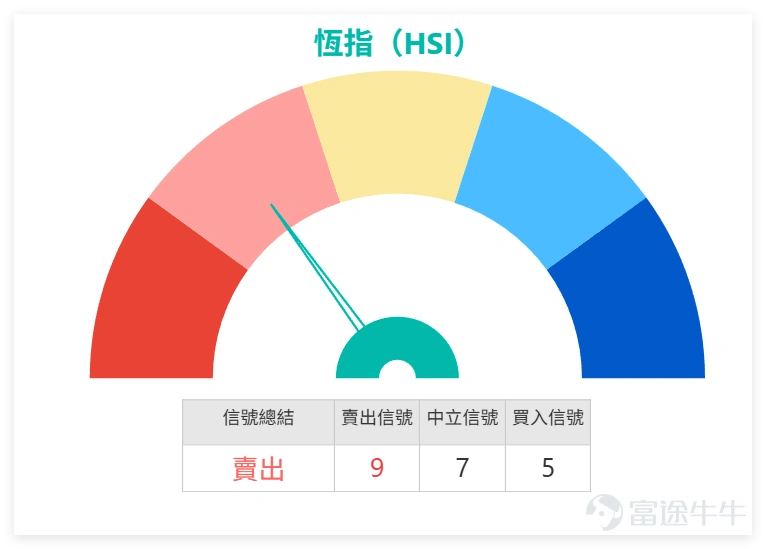
Support levels are seen at 26,546 points (primary) and 26,155 points (secondary), while resistance levels are focused on 27,411 points and 27,897 points. In the short term, it may fluctuate within this range.
On January 27, blue-chip stocks showed mixed performance, with clear divergence in technical signals, which can be observed across three main groups:
1. Strong buy signal stocks: $TENCENT (00700.HK)$ Closed at 607.00 yuan, up 1.25%. The stock price is above the MA10 (608.5 yuan) but below the MA30 (610.72 yuan). The RSI is 44, in the neutral zone, with a strong overall buy signal (strength 10), representing a potential recovery opportunity after a short-term correction. $MEITUAN-W (03690.HK)$ Slightly down 0.57% to 96.55 yuan, the stock price is below both MA10 and MA30, with an RSI of 40 indicating weakness. However, the technical signal remains a strong buy, suggesting there may be expectations of a rebound from oversold conditions. $CHINA MOBILE (00941.HK)$ Down 0.38% to 78.50 yuan, with an RSI of 24 entering the oversold zone. The technical signal indicates a strong buy, and short-term rebound momentum deserves attention.
2. Strong sell signal stocks: $HSBC HOLDINGS (00005.HK)$ Surged 2.67% to 134.50 yuan, with the stock price firmly above both MA10 and MA30. However, the RSI of 76 has entered the overbought zone, and the technical signal is a strong sell (strength 11), potentially facing downward pressure after significant gains. $AIA (01299.HK)$ Rose by 4.09% to NT$86.45, also standing firm above the short-term moving averages. The RSI at 56 is neutral, but technical signals strongly suggest a sell, reflecting divergence between price gains and indicators. $PING AN (02318.HK)$ 、 $HKEX (00388.HK)$ 、 $BABA-W (09988.HK)$ Also giving sell or strong sell signals, with most accompanied by rising share prices; investors should beware of potential volatility due to indicator corrections.
3. Neutral and special signal stocks: $CCB (00939.HK)$ Increased by 1.44% to NT$7.77, with the stock price close to MA10 (NT$7.73). The RSI at 49 is near neutral, and the technical signal is neutral but annotated as a strong sell. Given conflicting signals, it’s advisable to remain on the sidelines for now. $WUXI BIO (02269.HK)$ Dipped slightly by 0.26% to NT$38.12, with the stock price below MA10 but above MA30. The RSI at 59 leans toward the bullish zone, while technical signals indicate a sell (strength level 8), likely facing pressure from MA10 in the short term.
Review and Selection of Warrant and Bull/Bear Products
Looking back at the two Hang Seng Index bull contracts recommended on January 22, their performance was impressive: $BI#HSI RC2808E.C (64016.HK)$ A 14% increase in just two days, $BI#HSI RC28081.C (63488.HK)$ A 13% gain in two days, compared to only a 0.51% rise in the Hang Seng Index over the same period, demonstrating significant leverage effects.
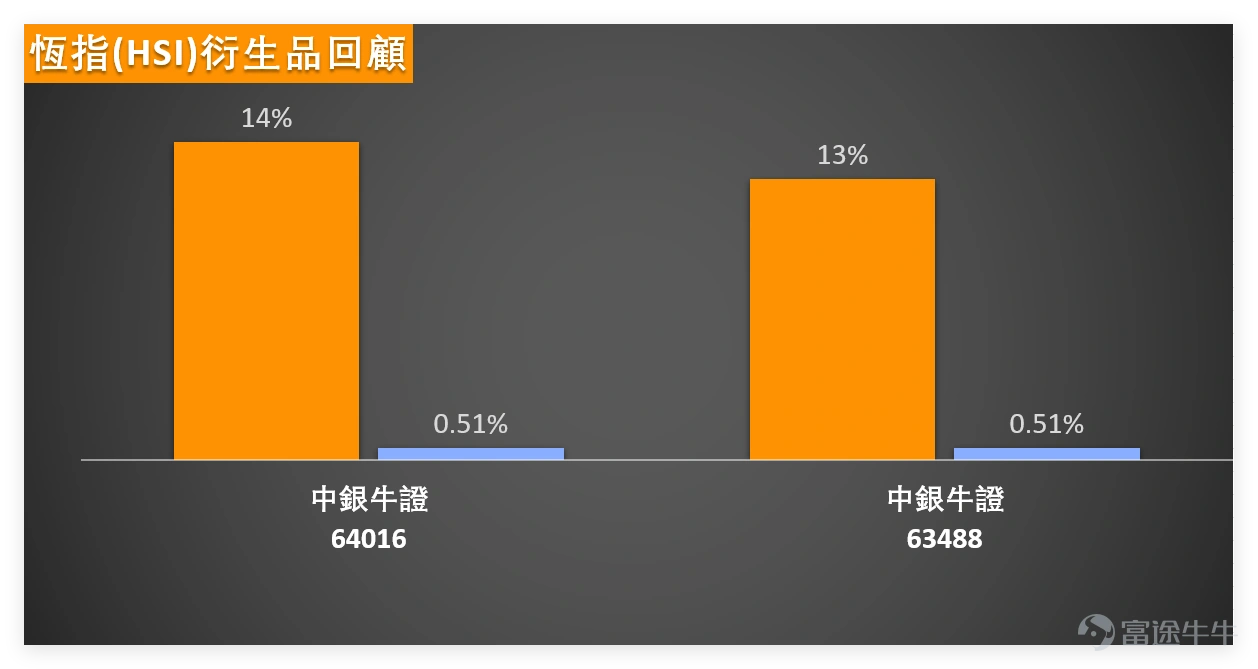
Investors are reminded that warrant and bull/bear products have expiration attributes, and leverage amplifies market volatility risks. Even if short-term returns appear attractive, closely tracking the underlying stock movements and product expiration dates is crucial to avoid holding blindly.
Selected Warrant Products:
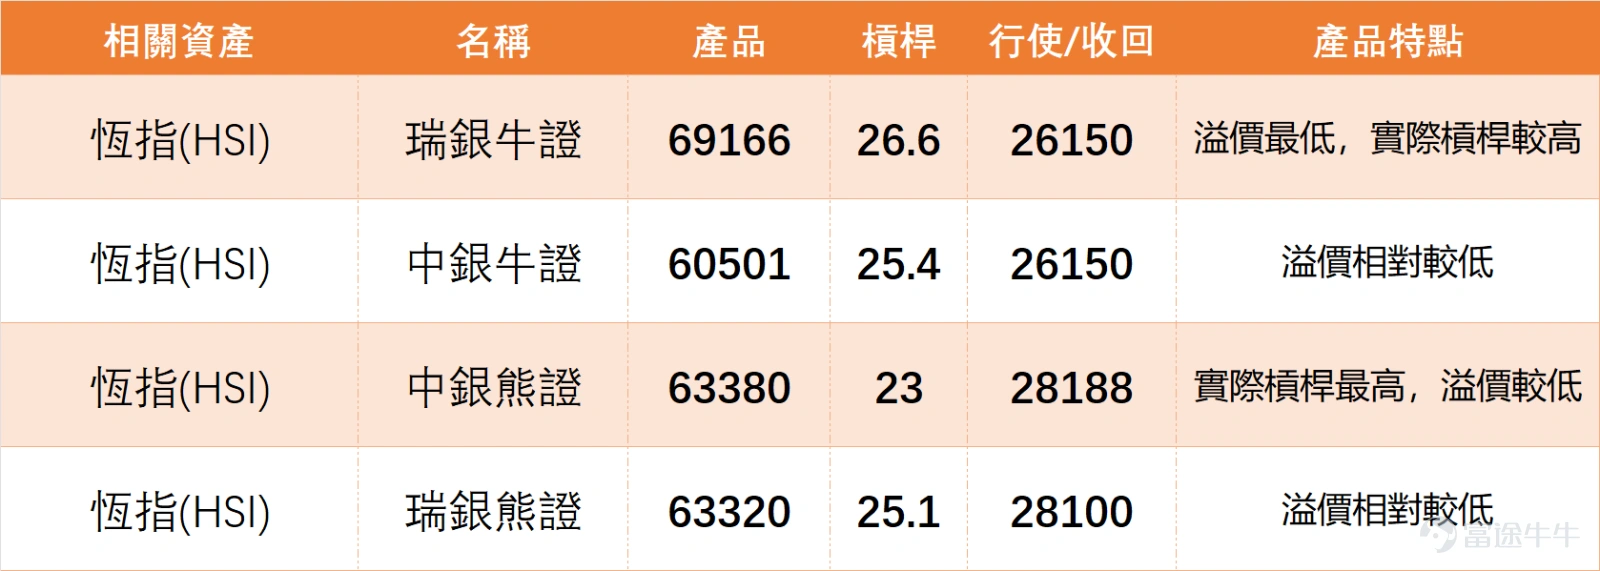
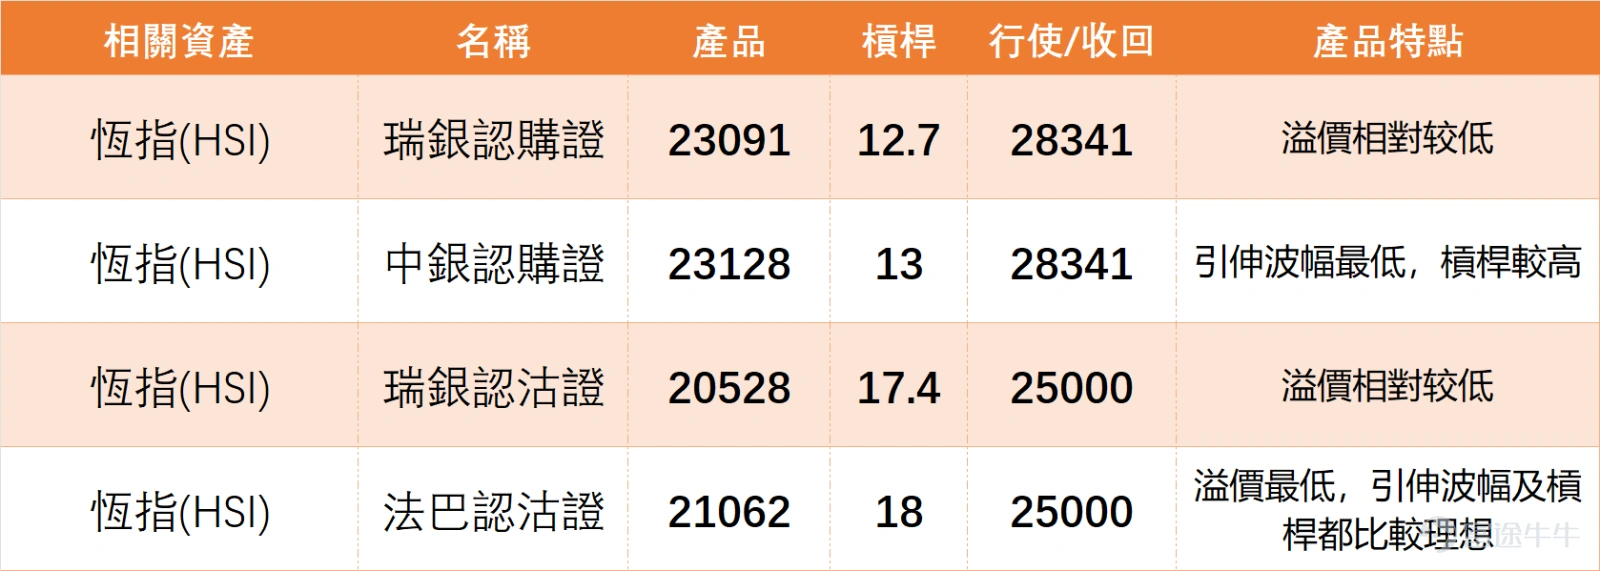
Given the current oscillating yet slightly bullish trend of the Hang Seng Index (HSI) and the divergence in long-short signals, we have selected two well-matched products for investors' reference:
1. $UB-HSI @EC2605B.C (23091.HK)$: Actual leverage of 12.7 times, strike price at 28,341 points. Its core advantage lies in relatively lower premium, corresponding to expectations that the HSI may overcome resistance levels; suitable for investors optimistic about the HSI breaking through 27,411 points as it helps reduce cost pressures brought by premiums.
2. $BI#HSI RP2803I.P (63380.HK)$: Actual leverage of 23 times (the highest among similar products), recovery price at 28,188 points, with a relatively low premium. Suitable for investors who believe the HSI will struggle to break through resistance in the short term and may retest support levels; its leveraged nature matches adjustments within volatile market conditions.
As the HSI approaches the resistance level of 27,411 points, would you 'hold stocks and wait for a breakout' or 'reduce positions to hedge risks'?
In the current market situation, do you prefer 'call warrants' or 'put warrants'? Do you value leverage more or premium?
Come to the comment section and share your thoughts! Want to see more analysis? Remember to follow 'HK Stock Warrants Jenny' for daily updates!
Disclaimer: This article does not constitute any investment advice.
This article is for reference only and does not constitute any investment advice. The market data, opinions, and analysis contained herein may change at any time without prior notice. We shall not be liable for any loss or damage arising from reliance on the information in this article. Technical analysis merely indicates whether certain technical conditions are met; a comprehensive evaluation of asset performance should incorporate additional data. Trading decisions should not be based solely on the content of this article. Please note that past performance is not indicative of future results.
#HongKongStocks #HangSengIndex #RealTimeAnalysis #WarrantsSelection #WarrantsStrategy #DerivativesHedging #HongKongWarrantsJenny #TencentHoldings #FinTechSector #TechnicalAnalysis #BlueChipTrends
Risk Disclaimer: The above content only represents the author's view. It does not represent any position or investment advice of Futu. Futu makes no representation or warranty.Read more

Comment (1)
to post a comment
3