"Risk" or "Opportunity"? Tencent's adjustment sends signals for strategic positioning; how much room is there for a short-term rebound?
$TENCENT (00700.HK)$As the 'stabilizing force' of Hong Kong stocks, every move by Tencent (00700.HK) has been capturing market attention. Its share price weakened amid fluctuations in early 2026 and once broke below the key psychological and technical level of HKD 600. Market sentiment shows a stark contrast between ongoing adjustments and active positioning by 'northbound' funds, creating contradictions and tensions in Tencent’s short-term trend. Currently, the stock price is trying to find direction within a clear support and resistance framework, while the derivatives market has become the forefront where capital expresses bullish and bearish views.
I. Market Views: Capital divergence highlights bulls vs. bears
The recent market view on Tencent reflects a typical tug-of-war between 'short-term technical bearishness' and 'long-term capital optimism'.
Market caution primarily stems from weak technical charts and profit-taking pressure. In the January 22 episode of [Hong Kong Stock Podcast], host Simon pointed out that Tencent's share price had broken below the key psychological threshold of HKD 600, with significantly higher trading volumes, showing a 'price drop with volume surge,' signaling short-term pessimism. This observation was corroborated by authoritative technical analysis platforms. Tencent displayed a 'strong sell' signal, with its moving average system issuing 12 sell signals and the technical indicator system issuing seven sell signals, indicating pressure on the short-term trend. This may reflect some institutional investors’ profit-taking behavior after the stock retreated from its early-year high (near HKD 639).
However, contrarian funds are also on the move, with the movement of 'northbound capital' being particularly noteworthy. Despite weak stock prices, data from UBS shows that southbound capital through Stock Connect has flowed over 600 million yuan into Tencent during the recent correction, with tens of millions more flowing into its call warrants and bull contracts, which are bullish derivatives. This suggests some long-term or value investors see the stock price adjustment as a buying opportunity. This sentiment echoes Goldman Sachs’ research note released on January 25. Goldman Sachs believes that as the core of China’s gaming and entertainment sector, Tencent's core business growth remains solid and is a key representative of artificial intelligence application, leading them to maintain a “buy” rating.
As summarized in [HK Stocks Podcast], the market is watching to see if this is a good time for positioning, while some investors, based on the signal of heavy selling volume, have chosen to continue deploying put warrants.
II. Technical Analysis: Key Levels as Short-Term Trend Lifelines
As of January 27, Tencent's share price rebounded to HKD 607.5, but it still remains in a sensitive and critical technical area. According to the latest data, short-term technical signals have temporarily turned 'neutral,' suggesting that the bulls and bears may reach a new equilibrium here.
The significant resistance above will be the first test for the continuation of the rebound. Currently, the stock faces its first resistance level at HKD 622. This is the dividing line between short-term strength and weakness, and only an effective breakout above this level would allow further upward pressure towards the second resistance level at HKD 638, near the early-January high. However, the stock price is still below all major moving averages (MA10, MA30, MA60), which are concentrated in the range of HKD 608 to 618, forming the first layer of resistance for the rebound.
The key support below is the last line of defense determining the depth of the correction. According to [HK Stocks Podcast], if the stock price continues to fall, close attention should be paid to the support around HKD 582, near the lower Bollinger Band on the daily chart. The more important second support level at HKD 574 can be regarded as the lifeline for the medium-term trend. If this level is breached, both the depth and duration of the correction could extend significantly. For the bulls, constructing a solid bottom structure on the technical chart is crucial.
III. Review of Warrants and Bull/Bear Contracts: Two-Way Amplification of Leverage Characteristics
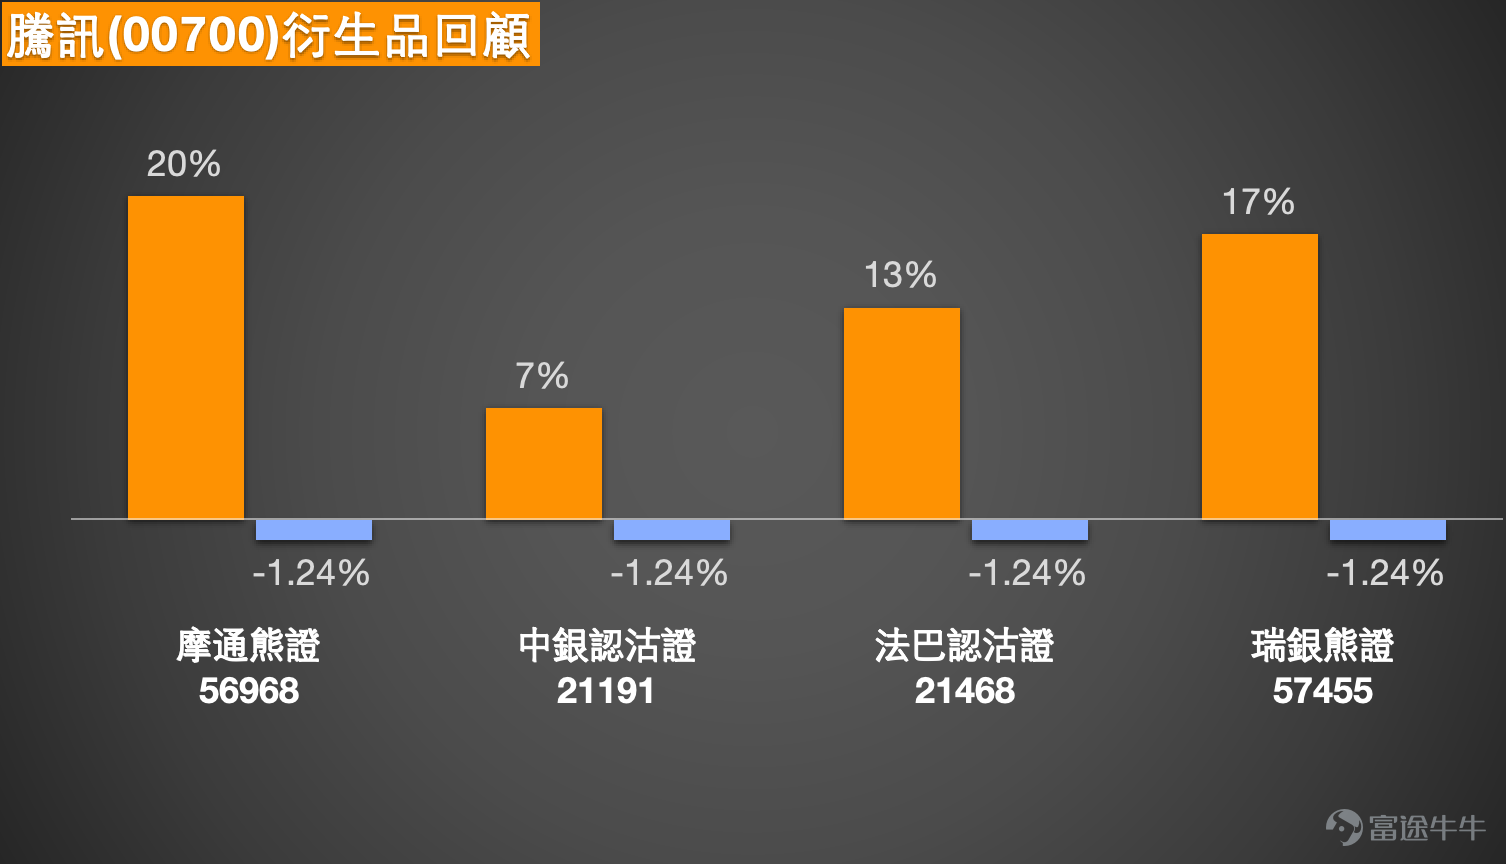
The historical performance in the derivatives market vividly demonstrates its core characteristics. Looking back at the products mentioned on January 21, over the next two trading days, Tencent's underlying stock dropped by 1.24%. During the same period, bearish derivatives saw notable gains: J.P. Morgan's bear contract (56968) and UBS Group’s bear contract (57455) rose by 20% and 17%, respectively, while BNP Paribas' put warrant (21468) gained 13%. This clearly reveals that when the direction is correctly predicted, warrants and bull/bear contracts can significantly enhance capital efficiency through their built-in leverage mechanism, amplifying the underlying stock’s decline into greater returns for derivatives. Of course, this leverage effect works both ways—losses can be equally magnified when predictions go wrong.
![$TENCENT (00700.HK)$As the 'stabilizing force' of Hong Kong stocks, every move by Tencent (00700.HK) has been capturing market attention. Its share price weakened amid fluctuations in early 2026 and once broke below the key psychological and technical level of HKD 600. Market sentiment shows a stark contrast between ongoing adjustments and active positioning by 'northbound' funds, creating contradictions and tensions in Tencent’s short-term trend. Currently, the stock price is trying to find direction within a clear support and resistance framework, while the derivatives market has become the forefront where capital expresses bullish and bearish views. I. Market Views: Capital divergence highlights bulls vs. bears The recent market view on Tencent reflects a typical tug-of-war between 'short-term technical bearishness' and 'long-term capital optimism'. [Share Link: January 22nd [Hong Kong Stock Podcast] - Hang Seng Index, Tencent, Li Auto, Alibaba, Pop Mart, China Unicom] Market caution primarily stems from weak technical charts and profit-taking pressure. In the January 22 episode of [Hong Kong Stock Podcast], host Simon pointed out that Tencent's share price had broken below the key psychological threshold of HKD 600, with significantly higher trading volumes, showing a 'price drop with volume surge,' signaling short-term pessimism. This observation was corroborated by authoritative technical analysis platforms. Tencent displayed a 'strong sell' signal, with its moving average system issuing 12 sell signals and the technical indicator system issuing seven sell signals, indicating...](https://nnqimage.futunn.com/sns_client_feed/1162342/20260127/web-1769496378491-zCWHB98dGx.png/big?area=1&is_public=true&imageMogr2/ignore-error/1/format/webp)
Bullish Direction Choices (Bet on Stock Price Bottoming and Rebounding):
* Bull Contract Products (High leverage, but beware of forced recall risks): For instance, HSBC's bull contract (67294) and UBS Group’s bull contract (61948), with recall prices set at HKD 577. This setting is highly strategic—it is slightly above the first support level at HKD 574, meaning the safety margin is very thin. Once the stock price tests the bottom again and effectively breaks below HKD 574, these bull contracts face a high risk of being forcibly recalled. With actual leverage of about 17 times, they are suitable only for short-term traders who have strong confidence in the first support holding.
* Call warrant products (no recovery risk, focus on out-of-money degree): For instance, UBS Group call warrants (15002) and HSBC call warrants (15275), both with an exercise price of HKD 622.72. This exercise price is equivalent to the first resistance level at HKD 622. This design is slightly out-of-the-money, aiming to capture a rebound in share prices and successfully challenge the first resistance level. This is much more pragmatic compared to some deep out-of-the-money products in the market with exercise prices as high as HKD 759, which require the underlying stock to soar by over 25% to have value. The slightly out-of-the-money products demand a more reasonable increase in the underlying stock, offering better linkage and effectively mitigating the risk of deep out-of-the-money products not following price movements or even declining due to time decay during sideways trading.
![$TENCENT (00700.HK)$As the 'stabilizing force' of Hong Kong stocks, every move by Tencent (00700.HK) has been capturing market attention. Its share price weakened amid fluctuations in early 2026 and once broke below the key psychological and technical level of HKD 600. Market sentiment shows a stark contrast between ongoing adjustments and active positioning by 'northbound' funds, creating contradictions and tensions in Tencent’s short-term trend. Currently, the stock price is trying to find direction within a clear support and resistance framework, while the derivatives market has become the forefront where capital expresses bullish and bearish views. I. Market Views: Capital divergence highlights bulls vs. bears The recent market view on Tencent reflects a typical tug-of-war between 'short-term technical bearishness' and 'long-term capital optimism'. [Share Link: January 22nd [Hong Kong Stock Podcast] - Hang Seng Index, Tencent, Li Auto, Alibaba, Pop Mart, China Unicom] Market caution primarily stems from weak technical charts and profit-taking pressure. In the January 22 episode of [Hong Kong Stock Podcast], host Simon pointed out that Tencent's share price had broken below the key psychological threshold of HKD 600, with significantly higher trading volumes, showing a 'price drop with volume surge,' signaling short-term pessimism. This observation was corroborated by authoritative technical analysis platforms. Tencent displayed a 'strong sell' signal, with its moving average system issuing 12 sell signals and the technical indicator system issuing seven sell signals, indicating...](https://nnqimage.futunn.com/sns_client_feed/1162342/20260127/web-1769496384494-BniwGGnB6G.jpeg/big?area=1&is_public=true&imageMogr2/ignore-error/1/format/webp)
Bearish direction choices (betting on a failed rebound or support breakdown):
* Bear certificate products (providing safer downside tools): For example, UBS Group bear certificates (57455) $UB#TENCTRP2812D.P (57455.HK)$ and JPMorgan bear certificates (56968) $JP#TENCTRP2812D.P (56968.HK)$ , with recovery prices of HKD 630 and HKD 629 respectively. These levels are well below the second resistance level at HKD 638, providing ample safety buffer and lower risk of being forcibly recovered in the short term. Suitable for investors who believe there is limited upside potential and that the price will reverse downwards again.
* Put warrant products (targeting key support levels below): Such as Bank of China put warrants (21191) $BITENCT@EP2603C.P (21191.HK)$ and BNP Paribas put warrants (21468) $BPTENCT@EP2603C.P (21468.HK)$ , with exercise prices at HKD 570.27 and HKD 571 respectively. These exercise prices are slightly below the first support level at HKD 574, designed to speculate on a decline in share prices breaking below the first support level towards a pullback near the second support level (HKD 574).
![$TENCENT (00700.HK)$As the 'stabilizing force' of Hong Kong stocks, every move by Tencent (00700.HK) has been capturing market attention. Its share price weakened amid fluctuations in early 2026 and once broke below the key psychological and technical level of HKD 600. Market sentiment shows a stark contrast between ongoing adjustments and active positioning by 'northbound' funds, creating contradictions and tensions in Tencent’s short-term trend. Currently, the stock price is trying to find direction within a clear support and resistance framework, while the derivatives market has become the forefront where capital expresses bullish and bearish views. I. Market Views: Capital divergence highlights bulls vs. bears The recent market view on Tencent reflects a typical tug-of-war between 'short-term technical bearishness' and 'long-term capital optimism'. [Share Link: January 22nd [Hong Kong Stock Podcast] - Hang Seng Index, Tencent, Li Auto, Alibaba, Pop Mart, China Unicom] Market caution primarily stems from weak technical charts and profit-taking pressure. In the January 22 episode of [Hong Kong Stock Podcast], host Simon pointed out that Tencent's share price had broken below the key psychological threshold of HKD 600, with significantly higher trading volumes, showing a 'price drop with volume surge,' signaling short-term pessimism. This observation was corroborated by authoritative technical analysis platforms. Tencent displayed a 'strong sell' signal, with its moving average system issuing 12 sell signals and the technical indicator system issuing seven sell signals, indicating...](https://nnqimage.futunn.com/sns_client_feed/1162342/20260127/web-1769496391155-9XFVs5HiYf.jpeg/big?area=1&is_public=true&imageMogr2/ignore-error/1/format/webp)
Interaction and Questions
Quick Q&A:
1. Tencent has held the HKD 600 mark. Do you think it can next rise to the resistance level of HKD 622, or might it retreat to test the support level at HKD 574?
2. If you were to use derivatives to position on Tencent now, would you prioritize bull certificates / slightly out-of-the-money call warrants to bet on a rebound, or choose bear certificates / put warrants to hedge against a decline?
Follow [HK Stock Warrants Jenny] for daily insights into HK stock derivatives data and market trends.
Disclaimer: This article does not constitute any investment advice.
This article is for reference only and does not constitute any investment advice. The market data, opinions, and analysis contained herein may change at any time without prior notice. We shall not be liable for any loss or damage arising from reliance on the information in this article. Technical analysis merely indicates whether certain technical conditions are met; a comprehensive evaluation of asset performance should incorporate additional data. Trading decisions should not be based solely on the content of this article. Please note that past performance is not indicative of future results.
#Tencent #00700 #TechnicalAnalysis #SupportResistanceLevels #Derivatives #BullBearCertificates #OutofMoneyDegree #HKStocksPodcast #NorthboundFunds #DerivativeTerms
Risk Disclaimer: The above content only represents the author's view. It does not represent any position or investment advice of Futu. Futu makes no representation or warranty.Read more

Comments
to post a comment
2
9