Technical Analysis of Popular US Sector ETFs (January 27): Semiconductors/Internet/Artificial Intelligence/Real Estate/Finance/Technology/Communications/Consumer Discretionary/Industrials/Materials/Energy/Consumer Staples/Healthcare/Utilities
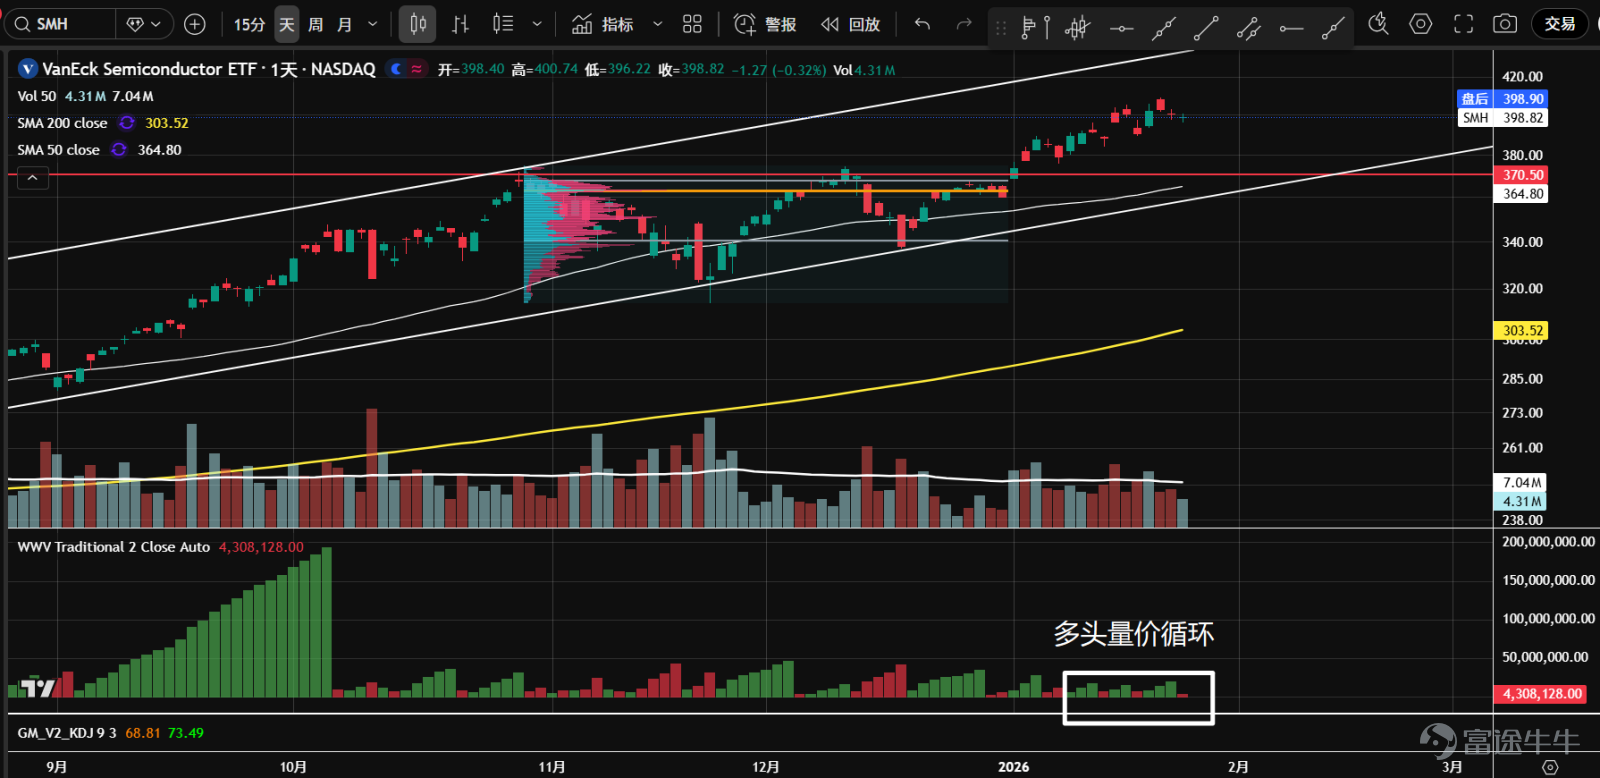
1、$VanEck Semiconductor ETF (SMH.US)$ Since the start of the new year, it has broken through a two-month-long ascending triangle pattern and continues to operate within a long-term uptrend channel with price-volume bullish cycles. It can be held continuously, while watching for opportunities to buy on dips.

2、 $First Trust Dow Jones Internet Index Fund (FDN.US)$ In November last year, panic selling occurred at the support level of 254 axis. Recently, this position is being retested; trading volume initially contracted significantly before rebounding to short-term resistance. Wait for pullback opportunities to go long.

3、 $Global X Artificial Intelligence & Technology ETF (AIQ.US)$ Since the end of last year, an ascending triangle pattern has gradually formed, with higher lows. Recently, as it approaches the previous high resistance near 53, there have been repeated high-volume bearish candles, but the bears haven't made significant progress; bulls may be absorbing floating chips. KD golden cross near 50 suggests potential upward breakout ahead.

4. Real estate sector $Real Estate Select Sector Spdr Fund (The) (XLRE.US)$ Since the second half of last year, it has been trading in a range-bound pattern. Recently, it failed to break through the resistance at 42.5 and retreated, showing a buying frenzy with high volume. A large amount of supply emerged, and the market may continue to consolidate.

5、 $Financial Select Sector SPDR Fund (XLF.US)$ It once broke through months of consolidation but did not hold for long, resulting in a heavy volume sell-off, eventually retreating back into the consolidation zone and forming a false breakout. The price may return to the volume control point (orange line) in the short term.

6、 $The Technology Select Sector SPDR® Fund (XLK.US)$ Approaching the tail end of the triangle pattern, overall trading volume is declining while the bottom is rising, indicating a possible accumulation phase. Extremely narrow range trading over the past few weeks saw a sharp volume sell-off, possibly setting up for an upward breakout.

7、 $The Communication Services Select Sector SPDR® Fund (XLC.US)$ Since September last year, it has been moving sideways. Last week, panic selling occurred, followed by a significant rebound after reaching the lower boundary of the value range, then returning to the upper boundary of the value range. This could be a shakeout or a setup for an upward breakout.

8、 $Consumer Discretionary Select Sector SPDR Fund (XLY.US)$ After breaking out upwards in December last year, it twice pulled back below the volume control point (orange line) within the value range. The latest rebound saw shrinking volume, and the price reached the upper boundary of the value range, which may retreat due to insufficient demand.

9、 $Industrial Select Sector SPDR Fund (XLI.US)$ Since the beginning of the year, it broke through the consolidation zone, entering an upward trend. Currently, the stock price is at the upper boundary of the uptrend channel with heavy volume but stagnating growth, retreating to the axis support on reduced volume. Daily candlestick forms a small doji, offering potential short-term buying opportunities.

10、 $Materials Select Sector SPDR ETF (XLB.US)$ After more than half a year of sideways movement, there was a strong breakout above the resistance at 46 early this month, followed by a quick retest, then a rapid rise to new highs, forming a valid breakout. It is currently in a strong uptrend with no entry points available for now.

11、 $Energy Select Sector SPDR Fund (XLE.US)$ At the start of the new year, there was a strong breakout above the one-and-a-half-year consolidation zone, followed by a pullback on low volume, and then a rebound near the upper boundary of the value range, entering an uptrend. In a bullish price-volume cycle, waiting for opportunities to buy on dips.

12、 $Consumer Staples Select Sector SPDR Fund (XLP.US)$ For over a year, it has traded within a large sideways range, recently experiencing continuous strong volume increases. The current price has broken through the upper resistance, but volume has started to decline, signaling insufficient demand. A short-term pullback is possible; watch whether this is a false breakout or a true sustained breakout.

13、 $The Health Care Select Sector SPDR® Fund (XLV.US)$ Since December of last year, the stock has been moving sideways with volatility. Recently, there have been repeated attempts to break through resistance around 158, but without success. Trading volume has started to contract, and in the short term, prices may retest the volume control point (orange line) and the 50-day moving average.

14、 $Utilities Select Sector SPDR Fund (XLU.US)$ The stock has been on a downward trend since October of last year. Recently, it stabilized around the annual moving average with increased trading volume. The share price has consolidated for a month, forming a b-shaped volume distribution, with growing divergence between buyers and sellers. Currently, the price is at the volume control point (orange line), and the direction remains unclear. It is recommended to stay on the sidelines for now.

$S&P 500 Index (.SPX.US)$ $SPDR S&P 500 ETF (SPY.US)$ $NASDAQ 100 Index (.NDX.US)$ $Invesco QQQ Trust (QQQ.US)$ $Dow Jones Industrial Average (.DJI.US)$ $State Street® SPDR® Dow Jones Industrial Average® ETF Trust (DIA.US)$ $Russell 2000 Index (.RUT.US)$ $iShares Russell 2000 ETF (IWM.US)$ $USD (USDindex.FX)$ $U.S. 10-Year Treasury Notes Yield (US10Y.BD)$ $XAU/USD (XAUUSD.CFD)$
Risk Disclaimer: The above content only represents the author's view. It does not represent any position or investment advice of Futu. Futu makes no representation or warranty.Read more


Comments
to post a comment
12
3