January 26, 2026, E Fund Hang Seng ESG

---
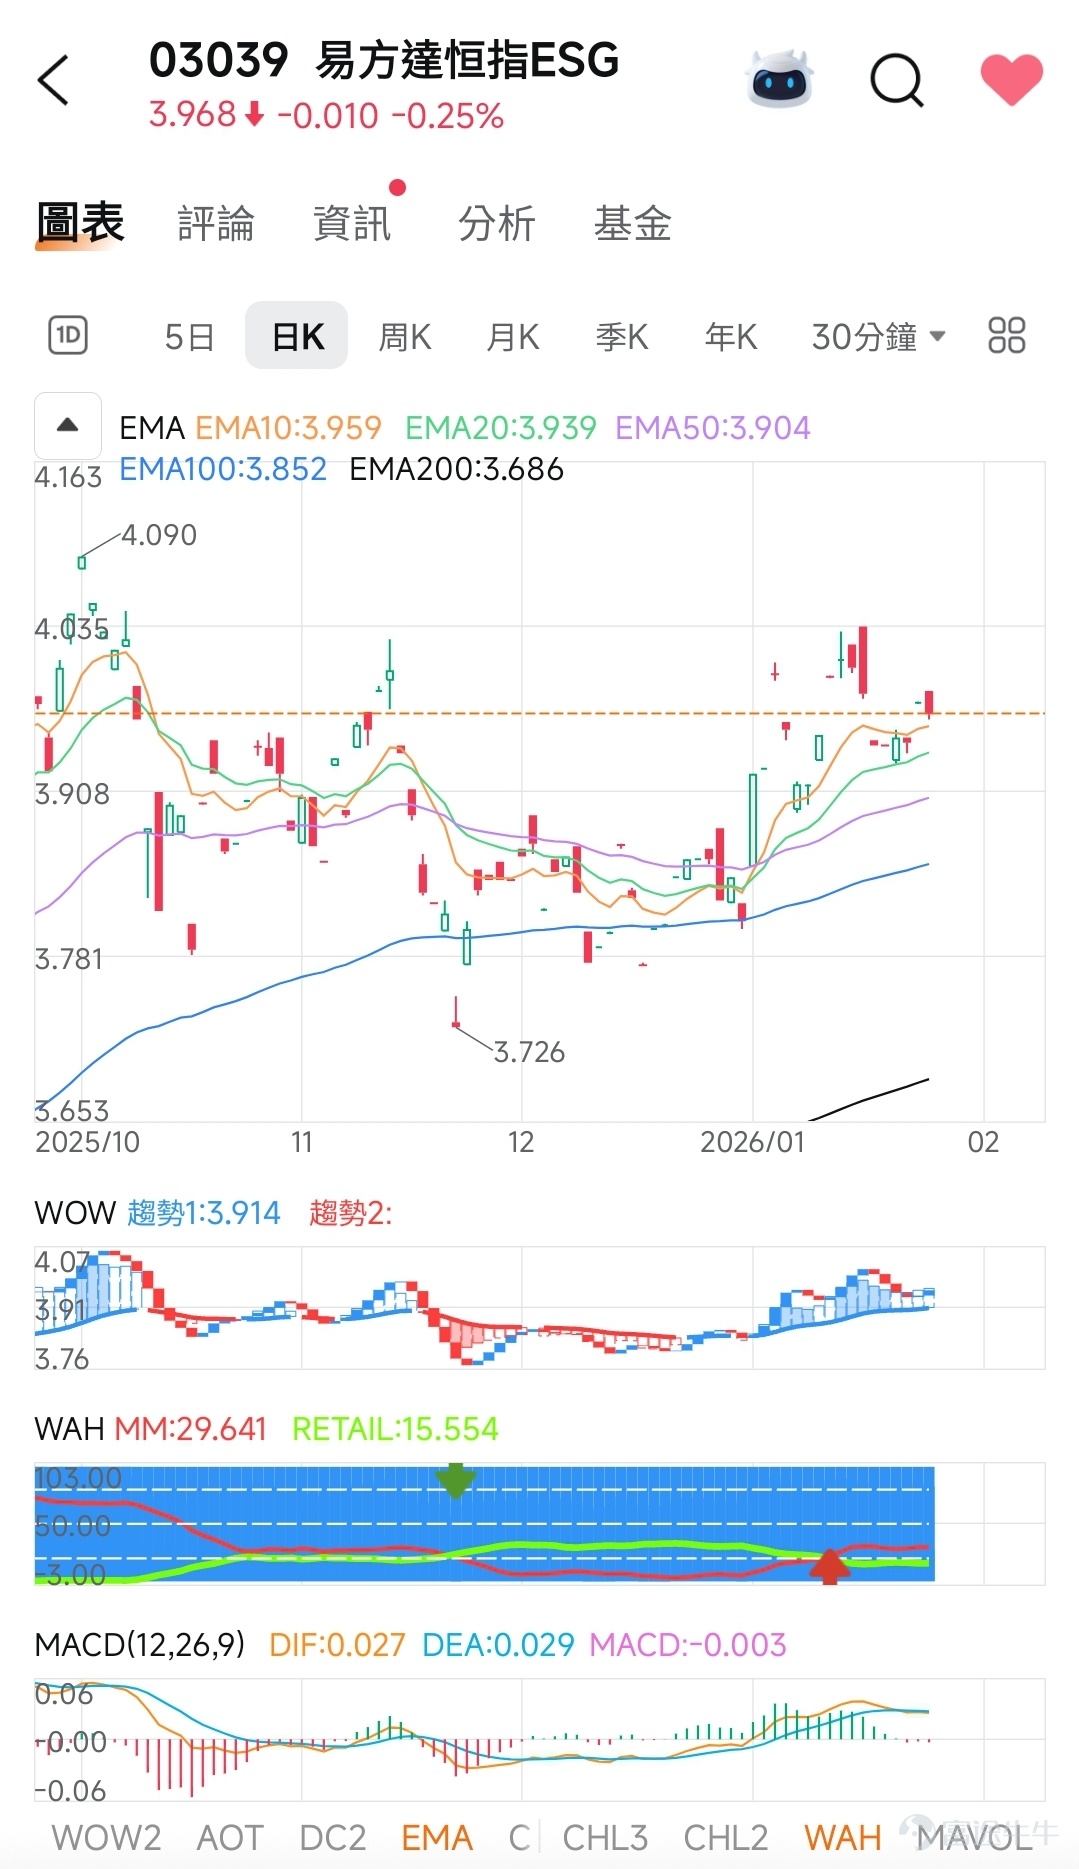
📈 Current trend status: Bullish pattern confirmed
· Price level: Stock price at 4.090, now above all EMAs (EMA10 to EMA200), forming a bullish alignment, indicating upward trends in both short- and long-term.
· Moving average structure: EMA10 (3.959) > EMA20 (3.939) > EMA50 (3.904) > EMA200 (3.686), showing upward divergence that supports rising momentum.
· Key support: OW Trend 1 marked at 3.914, close to EMA50, becoming a strong near-term support zone.
---
📊 Volume and positioning signals:
1. Trading volume: Significant volume spikes are visible in the chart (e.g., numbers like 908, 781 likely represent trading volumes), aligning with price increases, reflecting a healthy structure of simultaneous price and volume rise.
2. Chip distribution:
· AIH Institutional chips (MM): 29.641 (leading force)
· Retail chips (RETAIL): 15.554
→ This indicates the current upward movement is driven by institutional funds, but retail participation remains low; caution is needed as adjustments by institutions could trigger significant volatility.
---
⚠️ Potential risks and key observations:
· Profit-taking pressure: The stock price is far from EMA200 (3.686), with a substantial short-term gain, possibly facing technical pullbacks.
· Key support: If it breaks below 3.914 (Trend 1), it may retest EMA50 (3.904) or EMA20 (3.939) for support.
· Time window: The annotation '2026/01' in the chart may suggest future turning points or important timeframes, requiring continued attention.
🔥 WOW Analysis (Strong signal)
· Bullish EMA alignment: EMA10 (3.959) > EMA20 (3.939) > EMA50 (3.904) > EMA100 (3.852) > EMA200 (3.686), showing an upward trend from short-term to long-term moving averages, with robust buying momentum.
· Price breaks through key resistance: the current price (4.090) is significantly higher than all EMAs, especially breaking through the important pressure level of EMA200 (3.686), potentially opening up a new round of upward momentum.
· Active institutional inflows: The AIH MM (institutional funds) value is as high as 29.641, far surpassing RETAIL (retail funds) at 15.554, indicating sustained large capital inflows supporting the stock price.
⚠️ WAH Analysis (Potential Risks)
· Shrinking trading volume: The histogram in the chart shows that recent trading volume has declined (e.g., values like '135', '908' are gradually decreasing). If there is no follow-up in volume, the sustainability of the upward trend may be limited.
· Trendline divergence risk: The 'Trend 1' value is 3.914, slightly below the current price. If the price pulls back near the trendline without finding support, short-term fluctuations may occur.
· Emerging overbought signals: The price has rapidly surged to 4.090, nearing previous highs (around 4.090). Profit-taking pressures need to be monitored.
📈 Future Direction Forecast
1. Short-term: If the price stabilizes above 4.000 with increased volume, it may test the 4.200–4.300 range; if it falls below 3.950 (near EMA10), it could pull back to 3.850 (EMA100) for support.
2. Key indicators: Closely monitor whether AIH MM remains at high levels and whether trading volume can increase again to confirm upward momentum.
3. Recommended strategy: Gradually enter positions on pullbacks near EMA10 (3.959) or Trend 1 (3.914), with a stop-loss set below EMA20 (3.939).
---
🔮 Market Outlook and Trading Recommendations:
· For current holders: You may continue to hold, using EMA10 (~3.959) or the trend line at 3.914 as your profit-taking defense point.
· For those looking to enter: It is recommended to wait for a pullback to the EMA10~EMA20 range (3.94-3.96) and look for signs of volume contraction and stabilization before deploying positions in batches.
· Key resistance: If there is a breakout above 4.10 with high volume, the next target will be the 4.30-4.50 range.
---
💎 One-Sentence Summary
"The trend is bullish, price and volume are aligned, but beware of fluctuations caused by institutional position adjustments; chase rising stocks cautiously, avoid chasing highs, and closely monitor support levels for trading."
Disclaimer: The above analysis is based on chart data and does not constitute investment advice. The market carries risks, and decisions should be made with caution.
---
Risk Disclaimer: The above content only represents the author's view. It does not represent any position or investment advice of Futu. Futu makes no representation or warranty.Read more


Comments
to post a comment
5