
【Warrant Perspective】HSBC tests resistance at 132; technical structure and volume face critical challenges
On January 21st, $HSBC HOLDINGS (00005.HK)$
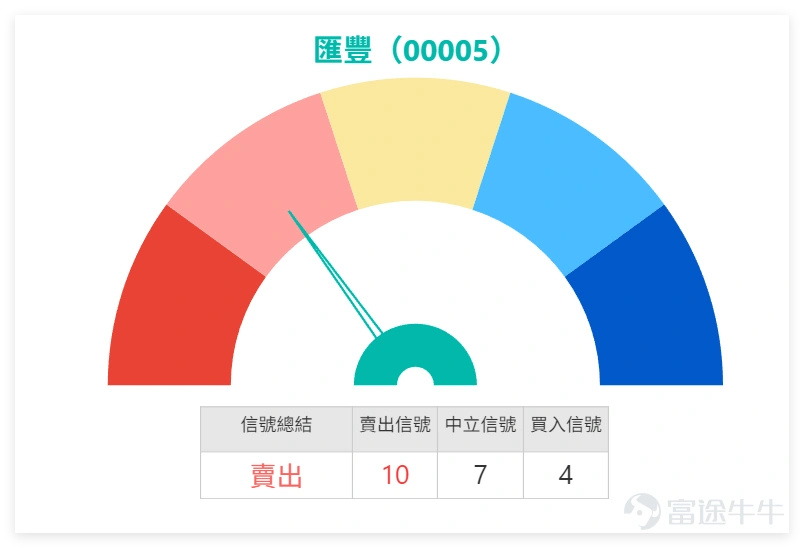
Closing at HKD 128.2, a slight daily drop of 0.16%, with a trading volume of HKD 917 million, showing moderate activity without unusual spikes. From a technical perspective, HSBC’s signals are mixed but overall bearish: the RSI indicator reached 69, nearing the overbought zone, suggesting that upward momentum from earlier has weakened, increasing short-term pullback pressure.
In terms of the moving average system, MA10, MA30, and MA60 are at 126.69 yuan, 121.88 yuan, and 115.50 yuan respectively. Although the short-term moving averages remain above the long-term averages in a bullish arrangement, the technical summary signal has issued a 'sell' rating with a strength of 10. Additionally, multiple oscillation indicators maintain a 'neutral' stance, implying that upward resistance cannot be ignored.
The banking sector overall showed weakness on January 21st. $STANCHART (02888.HK)$ It fell 1.09% in a single day, closing at 191.3 yuan. Both MACD and moving average signals point to 'sell,' indicating a weak trend. $BOC HONG KONG (02388.HK)$ Despite a 0.97% rise against the market trend to 39.68 yuan, there is clear divergence in technical signals: the oscillation indicator gives a 'buy' signal while the moving averages suggest a 'strong sell,' giving it an impression of 'fighting alone.'
Regarding mainland banks, $CCB (00939.HK)$ 、 $ICBC (01398.HK)$ They dropped 1.16% and 1.58% respectively. Although medium- and long-term moving average signals lean towards optimism, short-term momentum is insufficient, and the MACD signal is weak, causing stock prices to struggle for standout performance.
Overall, the banking sector lacked unified upward logic on January 21st, with low willingness for capital inflow.
As of 11:37 AM today (22nd), HSBC's latest price was 128.6 yuan, with a temporary increase of 0.31%,Resistance levels are concentrated at 132.2 yuan and 136.3 yuan, making a short-term breakout more difficult. On the support side, the first support lies at 124.3 yuan, and the second support at 120.1 yuan. If the market falls below the first support, it may further test the stronger support below.
Warrants & Bull/Bear: Review and Selection
(1) Review of Previous Products
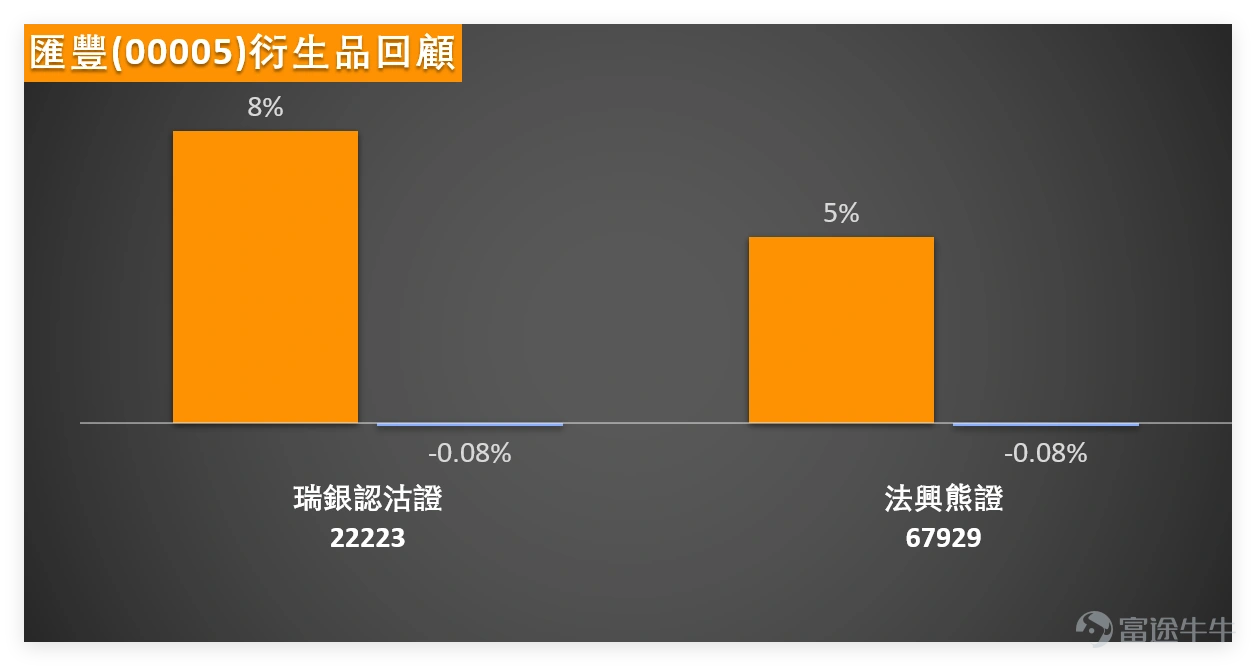
Looking back at the HSBC-related derivatives recommended on January 16, their performance was commendable: $SG#HSBC RP2701C.P (67929.HK)$A 5% increase was recorded two days later, $UB-HSBC@EP2606B.P (22223.HK)$with some even achieving an 8% rise, while the underlying stock only slightly fell by 0.08% during the same period. This shows that during a volatile adjustment phase for the underlying stock, bearish products offer better value. However, this also serves as a reminder that derivatives have strong leverage characteristics—both rises and falls happen quickly; blindly chasing highs should be avoided.
(2) Product Selection
Based on the technical aspects of the day and product attributes, two differentiated products have been selected for reference:
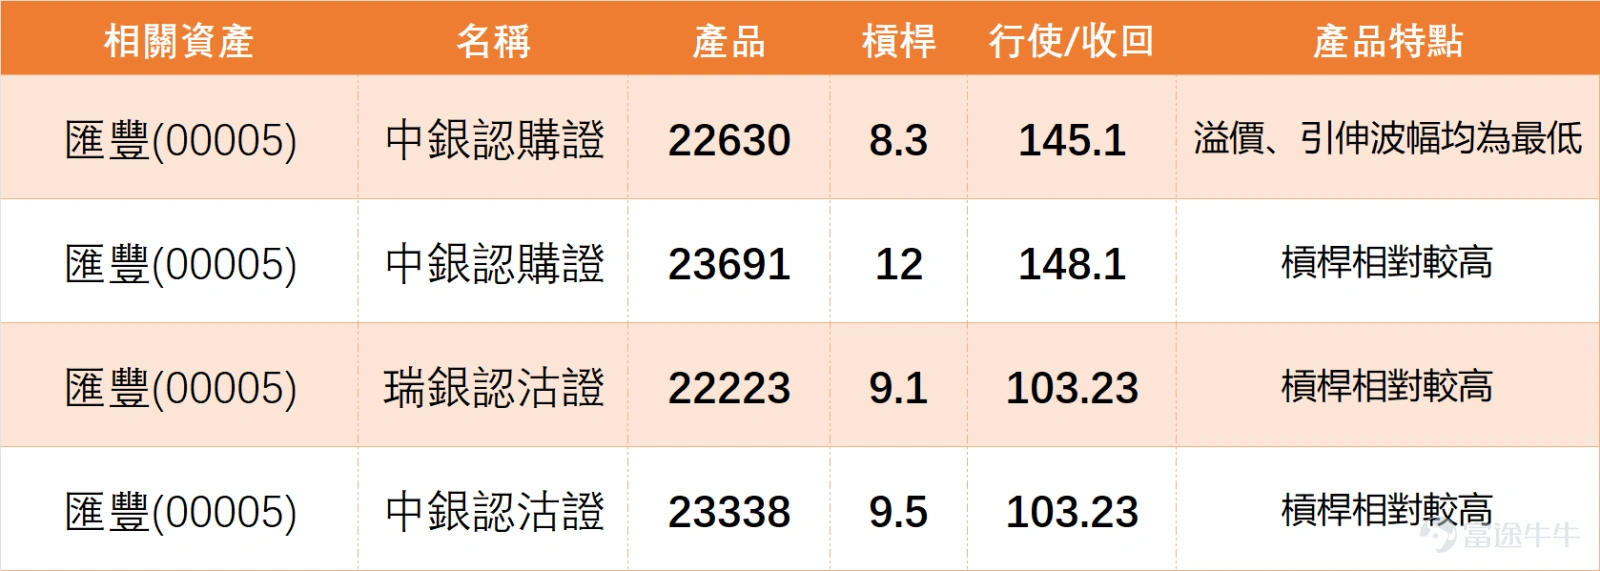
1. $BI-HSBC@EC2609B.C (22630.HK)$: With an actual leverage of 8.3 times and a strike price of $145.1, its main advantage is that both the premium and implied volatility are at the lowest levels among similar products, offering significant cost benefits. It is suitable for investors who still expect long-term growth in HSBC and seek stable costs.
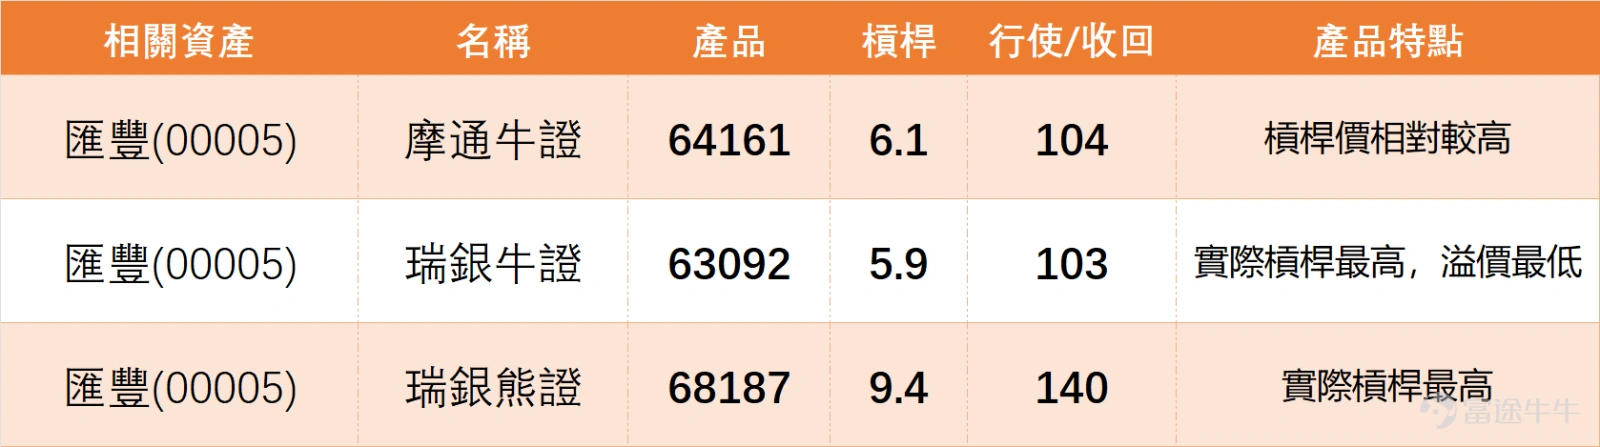
2. $UB#HSBC RP2604G.P (68187.HK)$: With an actual leverage as high as 9.4 times and a knock-out price of $140, it aligns with the current bearish technical signals for HSBC. It is suitable for short-term bearish investors who can tolerate high volatility risks. Close attention should be paid to resistance breakout situations to manage risk promptly.
What’s your view on HSBC's short-term trend? A. Overbought pullback, testing support at $124 first B. Strong consolidation, holding above $128 before moving higher C. Not sure, waiting for clearer news!Come to the comment section and share your thoughts! Want to see more analysis? Remember to follow 'HK Stock Warrants Jenny' for daily updates!
Disclaimer: This article does not constitute any investment advice.
This article is for reference only and does not constitute any investment advice. The market data, opinions, and analysis contained herein may change at any time without prior notice. We shall not be liable for any loss or damage arising from reliance on the information in this article. Technical analysis merely indicates whether certain technical conditions are met; a comprehensive evaluation of asset performance should incorporate additional data. Trading decisions should not be based solely on the content of this article. Please note that past performance is not indicative of future results.
#HongKongStocks #RealTimeAnalysis #WarrantsSelection #WarrantsStrategy #DerivativesHedging #HongKongWarrantsJenny #HSBCHoldings #BankingSector #TechnicalAnalysis
Risk Disclaimer: The above content only represents the author's view. It does not represent any position or investment advice of Futu. Futu makes no representation or warranty.Read more


Comment (1)
to post a comment
2