Technical Analysis of Seven Major US Tech Stocks (January 22): MAGS/NVIDIA/Microsoft/Apple/Amazon/Google/META/Tesla
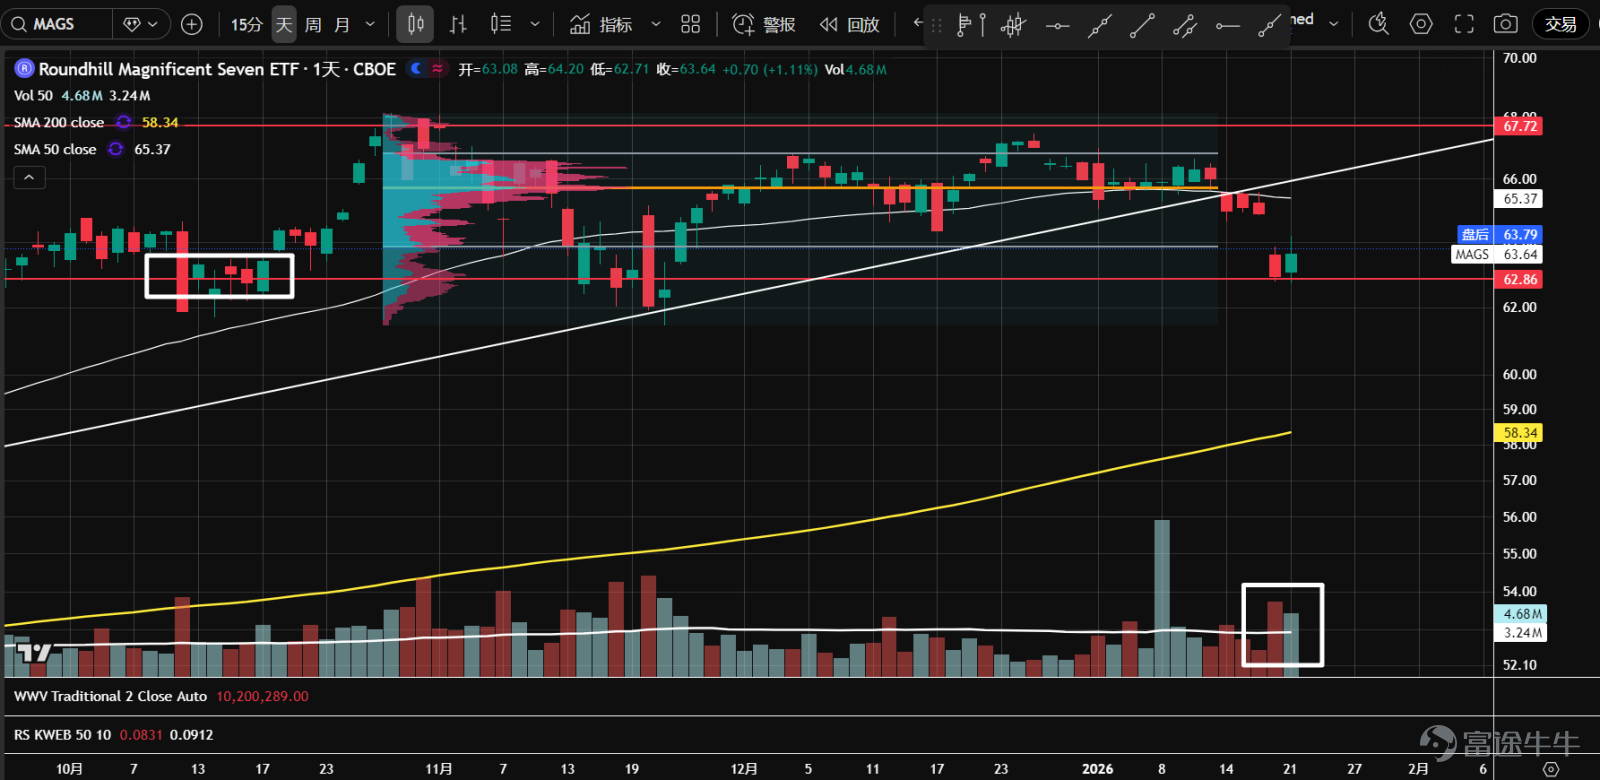
1. The ETF of the seven major tech stocks ( $Roundhill Magnificent Seven ETF (MAGS.US)$The price broke downward at the angle position. At the pivotal level around 62.8, there appeared a high-volume bearish candle followed by a bullish candle, indicating some buying support. Monitor the performance of the second test and wait for a buying opportunity.

2、 $NVIDIA (NVDA.US)$Continues to oscillate within a large range. Recently, trading volume has increased somewhat, with prices narrowly fluctuating near the volume control point (orange line); direction is unclear, suggesting observation.

3、 $Microsoft (MSFT.US)$After breaking below the top distribution range, it consolidated narrowly for nearly two months before continuing the downtrend. In recent days, trading volume has begun to expand, showing signs of major players entering. The downtrend has not reversed yet; wait for stabilization signals.

4、 $Apple (AAPL.US)$Continuing the downtrend, there were signs of panic selling at the 50% retracement level of the previous wave, with the K-line forming a lower shadow. Pay attention to the second test and wait for stabilization signals.

5、 $Amazon (AMZN.US)$After a high-volume upward breakout, the pullback was relatively deep. Currently, the price is at the volume control point (orange line) and remains above the uptrend line. The daily K-line shows a long lower shadow, suggesting a rebound may be imminent.

6、 $Alphabet-C (GOOG.US)$ It recently broke below the uptrend line and underperformed compared to the S&P 500. Trading volume has been gradually building at higher levels. If the stock price cannot rise quickly, it will form a P-shaped volume distribution, potentially leading to a consolidation phase.

7、 $Meta Platforms (META.US)$ After rebounding from the November low, it briefly reached the 61.8% retracement level of the current downtrend and faced resistance at the annual moving average before pulling back. It is now testing the previous low at 585.7 again, with significantly reduced trading volume compared to that time. The second test might succeed, eventually stabilizing.

8、 $Tesla (TSLA.US)$ Since September of last year, it has been consolidating. Currently, an outside bullish candle has appeared near the lower boundary of the value zone, with bearish momentum gradually decreasing. A potential rebound and stabilization might occur around this level.

$S&P 500 Index (.SPX.US)$ $SPDR S&P 500 ETF (SPY.US)$ $NASDAQ 100 Index (.NDX.US)$ $Invesco QQQ Trust (QQQ.US)$ $Dow Jones Industrial Average (.DJI.US)$ $State Street® SPDR® Dow Jones Industrial Average® ETF Trust (DIA.US)$ $Russell 2000 Index (.RUT.US)$ $iShares Russell 2000 ETF (IWM.US)$ $USD (USDindex.FX)$ $U.S. 10-Year Treasury Notes Yield (US10Y.BD)$ $XAU/USD (XAUUSD.CFD)$ $Bitcoin (BTC.CC)$ $Ethereum (ETH.CC)$
Risk Disclaimer: The above content only represents the author's view. It does not represent any position or investment advice of Futu. Futu makes no representation or warranty.Read more


Comment (1)
to post a comment
8
2