
Hong Kong-listed AI 'twin leaders' see active trading! How to position in the AI sector for the Year
Analysis of Short-term Key Level Trading Strategies After Baidu's Stock Price Hits a New High
$BIDU-SW (09888.HK)$Baidu's stock price has shown strong performance since entering 2026, climbing for several consecutive days and breaking through 154 yuan intraday on January 21, hitting a new high since August 2023. Behind this strong upward trend are positive international developments such as the implementation of autonomous driving services in the UAE, along with backing from major banks regarding the valuation of its AI cloud business and Kunlun chip spin-off. However, as the stock approaches key technical resistance levels, several short-term technical indicators have signaled clear overbought conditions, indicating that the market is at a critical juncture of long-term fundamental positivity and short-term technical adjustment pressures. This article will analyze the short-term trading landscape for Baidu’s stock price based on the latest market dynamics and technical data as of January 22, along with professional insights from [HKEX Podcast], while exploring strategic deployments using different terms of warrants and bull/bear certificates.
Technical Perspective: Key Resistance and Overbought Divergence After New Highs
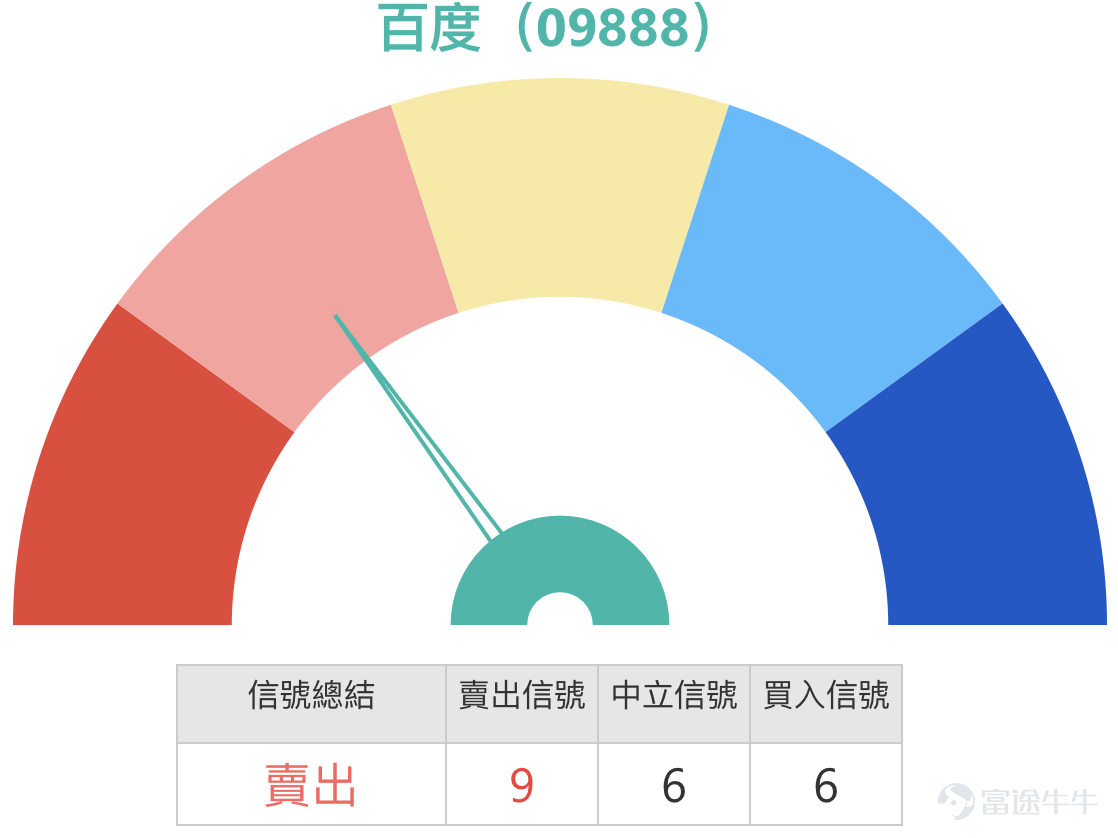
According to data as of January 21, after Baidu's stock price hit a new phase high, its key technical positions have become very clear. Above, the first resistance level is at 159.6 yuan, with the second resistance level at 168.2 yuan. Below, the first support level is at 142.4 yuan, with a stronger second support level at 129.8 yuan. This technical range aligns closely with the views presented in the January 21 [HKEX Podcast] (which highlighted the need to watch the 142.4 yuan support level), showing that this area has become the consensus battleground for both bulls and bears. Notably, while medium- to long-term trend indicators have issued 'buy' signals due to the stock price rise (such as MACD, Ichimoku Cloud, and Bollinger Bands), almost all short-term oscillation indicators have turned 'yellow.' Data shows that the 14-day Relative Strength Index (RSI) value has reached 70, entering the standard 'overbought' zone; Williams %R and Stochastic Oscillator indicators also signal 'overbought' or 'sell' conditions. This divergence between bullish mid-term trends and fully overbought short-term indicators typically suggests that volatility will significantly increase when the stock challenges key resistance levels, with risks of technical pullbacks accumulating. This corroborates the observation in [HKEX Podcast] about 'technical signals being predominantly sell-oriented, with potential short-term adjustments.' Additionally, Asta Financial Network's technical analysis noted that Baidu's stock exhibited a bullish 'Head and Shoulders Bottom' breakout early in its recent rally, providing important technical support for its strengthening mid-term trend.
Market Dynamics and [HKEX Podcast] Insights: Strategic Divergence Amid AI Value Reassessment
Baidu's stock price has recently demonstrated robust performance, supported by solid and multi-faceted fundamental catalysts. The most direct driver comes from the official launch of its autonomous driving service 'Luobo Fast Run' in Abu Dhabi, UAE, offering fully unmanned commercial operations to the public for the first time overseas. This marks a crucial step in the commercialization and international expansion of its technology, opening up new growth prospects for the company. Meanwhile, mainstream investment banks hold positive views on the transformation and revaluation of its core businesses. In its latest report, Citi raised Baidu's target price to $186 due to the anticipated value release from the upcoming IPO of its AI chip subsidiary 'Kunlun Chip,' reaffirming a 'Buy' rating. The market widely expects that the spin-off of Kunlun Chip will significantly enhance the market visibility and valuation of Baidu's overall AI business chain.
However, in the derivatives market, the deployment of capital reveals a tactical caution different from the bullish stock market trend. The [HK Stocks Podcast] column clearly pointed out on January 21 that although investors were pleased with the consecutive rise, some funds had started to worry that the rapid surge could trigger an adjustment and shifted their focus to put warrants products with an exercise price of approximately HK$168.98. This "long-term outlook with short-term action" market sentiment vividly reflects investors' pursuit of strong trends while being wary of short-term technical overbought conditions, thus demanding more refined risk management and strategic choices.
Review of Warrant Products: Leverage Effect Demonstrated in One-Way Market Conditions
In a clear upward trend, the characteristic of derivatives improving capital efficiency is fully demonstrated. Reviewing the Baidu-related bullish products mentioned on January 19, their performance over the next two trading days provided compelling evidence. At that time, the underlying stock rose 4.27% cumulatively, while related derivative products gained significantly higher returns due to their inherent leverage: J.P. Morgan Bull (64563) $JP#BAIDURC2703E.C (64563.HK)$ rose 29%, UBS Bull (66510) $UB#BAIDURC2612I.C (66510.HK)$ rose 27%, J.P. Morgan Call Warrant (21055) $MSBAIDU@EC2603C.C (21055.HK)$ rose 27%, Bank of China Call Warrant (17490) rose 23%.
![$BIDU-SW (09888.HK)$Baidu's stock price has shown strong performance since entering 2026, climbing for several consecutive days and breaking through 154 yuan intraday on January 21, hitting a new high since August 2023. Behind this strong upward trend are positive international developments such as the implementation of autonomous driving services in the UAE, along with backing from major banks regarding the valuation of its AI cloud business and Kunlun chip spin-off. However, as the stock approaches key technical resistance levels, several short-term technical indicators have signaled clear overbought conditions, indicating that the market is at a critical juncture of long-term fundamental positivity and short-term technical adjustment pressures. This article will analyze the short-term trading landscape for Baidu’s stock price based on the latest market dynamics and technical data as of January 22, along with professional insights from [HKEX Podcast], while exploring strategic deployments using different terms of warrants and bull/bear certificates. [Share Link: January 21 [Hong Kong Stock Podcast] Hang Seng Index, Bilibili, Sunny Optical, Baidu, Shandong Gold, CNOOC] Technical Perspective: Key Resistance and Overbought Divergence After New Highs According to data as of January 21, after Baidu's stock price hit a new phase high, its key technical positions have become very clear. Above, the first resistance level is at 159.6 yuan, with the second resistance level at 168.2 yuan. Below, the first support level is at 142.4 yuan, with a stronger second support level at 129.8 yuan. This technical range aligns closely with the views presented in the January 21 [HKEX Podcast] (which highlighted the need to watch the 142.4 yuan support level), showing that this area has become the consensus battleground for both bulls and bears. Notably, while medium- to long-term trend indicators have issued 'buy' signals due to the stock price rise (such as MACD, Ichimoku Cloud, and Bollinger Bands), almost all short-term oscillation indicators have turned 'yellow.' Data shows that the 14-day Relative Strength Index (RSI) value has reached 70, entering the standard 'overbought' zone; Williams %R and Stochastic Oscillator indicators also signal 'overbought' or 'sell' conditions. This divergence between bullish mid-term trends and fully overbought short-term indicators typically suggests that volatility will significantly increase when the stock challenges key resistance levels, with risks of technical pullbacks accumulating. This corroborates the observation in [HKEX Podcast] about 'technical signals being predominantly sell-oriented, with potential short-term adjustments.' Additionally, Asta Financial Network's technical analysis noted that Baidu's stock exhibited a bullish 'Head and Shoulders Bottom' breakout early in its recent rally, providing important technical support for its strengthening mid-term trend.](https://nnqimage.futunn.com/sns_client_feed/1162342/20260122/web-1769046763081-WpQQlq4qjO.png/big?area=1&is_public=true&imageMogr2/ignore-error/1/format/webp)
Product Strategy Choices in Current Market Conditions
Considering key technical levels, market views, and the characteristics of derivatives, investors can combine the terms of recommended products with key price points for targeted deployment based on their judgment of future market rhythm.
For investors who remain optimistic about the future market and believe that AI value revaluation logic will drive the stock price consolidation and break through the first resistance level at HK$159.6, call warrants or bull contracts can be considered. Among them, J.P. Morgan Call Warrant (21055) $MSBAIDU@EC2603C.C (21055.HK)$ with an exercise price of HK$166.1 and a leverage of 7.1 times has the advantage of "lowest premium and relatively high leverage," making it a cost-efficient choice for tracking potential upside movements. J.P. Morgan Bull (53764) has a recovery price of HK$135 and actual leverage of 6.5 times; its recovery price is far below the current market price and the first support level at HK$142.4, providing more than 10% of safety buffer space, suitable for investors who are bullish on the trend but want to hedge against short-term volatility risks.
![$BIDU-SW (09888.HK)$Baidu's stock price has shown strong performance since entering 2026, climbing for several consecutive days and breaking through 154 yuan intraday on January 21, hitting a new high since August 2023. Behind this strong upward trend are positive international developments such as the implementation of autonomous driving services in the UAE, along with backing from major banks regarding the valuation of its AI cloud business and Kunlun chip spin-off. However, as the stock approaches key technical resistance levels, several short-term technical indicators have signaled clear overbought conditions, indicating that the market is at a critical juncture of long-term fundamental positivity and short-term technical adjustment pressures. This article will analyze the short-term trading landscape for Baidu’s stock price based on the latest market dynamics and technical data as of January 22, along with professional insights from [HKEX Podcast], while exploring strategic deployments using different terms of warrants and bull/bear certificates. [Share Link: January 21 [Hong Kong Stock Podcast] Hang Seng Index, Bilibili, Sunny Optical, Baidu, Shandong Gold, CNOOC] Technical Perspective: Key Resistance and Overbought Divergence After New Highs According to data as of January 21, after Baidu's stock price hit a new phase high, its key technical positions have become very clear. Above, the first resistance level is at 159.6 yuan, with the second resistance level at 168.2 yuan. Below, the first support level is at 142.4 yuan, with a stronger second support level at 129.8 yuan. This technical range aligns closely with the views presented in the January 21 [HKEX Podcast] (which highlighted the need to watch the 142.4 yuan support level), showing that this area has become the consensus battleground for both bulls and bears. Notably, while medium- to long-term trend indicators have issued 'buy' signals due to the stock price rise (such as MACD, Ichimoku Cloud, and Bollinger Bands), almost all short-term oscillation indicators have turned 'yellow.' Data shows that the 14-day Relative Strength Index (RSI) value has reached 70, entering the standard 'overbought' zone; Williams %R and Stochastic Oscillator indicators also signal 'overbought' or 'sell' conditions. This divergence between bullish mid-term trends and fully overbought short-term indicators typically suggests that volatility will significantly increase when the stock challenges key resistance levels, with risks of technical pullbacks accumulating. This corroborates the observation in [HKEX Podcast] about 'technical signals being predominantly sell-oriented, with potential short-term adjustments.' Additionally, Asta Financial Network's technical analysis noted that Baidu's stock exhibited a bullish 'Head and Shoulders Bottom' breakout early in its recent rally, providing important technical support for its strengthening mid-term trend.](https://nnqimage.futunn.com/sns_client_feed/1162342/20260122/web-1769046793259-kD0HEWD9E0.jpeg/big?area=1&is_public=true&imageMogr2/ignore-error/1/format/webp)
Investors concerned about short-term technical overbought conditions and who agree with the [Hong Kong Stock Podcast] view that the stock price may retrace to test the support level at 142.4 yuan can consider put warrants or bearish certificates. The BOC Put Warrant (24326) and UBS Put Warrant (24276) both have an exercise price of 131.7 yuan, offering approximately 3.6x leverage. Their characteristic of having 'relatively lower premium' makes them cost-effective tools for hedging downside risks in long positions or capturing technical pullbacks. The JPMorgan Bear Certificate (66662) $JP#BAIDURP2710B.P (66662.HK)$ and HSBC Bear Certificate (65572) $HS#BAIDURP2807B.P (65572.HK)$ have their recovery prices set at 160 yuan, close to the first resistance level at 159.6 yuan, with actual leverage reaching as high as 17.1x and 17.7x respectively. These high-leverage bear certificates are powerful instruments for betting on a precise pullback at key resistance levels, but high leverage also means extreme sensitivity to underlying stock fluctuations, posing higher risks, suitable only for investors who can closely monitor market conditions and have strong risk tolerance.
![$BIDU-SW (09888.HK)$Baidu's stock price has shown strong performance since entering 2026, climbing for several consecutive days and breaking through 154 yuan intraday on January 21, hitting a new high since August 2023. Behind this strong upward trend are positive international developments such as the implementation of autonomous driving services in the UAE, along with backing from major banks regarding the valuation of its AI cloud business and Kunlun chip spin-off. However, as the stock approaches key technical resistance levels, several short-term technical indicators have signaled clear overbought conditions, indicating that the market is at a critical juncture of long-term fundamental positivity and short-term technical adjustment pressures. This article will analyze the short-term trading landscape for Baidu’s stock price based on the latest market dynamics and technical data as of January 22, along with professional insights from [HKEX Podcast], while exploring strategic deployments using different terms of warrants and bull/bear certificates. [Share Link: January 21 [Hong Kong Stock Podcast] Hang Seng Index, Bilibili, Sunny Optical, Baidu, Shandong Gold, CNOOC] Technical Perspective: Key Resistance and Overbought Divergence After New Highs According to data as of January 21, after Baidu's stock price hit a new phase high, its key technical positions have become very clear. Above, the first resistance level is at 159.6 yuan, with the second resistance level at 168.2 yuan. Below, the first support level is at 142.4 yuan, with a stronger second support level at 129.8 yuan. This technical range aligns closely with the views presented in the January 21 [HKEX Podcast] (which highlighted the need to watch the 142.4 yuan support level), showing that this area has become the consensus battleground for both bulls and bears. Notably, while medium- to long-term trend indicators have issued 'buy' signals due to the stock price rise (such as MACD, Ichimoku Cloud, and Bollinger Bands), almost all short-term oscillation indicators have turned 'yellow.' Data shows that the 14-day Relative Strength Index (RSI) value has reached 70, entering the standard 'overbought' zone; Williams %R and Stochastic Oscillator indicators also signal 'overbought' or 'sell' conditions. This divergence between bullish mid-term trends and fully overbought short-term indicators typically suggests that volatility will significantly increase when the stock challenges key resistance levels, with risks of technical pullbacks accumulating. This corroborates the observation in [HKEX Podcast] about 'technical signals being predominantly sell-oriented, with potential short-term adjustments.' Additionally, Asta Financial Network's technical analysis noted that Baidu's stock exhibited a bullish 'Head and Shoulders Bottom' breakout early in its recent rally, providing important technical support for its strengthening mid-term trend.](https://nnqimage.futunn.com/sns_client_feed/1162342/20260122/web-1769046786355-nLR1o4o2Ro.jpeg/big?area=1&is_public=true&imageMogr2/ignore-error/1/format/webp)
Overall, driven by the robust fundamentals of its AI and autonomous driving businesses, Baidu’s share price has reached new highs. However, the comprehensive overbought signal from short-term technical indicators and the proximity to key resistance levels indicate that volatility may intensify. Investors can refer to the sharp insights into market sentiment from the [Hong Kong Stock Podcast], and based on their own judgment of future market rhythms, implement strategies using different terms of warrants and bull/bear certificates. It is crucial to correlate the exercise and recovery prices of these products with key support and resistance levels from technical analysis, fully understand how terms like 'premium' impact investment costs, and manage risks effectively.
#LearnWarrantsAndBullBearCertificatesWithJenny#: In-depth analysis of the impact of 'premium' on investment costs
When choosing warrants, in addition to exercise price, expiry date, and leverage ratio, 'premium' is a critical term that directly affects investment cost. Premium represents the additional percentage cost investors pay above the intrinsic value (i.e., the difference between the stock price and the exercise price). It can be understood as the 'entry fee' for obtaining leverage, which includes time value and the issuer's expected risk cost.
Taking the recommended Morgan Call Warrant (21055) as an example, its defining feature is the 'lowest premium.' This means that compared to other similar call warrants, investors pay a smaller proportion of extra cost when purchasing this product, making its price closer to the actual leverage value of the product. When the underlying stock rises, a lower premium helps the product price track the stock increase more closely, reducing potential erosion of returns due to cost. Conversely, products with excessively high premiums might lag in performance even if the underlying stock rises due to the high 'entry fee.' Therefore, when comparing products with similar terms, choosing one with a lower premium is usually key to controlling costs and improving investment efficiency.
Interactive Question: With strong fundamental tailwinds coexisting with clear technical overbought signals, do you think Baidu's stock price will first successfully break through the first resistance level at 159.6 yuan, riding on the momentum of AI valuation re-rating; or will it undergo a technical correction, retracing to test the first support level at 142.4 yuan? In this complex situation, would you prefer to follow the trend using low-premium call warrants, or consider leveraging high-leverage bear certificates for short-term trading? Feel free to share your insights in the comments section.
For more detailed explanations of Hong Kong stock warrant and bull/bear certificate terms and market dynamics analysis, please follow @HKStockWarrantsJenny
Disclaimer: This article does not constitute any investment advice.
This article is for reference only and does not constitute any investment advice. The market data, opinions, and analysis contained herein may change at any time without prior notice. We shall not be liable for any loss or damage arising from reliance on the information in this article. Technical analysis merely indicates whether certain technical conditions are met; a comprehensive evaluation of asset performance should incorporate additional data. Trading decisions should not be based solely on the content of this article. Please note that past performance is not indicative of future results.
#Baidu #TechnicalAnalysis #SupportResistanceLevels #Warrants #BullBearCertificates #Premium #AI #AutonomousDriving #HKStockStrategy #DerivativesStrategy
Risk Disclaimer: The above content only represents the author's view. It does not represent any position or investment advice of Futu. Futu makes no representation or warranty.Read more

Comments
to post a comment
1
8