
Dividend Income Cheat Sheet: June Dividend Season Is Here—Earn Up to HK$1,596 Per Lot!
21.1.2026 Southern China Covered Call


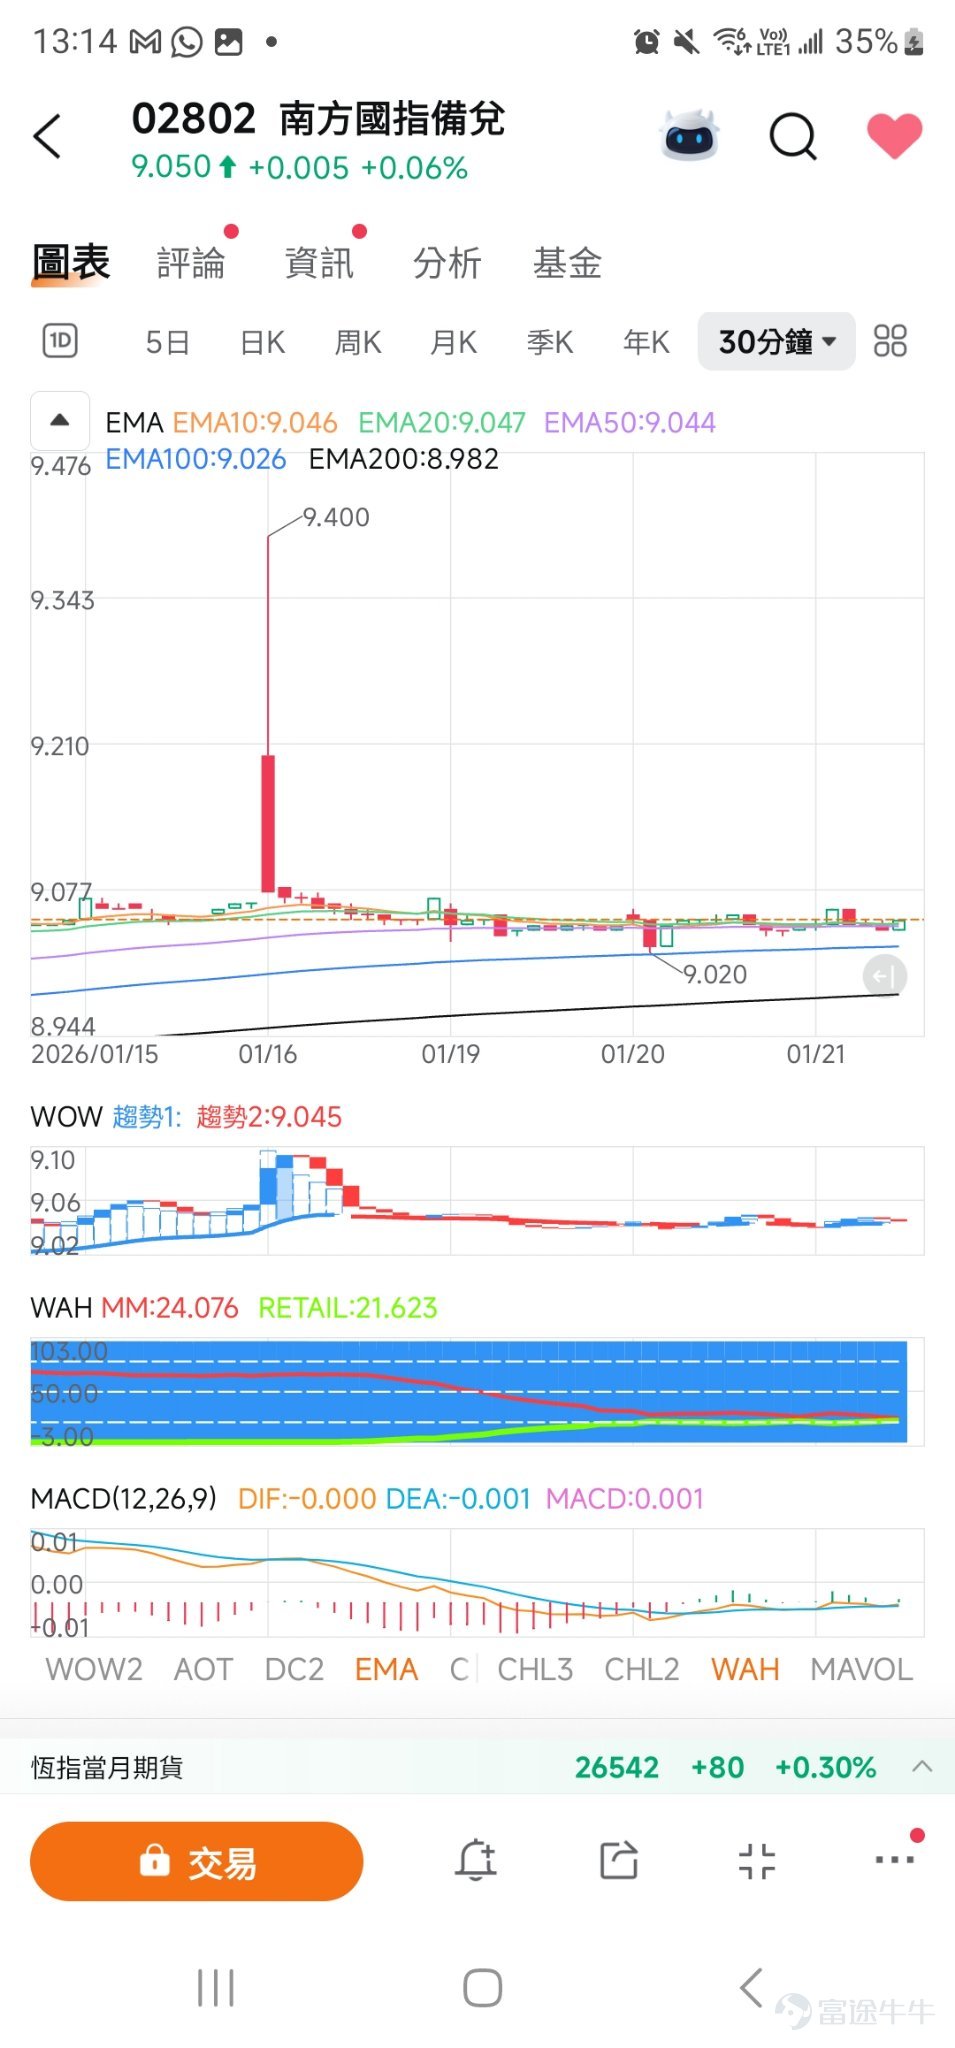
· Price Performance: The current price is 9.055, a slight increase of +0.11%, showing a mild upward trend in the short term.
· EMA Moving Average System:
· EMA10 (9.027) and EMA20 (8.979) are both higher than the long-term moving averages (EMA50, 100, 200), indicating stronger short-term momentum.
· The overall moving average shows a bullish alignment (EMA10 > EMA20 > EMA50 > EMA100 > EMA200), supporting a medium-term upward trend.
· MACD Indicator:
· DIF (0.061) is slightly higher than DEA (0.056), and the MACD histogram is positive (0.010), indicating a minor increase in buying momentum, but the magnitude is limited, requiring further observation to see if it will expand.
2. WOW Analysis (Trend Strength and Key Levels)
· Trend 1: The price is near the recent high of 9.088. If this resistance is broken, it may further test 9.283 (high point on the line chart).
· Trend 2: Support below refers to EMA20 (8.979) and EMA50 (8.903). If the pullback does not break the support, the trend remains bullish.
3. WAH Analysis (Market Capital Flow & Sentiment)
· MM (Institutional Capital): The indicator is as high as 94.700, indicating concentrated institutional positions and strong confidence in this ETF.
· RETAIL (Retail Capital): Currently at 0.000, retail participation is low, possibly reflecting that market attention has not yet expanded, leaving significant potential buying space.
4. Future Direction Forecast
· Short-term (1-4 weeks): If the resistance at 9.088 is broken, it may challenge the 9.283–9.400 range; if there is a pullback, focus on the support zone at 8.979–8.903.
· Medium-term (1-3 months): The bullish alignment of moving averages and concentrated institutional capital are favorable for the continuation of the trend. Pay attention to the overall sentiment of Hong Kong stocks and the performance of constituent stocks (such as Alibaba and Tencent).
· Risk Warning: MACD momentum is still weak. If it breaks below EMA50, it may turn into range-bound fluctuations.
---
A good choice for long-term investment
1. High dividend yield advantage: As a 'Covered Call ETF,' income is enhanced through options strategies, providing relatively stable dividends, suitable for investors seeking cash flow.
2. Concentrated holdings in high-quality leading companies: The top ten holdings account for 41.86%, focusing on Alibaba $BABA-W (09988.HK)$ , Tencent $TENCENT (00700.HK)$ , and blue-chip stocks such as China Construction Bank, with solid fundamentals.
2. Concentrated holdings in high-quality leading companies: The top ten holdings account for 41.86%, focusing on Alibaba $BABA-W (09988.HK)$ , Tencent $TENCENT (00700.HK)$ , and blue-chip stocks such as China Construction Bank, with solid fundamentals.
3. Risk diversification: A basket of investments in the constituent stocks of the state-owned enterprise index, spreading individual stock risks while following the long-term growth trend of China’s economy.
4. Preferred by large investors: The WAH indicator shows significant positions held by large investors, reflecting institutional investors' recognition of its long-term value.
5. Technical support from trend indicators: Bullish alignment of moving averages with steady upward price movement provides technical support.
CSOP FTSE China State-Owned Enterprises Index Covered Call (02802) combines three key advantages: dividend income, exposure to leading enterprises, and technical momentum. It is suitable for long-term holding to gain stable dividends and capital appreciation. It is recommended to gradually build positions when there is a pullback to EMA support levels and keep an eye on constituent stocks' performance and overall market direction in Hong Kong stocks.
Risk Disclaimer: The above content only represents the author's view. It does not represent any position or investment advice of Futu. Futu makes no representation or warranty.Read more


Comments
to post a comment
11
2