Technical Analysis of Chinese Stocks (January 21): Alibaba/Baidu/Bilibili/Futu/PDD Holdings/Tencent Music/NetEase/JD.com/Tencent/Meituan/Kuaishou/Xiaomi
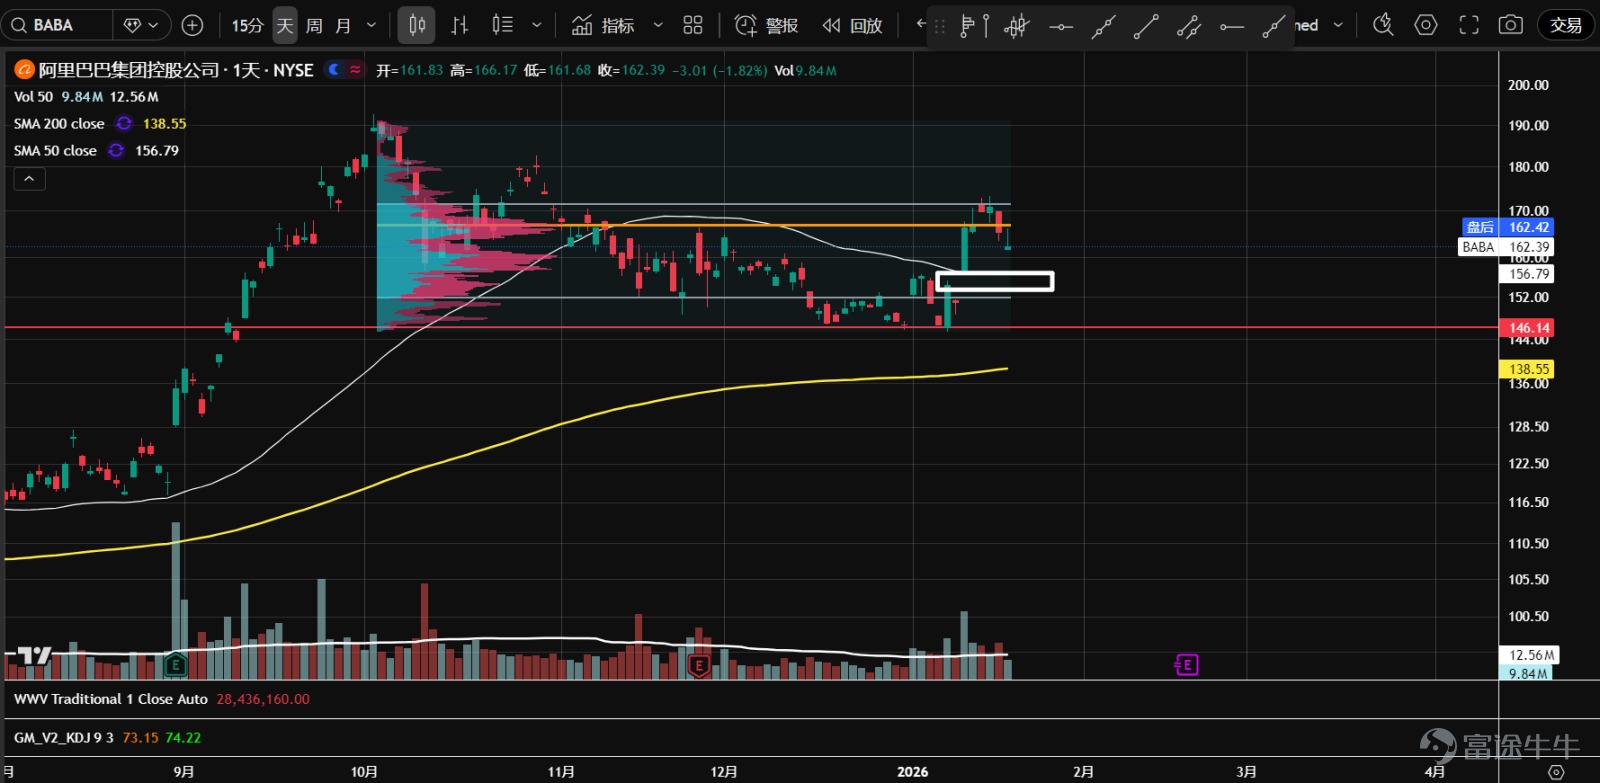
1、 $Alibaba (BABA.US)$ After several weeks of sideways consolidation, a volume-driven rebound began in early January from the support level around 146, but it encountered resistance at the upper boundary of the value range. Currently in a volume-decreasing pullback, focus is on whether the 50-day moving average and the gap area around 155 can stabilize.

2、 $Baidu (BIDU.US)$ After three months of sideways consolidation, this month saw a volume surge breaking through an ascending triangle. It is currently temporarily facing resistance near the previous high of 150.5. Price and volume are entering a bullish cycle, significantly outperforming the S&P 500; waiting for opportunities to buy on dips.

3、 $Bilibili (BILI.US)$ After retesting and stabilizing at the 24.35 level in December, there was a large-volume rebound that quickly broke through resistance around the previous high of 32. The aggressive price surge led to a pullback, forming a false breakout. Short-term support focuses on the upper boundary of the value range, near 28.5.

4、 $Futu Holdings Ltd (FUTU.US)$Continuing to consolidate sideways, forming a P-shaped volume distribution, with increasing divergence between bulls and bears at higher levels. The stock price is currently near the Volume Control Point (orange line), direction unclear. Overall trading volume is gradually declining, and entering a bullish price-volume cycle, accumulation is highly possible.

5、 $PDD Holdings (PDD.US)$ Since 2024, it has been trading within a large consolidation range. After New Year, it faced resistance at the 123 axis level and experienced heavy selling pressure, breaking below the 109.5 support. Supply expanded, significantly underperforming the Chinese stock index; the technical trend is extremely weak, suggesting caution.

6、 $Tencent Music (TME.US)$ The continuous weak trend found support at the 38.2% level of the previous round, with trading volume starting to expand. Watch for stabilization; it's not advisable to bottom-fish before a breakout above the new downtrend line.

7、 $NetEase (NTES.US)$ Continued range-bound sideways movement, with recent rebounds blocked by the upper boundary of the value range. Currently heading towards the converging point, temporary support has been achieved. Overall trading volume remains low, but the bottom is gradually rising, indicating a likely accumulation zone.

8、 $JD.com (JD.US)$ After breaking through the key support around 30 with high volume in November last year, it entered a sustained narrow range fluctuation. A small rebound appeared recently but was met with resistance at the lower boundary of the previous value range. The market may continue its downward trend.

9、 $TENCENT (00700.HK)$ Range-bound sideways movement, with recent rebounds blocked by the upper boundary of the value range. After a week of consecutive declines, it stabilized around the 600 support level. Trading volume increased overall, with intense competition between buyers and sellers; temporarily observe.

10、 $MEITUAN-W (03690.HK)$ Since September last year, the stock entered a sideways consolidation and formed a b-shaped volume distribution, reflecting increased buyer-seller divergence at lower levels. It is currently oscillating with heavy volume near the Volume Control Point (orange line), with an unclear direction; observation is recommended.

11、 $KUAISHOU-W (01024.HK)$ After a second test with reduced volume at the support level around 62.6, it entered a high-volume upward phase with a positive price-volume cycle. Currently facing resistance near 82, the stock price experienced a short-term volume decrease during pullbacks, presenting a potential buying opportunity on dips.

12、 $XIAOMI-W (01810.HK)$ Since the start of the downtrend in September last year, panic selling occurred around the 36.9 axis level. During this second test, although new lows were made, the trading volume was significantly lower compared to the sharp drop in November, possibly forming a false downside breakout. Temporarily observe before a breakout above the downtrend line.

$S&P 500 Index (.SPX.US)$ $SPDR S&P 500 ETF (SPY.US)$ $NASDAQ 100 Index (.NDX.US)$ $Invesco QQQ Trust (QQQ.US)$ $Dow Jones Industrial Average (.DJI.US)$ $State Street® SPDR® Dow Jones Industrial Average® ETF Trust (DIA.US)$ $Russell 2000 Index (.RUT.US)$ $iShares Russell 2000 ETF (IWM.US)$ $Hang Seng Index (800000.HK)$ $Hang Seng TECH Index (800700.HK)$ $Hang Seng TECH Index ETF (03032.HK)$ $KraneShares CSI China Internet ETF (KWEB.US)$ $Direxion Daily FTSE China Bull 3X Shares ETF (YINN.US)$ $Direxion Daily FTSE China Bear 3X Shares ETF (YANG.US)$ $Invesco China Technology ETF (CQQQ.US)$
Risk Disclaimer: The above content only represents the author's view. It does not represent any position or investment advice of Futu. Futu makes no representation or warranty.Read more


Comment (1)
to post a comment
13
1