From the perspective of the Hong Kong stocks Podcast: Why be cautious about the 'time decay trap' in short-term high-leverage derivatives?
As of January 20, 2026, after hitting a recent high, HSBC Holdings (00005.HK) has entered a critical adjustment and consolidation phase. The market is carefully assessing the tension between its short-term technical movements as a leading Hang Seng blue-chip stock and its long-term fundamental value. This article will integrate the latest technical indicators, market news updates, and core insights from the [Hong Kong Stocks Podcast] column to analyze HSBC’s short-term trading landscape and provide prudent strategies for using derivatives in an uncertain market direction.
I. Technical Analysis: High-level pullback tests key support; market signals show divergence
Observing the technical charts, HSBC's share price touched a high of around HKD 130 in early January but failed to sustain the upward momentum. On January 19, it saw a correction and closed at HKD 127. This movement validates the [Hong Kong Stocks Podcast]'s view that the “short-term outlook is not optimistic.” The share price is currently retreating to test a series of key technical moving averages: the 10-day moving average is near HKD 124.29, while the more medium-term significant 50-day moving average is at HKD 113.58. The current share price is hovering near the 10-day line, indicating a weakening of short-term upward momentum and a slightly sluggish trend.
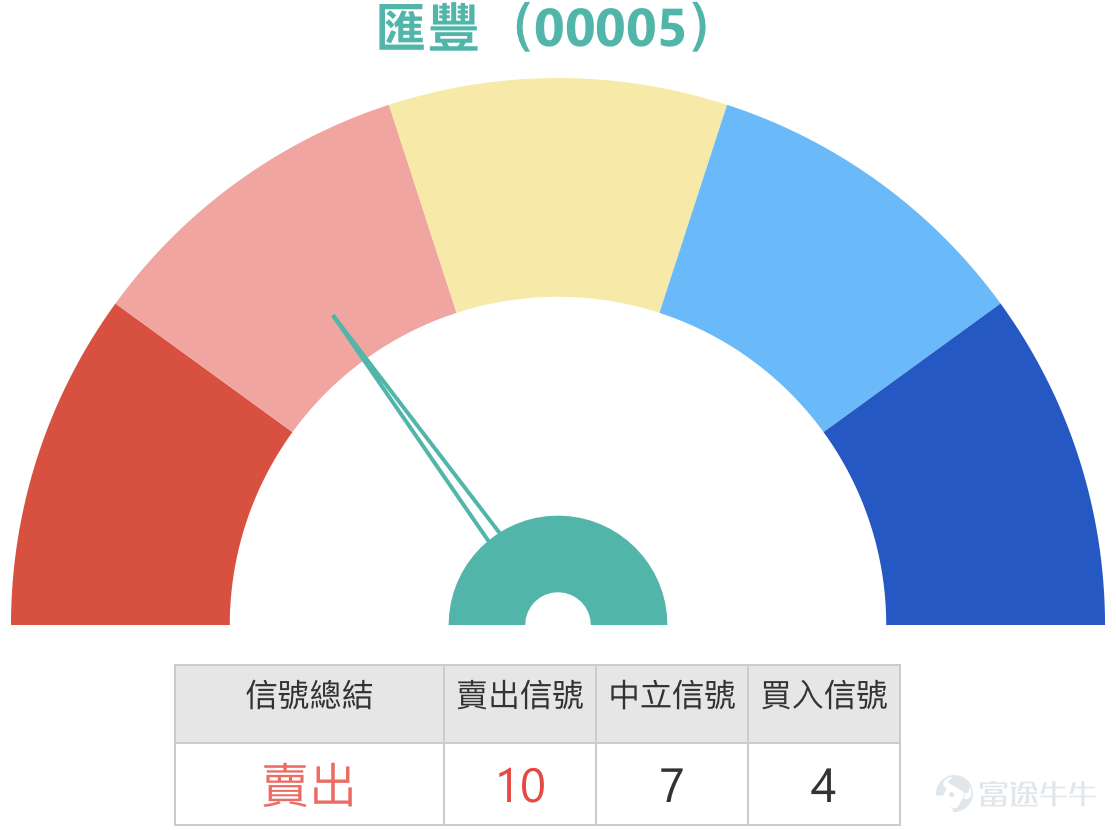
However, there are divergences in market technical signals, which exacerbates the uncertainty in the short-term trend. On one hand, multiple indicators suggest downward pressure. The Relative Strength Index (RSI-14) stands at 63, still within the bullish zone, but has retreated from higher levels; as summarized by the [Hong Kong Stocks Podcast], the number of “sell” signals clearly dominates among technical indicators. On the other hand, the current pullback remains within a technically reasonable range. Based on Fibonacci retracement analysis, a retreat from the recent high of HKD 129.5 yields a key support level at HKD 118.08. The current share price consolidating above this key level can be seen as a typical technical correction within an uptrend. Several oscillators showing “neutral” signals also reflect a temporary balance between bulls and bears at this point.
Thus, clear key price levels have become the focus for determining future direction. Below, the first crucial line of defense is at 123.1 yuan, a position that not only represents prior platform support but also closely aligns with the middle Bollinger Band and the 10-day moving average zone; losing it would imply deepening correction. A stronger second support level lies in the 118-118.9 yuan range, corresponding to the golden ratio key level and long-term trendline, making it extremely significant technically. Above, short-term rebound resistance is initially located at 131 yuan, and if broken through, there's potential to challenge the previous high of 135-135.1 yuan again, which is also the technical target given by independent stock commentator Mr. Yu Junlong.
![As of January 20, 2026, after hitting a recent high, HSBC Holdings (00005.HK) has entered a critical adjustment and consolidation phase. The market is carefully assessing the tension between its short-term technical movements as a leading Hang Seng blue-chip stock and its long-term fundamental value. This article will integrate the latest technical indicators, market news updates, and core insights from the [Hong Kong Stocks Podcast] column to analyze HSBC’s short-term trading landscape and provide prudent strategies for using derivatives in an uncertain market direction. I. Technical Analysis: High-level pullback tests key support; market signals show divergence Observing the technical charts, HSBC's share price touched a high of around HKD 130 in early January but failed to sustain the upward momentum. On January 19, it saw a correction and closed at HKD 127. This movement validates the [Hong Kong Stocks Podcast]'s view that the “short-term outlook is not optimistic.” The share price is currently retreating to test a series of key technical moving averages: the 10-day moving average is near HKD 124.29, while the more medium-term significant 50-day moving average is at HKD 113.58. The current share price is hovering near the 10-day line, indicating a weakening of short-term upward momentum and a slightly sluggish trend. [Share Link: January 19 [Hong Kong Stock Podcast] Hang Seng Index, Zijin Mining, BYD, Baidu Group, HSBC] However, there are divergences in market technical signals, which exacerbate uncertainty in the short-term trend...](https://nnqimage.futunn.com/sns_client_feed/1162342/20260120/web-1768880207225-OtC3KpyQq6.png/big?area=1&is_public=true&imageMogr2/ignore-error/1/format/webp)
Review and Strategy Value of Warrants
Reviewing recent performance in the derivatives market, it can be observed that when the underlying stock exhibits clear but moderate one-way volatility, the leverage effect of derivatives can effectively amplify investment returns. Taking the two bull certificates mentioned on January 14 as examples, against the backdrop of the underlying stock rising 1.18% over the following two trading days, J.P. Morgan bull certificate (63251) $JP#HSBC RC2809A.C (63251.HK)$ and UBS Group bull certificate (63092) $UB#HSBC RC2809B.C (63092.HK)$ both recorded price increases of approximately 8%.
![As of January 20, 2026, after hitting a recent high, HSBC Holdings (00005.HK) has entered a critical adjustment and consolidation phase. The market is carefully assessing the tension between its short-term technical movements as a leading Hang Seng blue-chip stock and its long-term fundamental value. This article will integrate the latest technical indicators, market news updates, and core insights from the [Hong Kong Stocks Podcast] column to analyze HSBC’s short-term trading landscape and provide prudent strategies for using derivatives in an uncertain market direction. I. Technical Analysis: High-level pullback tests key support; market signals show divergence Observing the technical charts, HSBC's share price touched a high of around HKD 130 in early January but failed to sustain the upward momentum. On January 19, it saw a correction and closed at HKD 127. This movement validates the [Hong Kong Stocks Podcast]'s view that the “short-term outlook is not optimistic.” The share price is currently retreating to test a series of key technical moving averages: the 10-day moving average is near HKD 124.29, while the more medium-term significant 50-day moving average is at HKD 113.58. The current share price is hovering near the 10-day line, indicating a weakening of short-term upward momentum and a slightly sluggish trend. [Share Link: January 19 [Hong Kong Stock Podcast] Hang Seng Index, Zijin Mining, BYD, Baidu Group, HSBC] However, there are divergences in market technical signals, which exacerbate uncertainty in the short-term trend...](https://nnqimage.futunn.com/sns_client_feed/1162342/20260120/web-1768880106159-N5MylJPmBF.png/big?area=1&is_public=true&imageMogr2/ignore-error/1/format/webp)
Derivatives Deployment Strategies under Current Market Conditions
At this critical technical juncture where the stock is 'long-term bullish but short-term correcting', deploying derivatives must deeply bind product terms to the aforementioned key support/resistance levels while strictly adhering to risk control discipline.
Warrant (Call/Put) Product Analysis:
For investors who firmly believe in long-term value and anticipate that the stock will resume its upward trajectory after adjustment, they may consider call warrants with strike prices near the upper resistance area. For instance, BOC call warrant 23691 (strike price 148.1 yuan) and 22630 (strike price 145.1 yuan). These strike prices are significantly higher than the second resistance level at 135.1 yuan, qualifying them as deep out-of-the-money terms. This implies these products are not intended for betting on minor stock rebounds but are suited for highly optimistic investors expecting the stock to strongly break through all previous resistances and initiate a new uptrend. If the stock merely oscillates within the 131-135 yuan range, the time value of these deep out-of-the-money warrants will rapidly erode. Investors bearish on the short term and anticipating deeper corrections may consider put warrants. UBS Group put warrant 23923 (strike price 111.78 yuan) and BOC put warrant 24062 (strike price 111.98 yuan), with their strike prices close to the second support zone of 118-118.9 yuan, aiming to capture potential gains from a deep pullback to strong support.
![As of January 20, 2026, after hitting a recent high, HSBC Holdings (00005.HK) has entered a critical adjustment and consolidation phase. The market is carefully assessing the tension between its short-term technical movements as a leading Hang Seng blue-chip stock and its long-term fundamental value. This article will integrate the latest technical indicators, market news updates, and core insights from the [Hong Kong Stocks Podcast] column to analyze HSBC’s short-term trading landscape and provide prudent strategies for using derivatives in an uncertain market direction. I. Technical Analysis: High-level pullback tests key support; market signals show divergence Observing the technical charts, HSBC's share price touched a high of around HKD 130 in early January but failed to sustain the upward momentum. On January 19, it saw a correction and closed at HKD 127. This movement validates the [Hong Kong Stocks Podcast]'s view that the “short-term outlook is not optimistic.” The share price is currently retreating to test a series of key technical moving averages: the 10-day moving average is near HKD 124.29, while the more medium-term significant 50-day moving average is at HKD 113.58. The current share price is hovering near the 10-day line, indicating a weakening of short-term upward momentum and a slightly sluggish trend. [Share Link: January 19 [Hong Kong Stock Podcast] Hang Seng Index, Zijin Mining, BYD, Baidu Group, HSBC] However, there are divergences in market technical signals, which exacerbate uncertainty in the short-term trend...](https://nnqimage.futunn.com/sns_client_feed/1162342/20260120/web-1768880114575-3ZpCDjQmbq.jpeg/big?area=1&is_public=true&imageMogr2/ignore-error/1/format/webp)
Bull and Bear Certificate Product Analysis:
Bull and bear certificates, due to their mandatory recall mechanisms, require cautious selection of terms, ensuring ample safety margins for daily stock fluctuations. For investors optimistic about the market outlook and seeking opportunities amid adjustments, choosing bull certificates with recall prices well below key technical support levels is advised. For example, UBS Group bull certificate 63092 (recall price 103 yuan) and J.P. Morgan bull certificate 63251 (recall price 102 yuan). These recall prices are far below the first support level at 123.1 yuan and the second support level at 118.9 yuan, providing substantial safety buffers ideal for those viewing the current correction as normal retracement unlikely to result in significant declines. For investors bearish on the short term and expecting weak rebounds leading to further downside tests, choosing bear certificates with recall prices significantly above key technical resistance levels is appropriate. Societe Generale bear certificate 67929 has a recall price of 133.3 yuan, slightly above the first resistance level at 131 yuan but below the previous high at 135 yuan. This design suits scenarios where the stock fails to break above previous highs and retreats, though investors should clearly recognize that if the stock sharply rebounds and hits the recall price, the product will be forcibly recalled. $UB#HSBC RC2809B.C (63092.HK)$$JP#HSBC RC2809A.C (63251.HK)$
![As of January 20, 2026, after hitting a recent high, HSBC Holdings (00005.HK) has entered a critical adjustment and consolidation phase. The market is carefully assessing the tension between its short-term technical movements as a leading Hang Seng blue-chip stock and its long-term fundamental value. This article will integrate the latest technical indicators, market news updates, and core insights from the [Hong Kong Stocks Podcast] column to analyze HSBC’s short-term trading landscape and provide prudent strategies for using derivatives in an uncertain market direction. I. Technical Analysis: High-level pullback tests key support; market signals show divergence Observing the technical charts, HSBC's share price touched a high of around HKD 130 in early January but failed to sustain the upward momentum. On January 19, it saw a correction and closed at HKD 127. This movement validates the [Hong Kong Stocks Podcast]'s view that the “short-term outlook is not optimistic.” The share price is currently retreating to test a series of key technical moving averages: the 10-day moving average is near HKD 124.29, while the more medium-term significant 50-day moving average is at HKD 113.58. The current share price is hovering near the 10-day line, indicating a weakening of short-term upward momentum and a slightly sluggish trend. [Share Link: January 19 [Hong Kong Stock Podcast] Hang Seng Index, Zijin Mining, BYD, Baidu Group, HSBC] However, there are divergences in market technical signals, which exacerbate uncertainty in the short-term trend...](https://nnqimage.futunn.com/sns_client_feed/1162342/20260120/web-1768880121826-5vJHNY7N7g.jpeg/big?area=1&is_public=true&imageMogr2/ignore-error/1/format/webp)
#LearnWarrantsAndBullBearCertificatesWithJenny# Key Insights: High Leverage Traps and Expiration Risks
In the [Hong Kong Stock Podcast], a common misconception about choosing derivatives was particularly emphasized: being attracted by the seemingly high leverage while ignoring the expiration date. The program explicitly pointed out that 'some products appear to have a leverage ratio as high as 15-16 times... but most of these are short-term products expiring at the end of March this year, carrying higher potential risks.' This is because the time value of short-term out-of-the-money options decays extremely quickly. Even if an investor correctly predicts the direction of the underlying stock, they may still incur losses due to time decay if the stock doesn’t rise significantly in the short term. Therefore, the idea that 'the higher the leverage, the better' is a dangerous misconception. Investors must align the expiration dates with their expected holding periods to avoid a situation where they 'win on direction but lose on time.'
Feel free to share your insights and trading logic in the comments section. Derivatives are high-risk investment products, and their prices can rise or fall sharply; investors may lose all of their principal. Before making any investment decisions, be sure to carefully read the relevant listing documents to fully understand the product characteristics and risks (including time value decay, implied volatility changes, and forced recall mechanisms). For more real-time analysis and in-depth interpretation of Hong Kong stocks and derivatives, follow "Hong Kong Warrants Jenny".
#HSBC Holdings #00005 #Technical Analysis #Support and Resistance Levels #Warrants #Bull and Bear Certificates #Privatization #Business Review #Market Capitalization Outlook #Hong Kong Blue Chips
Disclaimer: The content of this article is based on public information for analysis purposes only and is provided for investor reference. It does not constitute any investment advice or offer to buy/sell. Financial markets carry significant risks, and the prices of structured products can fluctuate dramatically, potentially leading to the total loss of invested capital. Investors should fully understand the product features and risks and seek independent professional advice before making any investment decisions.
Risk Disclaimer: The above content only represents the author's view. It does not represent any position or investment advice of Futu. Futu makes no representation or warranty.Read more
Comments
to post a comment