

Hong Kong-listed AI 'twin leaders' see active trading! How to position in the AI sector for the Year
January 19 [Hong Kong Stock Podcast] Hang Seng Index, Zijin Mining, BYD, Baidu Group, HSBC
Dear investors, in this episode, we bring you an analysis of the overall performance of the Hong Kong stock market on January 19 and a detailed look at key stocks.
On that day, the Hang Seng Index $Hang Seng Index (800000.HK)$ showed a significant downward trend but eventually held above the critical level of 26,500 points, closing at 26,563 points. The intraday low also did not break below this threshold. Although the index fell sharply, the overall volatility was relatively limited. Notably, market trading volume shrank, which is considered a positive signal during a downturn — if selling pressure were to intensify alongside rising volume, it would indicate a potentially weaker subsequent trend.
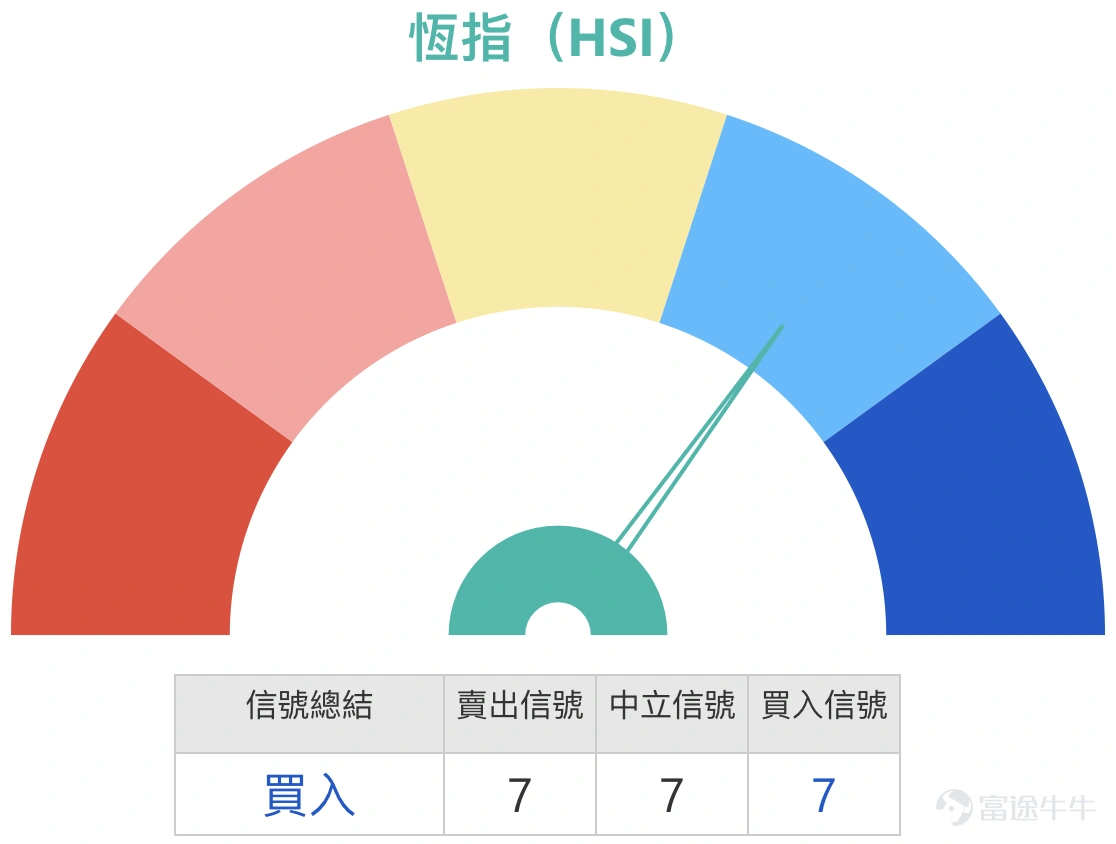
From a market sentiment perspective, investors are currently leaning towards caution. Some market participants worry that the index may subsequently drop to the 25,800-point range, while some funds have opted to exit and observe, further exacerbating short-term selling pressure. However, from a technical signal analysis, there appears to be a degree of optimism in the short-term market sentiment. The term 'short-term' here does not specifically refer to the next day’s trend but rather reflects an overall bullish 'buy' signal in short-term technical indicators, with buying signals holding a relative advantage. It is important to emphasize that this signal does not predict an immediate significant rebound in the index; it only indicates that short-term market sentiment is temporarily in a relatively optimistic state.
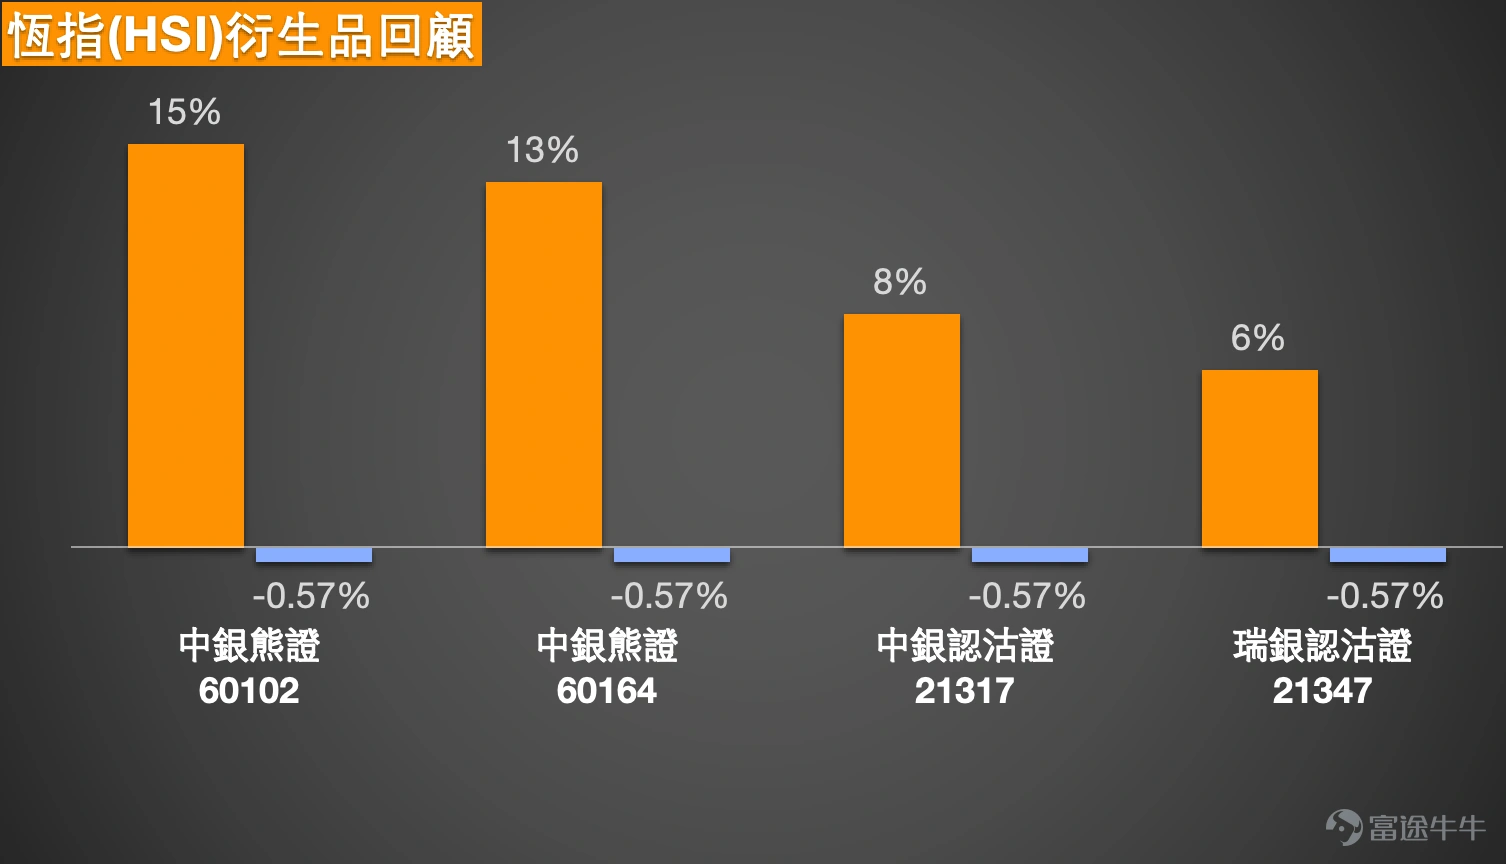
In terms of support levels, the Hang Seng Index's short-term support lies around 26,032 points. If this level is breached, the index will likely drop further to near 25,500 points. Investors should closely monitor whether the index can hold above the middle line of the Bollinger Bands. Observing the daily chart, the Hang Seng Index has been trading above the middle line of the Bollinger Bands for an extended period. If it continues to stay above this level, the market trend will remain relatively stable. Conversely, if the index falls below the middle line, it is highly likely to repeat the sideways consolidation pattern seen in November or earlier this month below the middle line. Thus, whether the index can remain above the middle line of the Bollinger Bands will be a key determinant for judging short-term market trends. $BI#HSI RP28038.P (60102.HK)$$BI#HSI RP2801M.P (60164.HK)$
## Key Stock Analysis
Zijin Mining (01818) $ZHAOJIN MINING (01818.HK)$
Against the backdrop of a significant drop in the Hang Seng Index, Zijin Mining has shown relatively strong performance. Although the stock price has fluctuated recently, it maintains an overall upward trend. Since hitting a阶段性 low in mid-December, the stock has continued to rise, reaching an intraday high of 38.14 yuan on January 19th and closing at 37.82 yuan. Regarding investor concerns about whether the stock price can break through the 40-yuan mark, data analysis suggests that the current resistance level is approximately 39.3 yuan. A successful breakthrough at this level could propel the stock to 40 yuan or even up to the 42.6-yuan range. Therefore, the breakthrough situation at 39.3 yuan will be a critical point of observation.
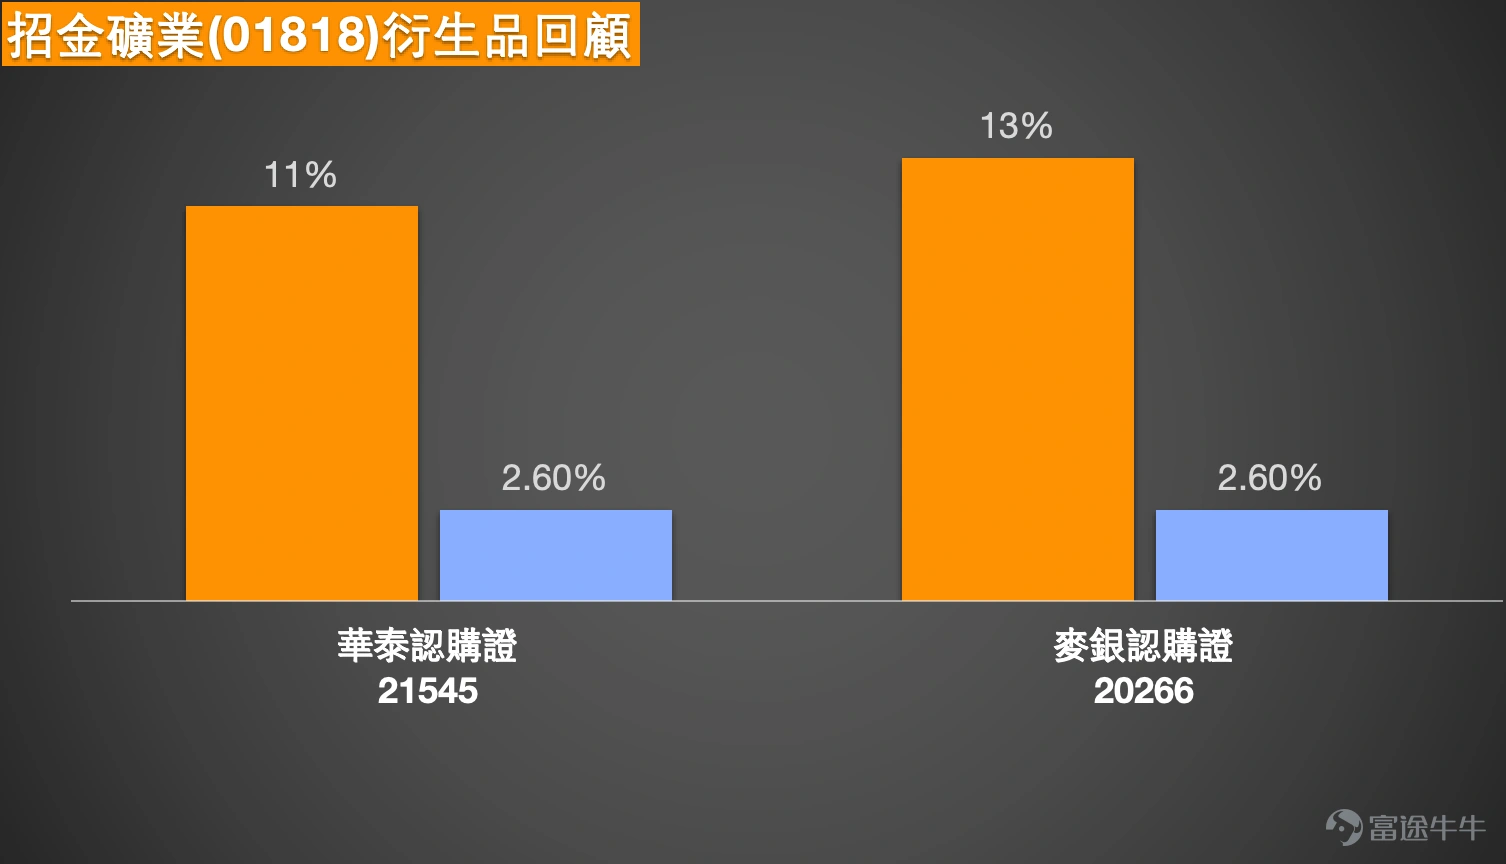
From the derivatives market perspective, Zijin Mining offers a wide selection of call warrant products, with ample choices close to the current market price. For instance, there are three available call warrants with an exercise price of 38.4 yuan. These products not only offer good leverage performance but also have relatively low implied volatility. Additionally, their expiration date is in June of this year, providing a reasonable time frame suitable for investor positioning.
Investors should be reminded to exercise caution regarding certain call warrant products with an exercise price around 41 yuan. While these products boast a higher leverage ratio of nearly 8 times, their expiration date is in March of this year, leaving a relatively short remaining duration. For investors speculating on short-term gains in Zijin Mining, careful selection of such products is advised — as the time value erosion of derivatives nearing expiration accelerates, even if the underlying stock price remains flat or experiences a slight increase, the derivative price might still decline, potentially leading to losses. Hence, it is recommended to avoid products expiring in March whenever possible. $HUZHJIN@EC2603A.C (21545.HK)$$MBZHJIN@EC2603A.C (20266.HK)$
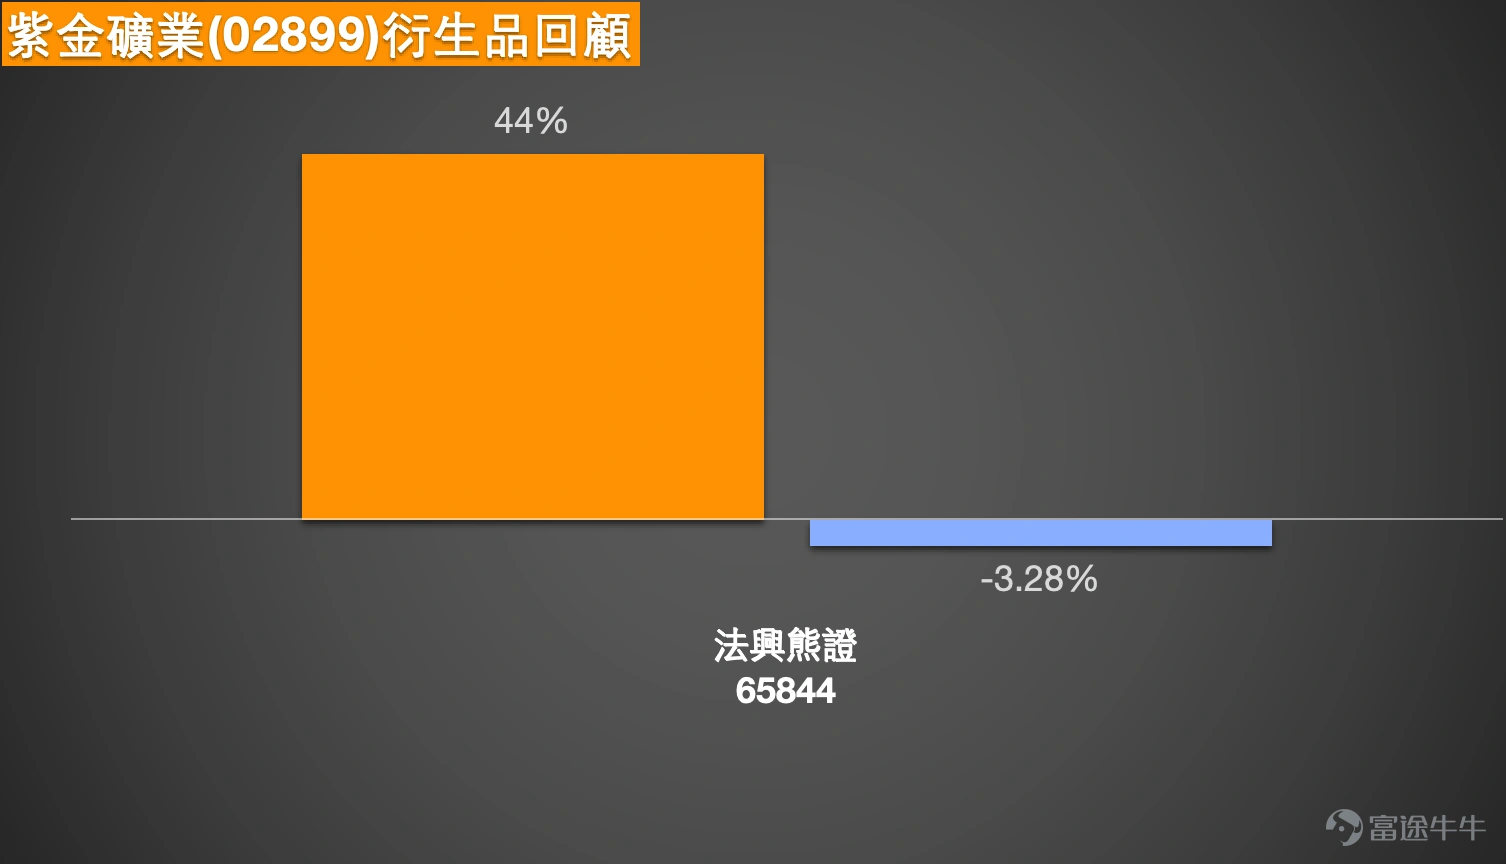
Zijin Mining (02899) $ZIJIN MINING (02899.HK)$
In contrast to Zijin Mining, BYD has shown relatively weak recent performance, with its share price declining for multiple consecutive days, closing at 39.32 yuan on January 19th. Reviewing previous movements, the stock had experienced a sustained upward trend, reaching an intraday high of 46.8 yuan. Currently, the stock has entered a correction phase. Some investors have raised questions: given the continuous record highs in gold prices, why is BYD's stock price falling against the trend? Does entering now carry higher risks?
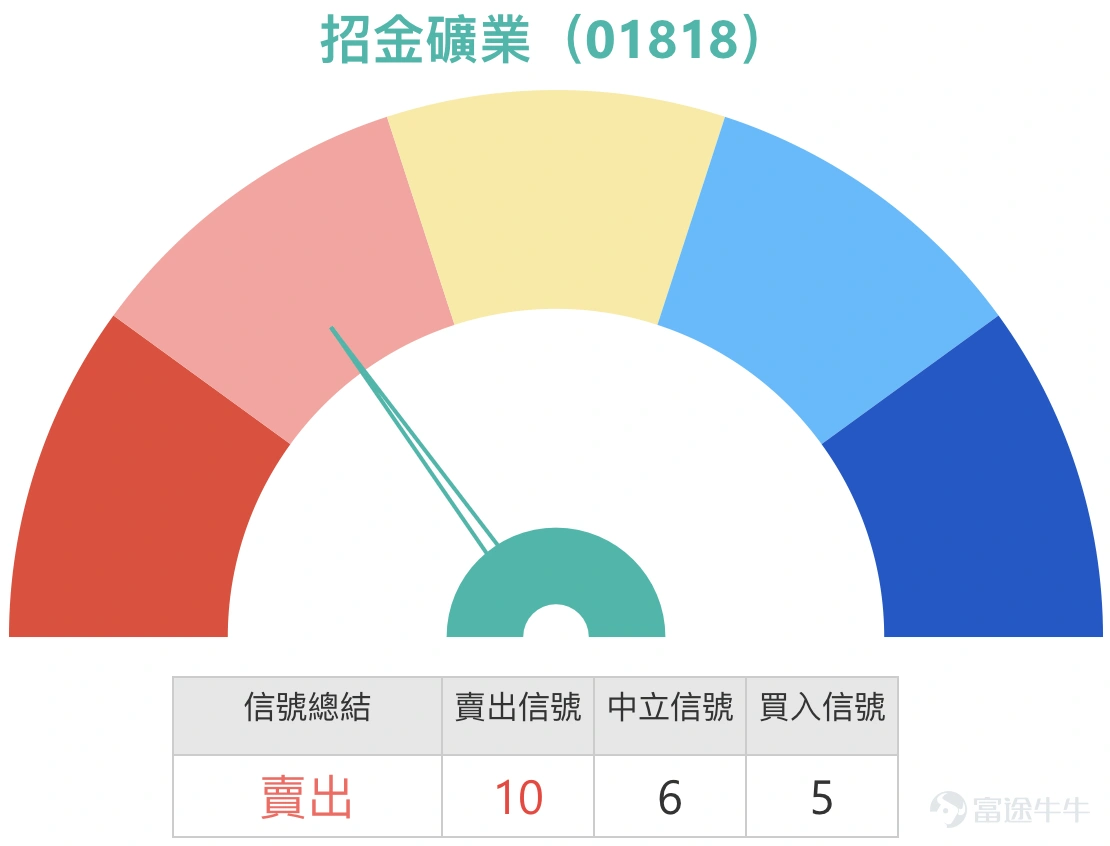
This divergence between stock movement and industry fundamentals is relatively common in the market, and it is reasonable for investors to have doubts about whether to chase the stock. From a technical signal perspective, the stock currently shows predominantly 'sell' signals, with eight sell signals versus five buy signals, indicating a higher proportion of sell signals. Therefore, blindly chasing the stock is not advisable in the short term. Investors should patiently observe market sentiment and subsequent stock price movements before making investment decisions.
Based on the support level analysis, Zijin Mining's short-term support is approximately at 36.9 yuan, which coincides with the middle line of the Bollinger Band. If the stock price falls below this support level, it will likely test the 34.1 yuan range next. Investors should closely monitor whether the stock can hold above the 36.9 yuan middle line of the Bollinger Band to assess its short-term strength. $SG#ZIJINRP2812B.P (65844.HK)$

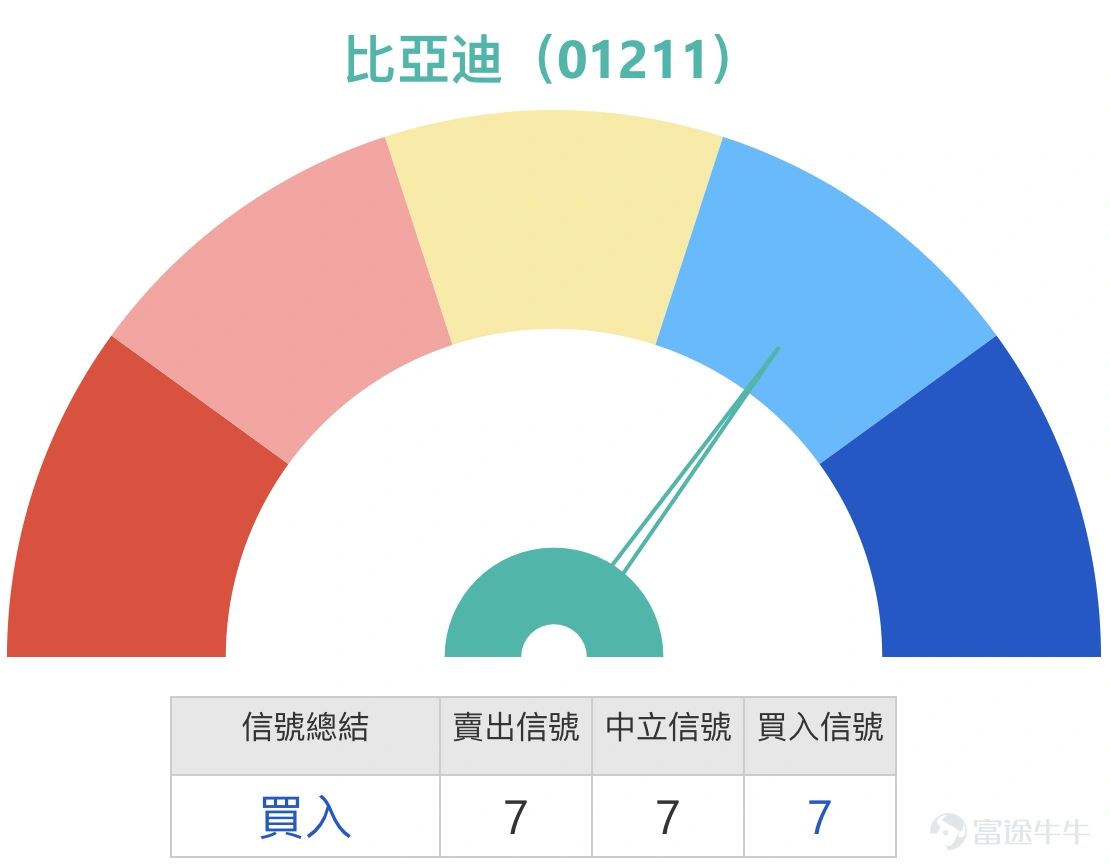
BYD (01211) $BYD COMPANY (01211.HK)$
BYD performed impressively on January 19, with the stock price successfully breaking through the 100-yuan mark and closing at 100.07 yuan. Looking back at previous movements, the stock had been consolidating in the 90-yuan range, and this breakout above 100 yuan has positively boosted market sentiment. However, investors should note that from a daily chart perspective, the current price has reached the upper band of the Bollinger Bands. The stock is likely to consolidate near the top or continue along the upper band, but there is also a need to be cautious of potential technical corrections.
Market investors generally remain optimistic about the stock’s subsequent performance, with some expecting it to rise to the 110-120 yuan range. Despite the risk of technical correction, the stock still shows a dominant 'buy' signal from a technical standpoint, aligning with investor optimism. To break through the 110-yuan mark, the stock must first overcome two key resistance levels: the first being the short-term resistance at 103.1 yuan. A successful breakout could push the stock toward 108.8 yuan.
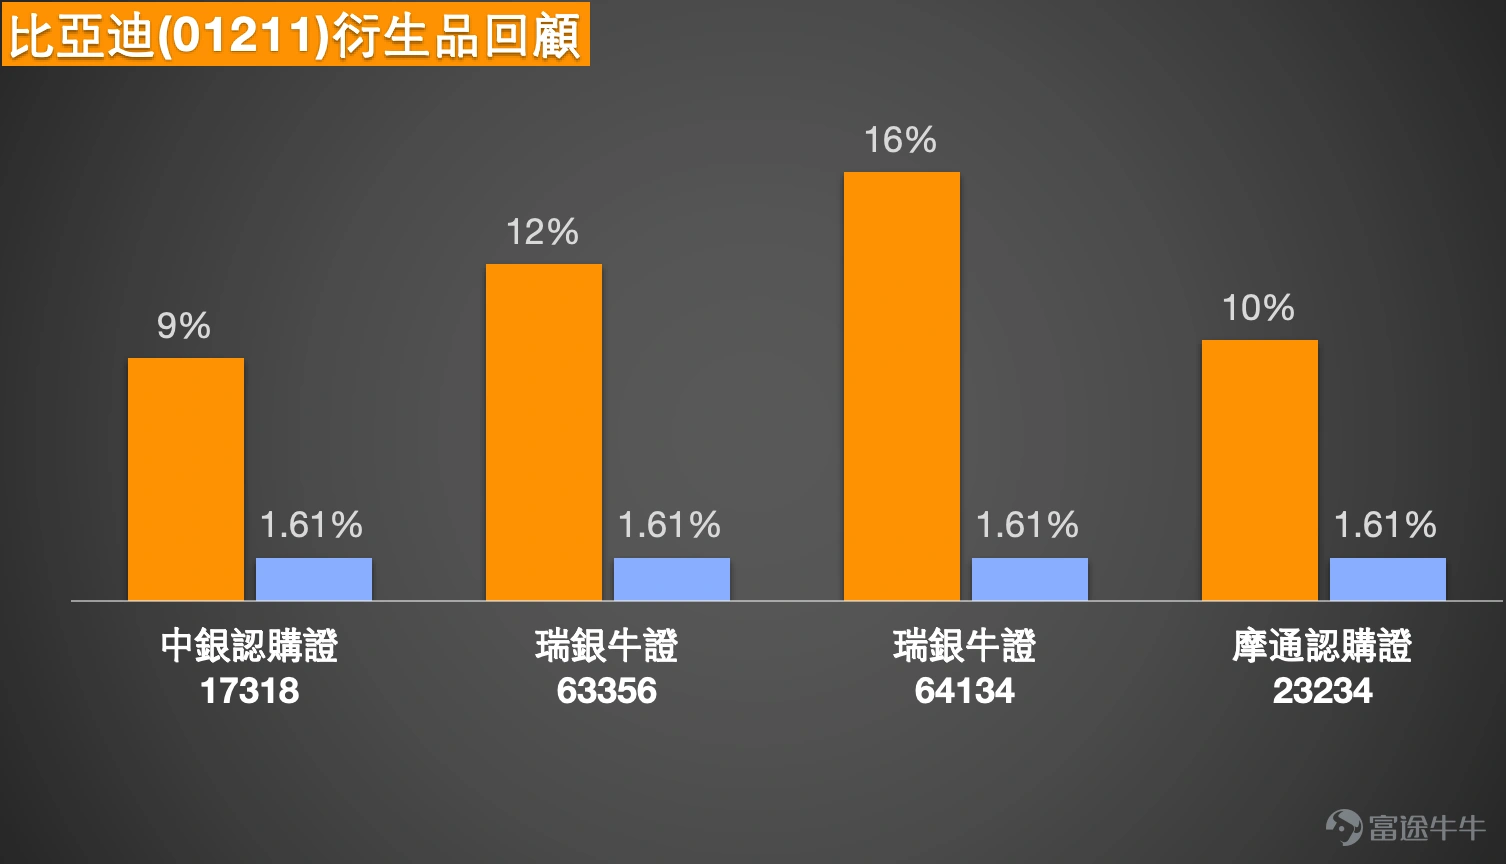
From the perspective of derivatives positioning, there are numerous BYD call warrant products with strike prices in the 108-110 yuan range. However, most of these products expire in March, making them short-term options not recommended for priority selection. Although these products offer leverage exceeding 10 times, their high time decay risk and volatility cannot be ignored. Similarly, products expiring in April are also short-term, with some offering leverage up to 8 times, reasonable pricing, and implied volatility. Still, they carry time risks. In comparison, a call warrant product with a strike price around 104 yuan and an expiry in November appears more suitable, offering 3.8 times leverage, lower than others, but with more time before expiration and reasonable terms. Currently, most BYD call warrants are either deep out-of-the-money or set to expire between March and April, leaving limited quality options. Investors hope issuers will introduce more at-the-money products to expand investment choices. $BI-BYD @EC2604B.C (17318.HK)$$UB#BYD RC2607R.C (63356.HK)$
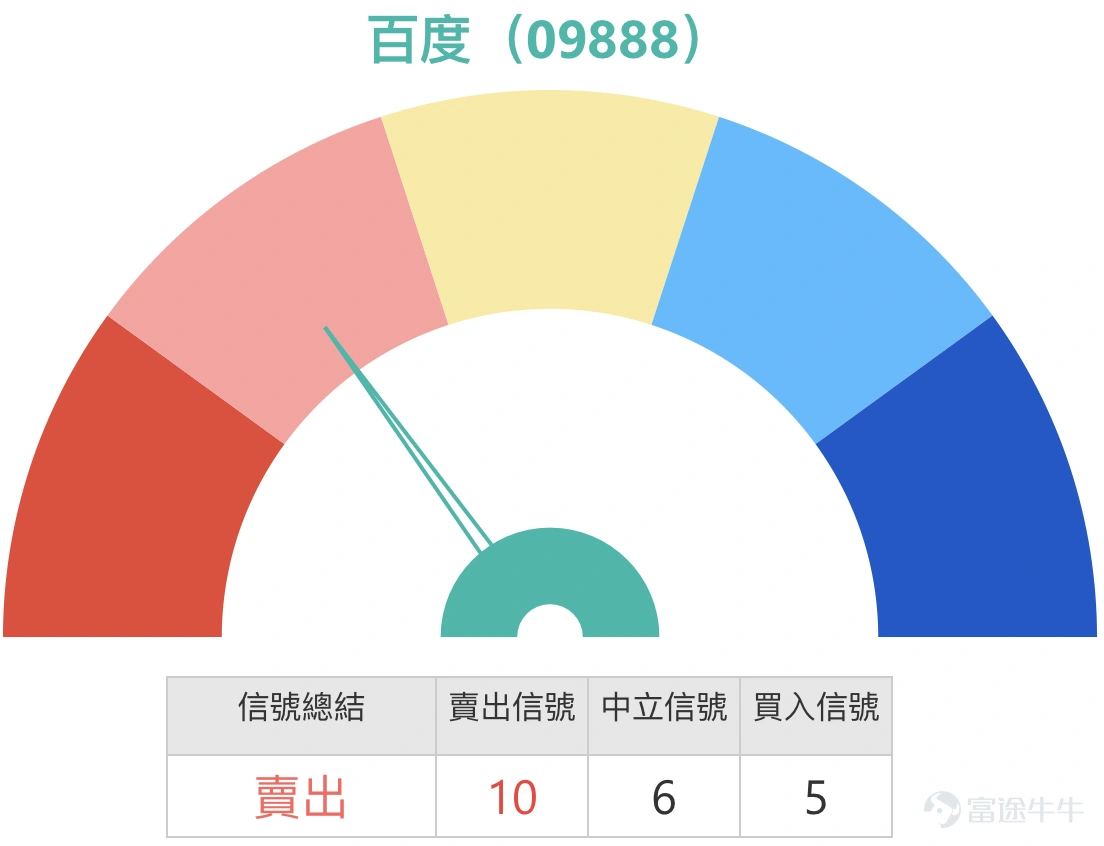
Baidu (09888) $BIDU-SW (09888.HK)$
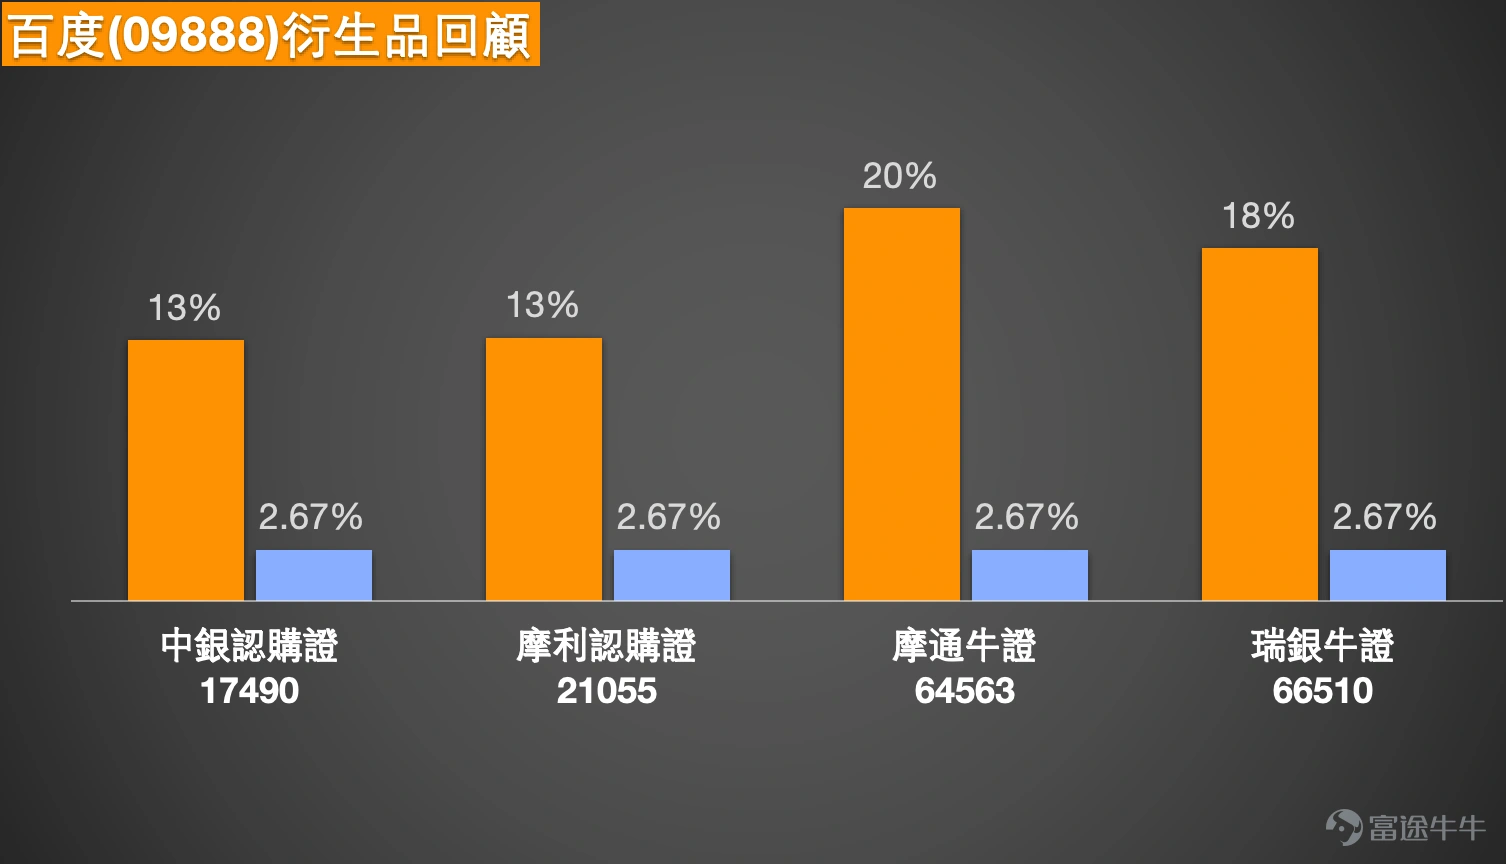
Amid a weakening Hang Seng Index, Baidu’s share price rose against the trend, briefly breaking through the 150-yuan mark on January 19 and closing at 147.4 yuan, with trading volume increasing compared to last Friday. Market investors remain optimistic about the stock’s future performance and have been inquiring about potential resistance levels. However, in the derivatives market, some investors have started adopting a cautious stance, considering the deployment of put warrant products.
From a technical signal perspective, the stock currently displays a dominant 'sell' signal, with 10 sell signals versus 5 buy signals, providing technical justification for those considering deploying put warrants. The stock’s short-term resistance is around 151.9 yuan, and if it breaks through this level, the price could rise further toward 164.9 yuan, serving as a reference target for bullish investors.
For investors interested in deploying put warrants, there are currently eight put warrant products available with a July expiry and a strike price of approximately 131 yuan. These products offer relatively high leverage, ranging from 3.3 to 3.5 times, though implied volatility varies among them, with some at around 50.8 and others reaching 54, leading to differences in pricing. Investors should compare these products’ terms based on their risk preferences and select the most suitable one. If unsure, they can consult professionals for real-time market information and investment advice. $BIBAIDU@EC2606A.C (17490.HK)$$MSBAIDU@EC2603C.C (21055.HK)$$UB#BAIDURC2612I.C (66510.HK)$
HSBC Holdings (00005) $HSBC HOLDINGS (00005.HK)$
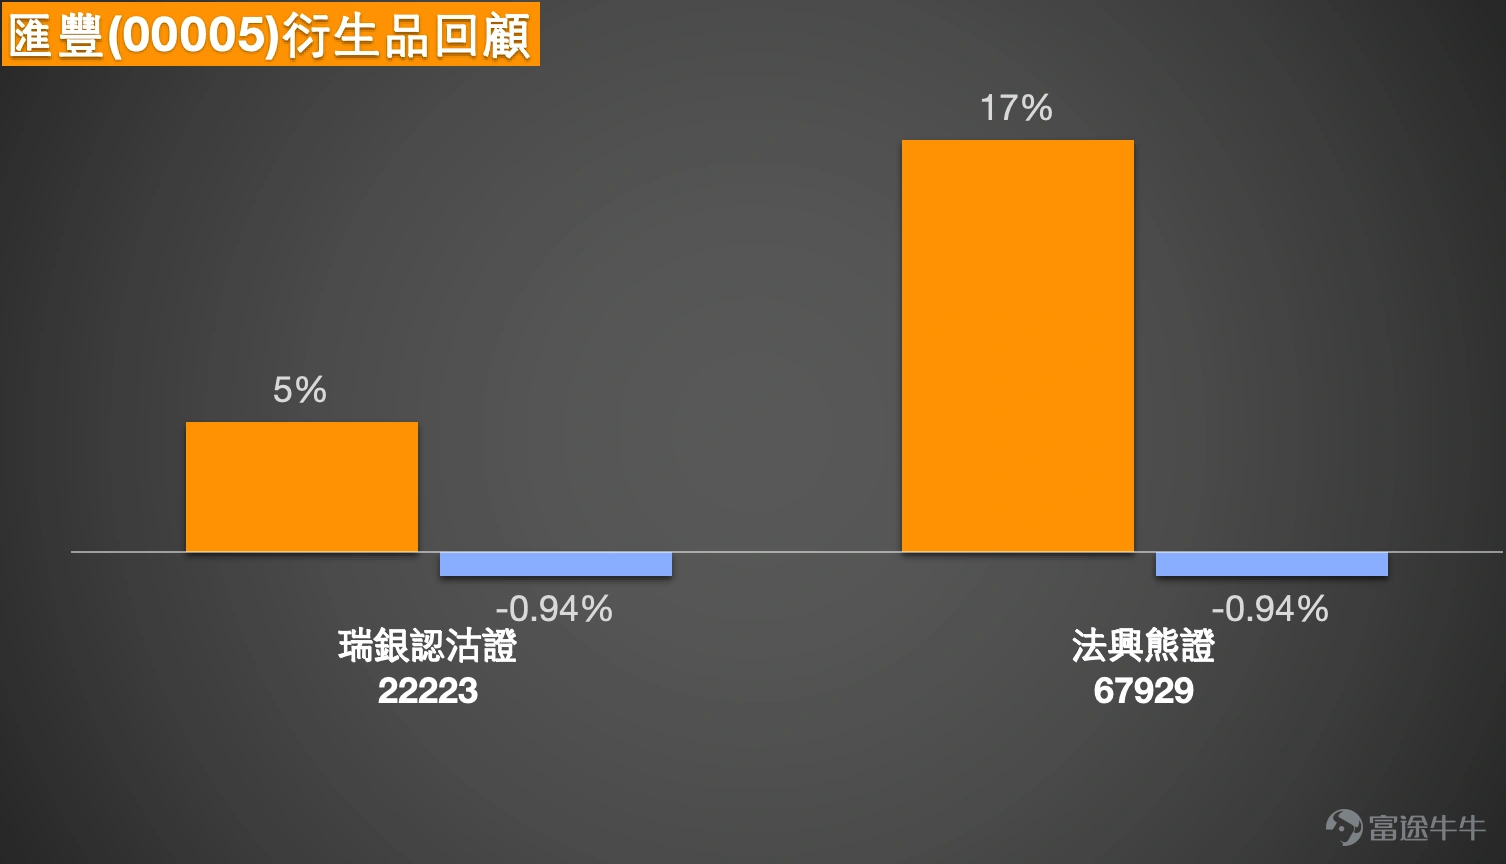
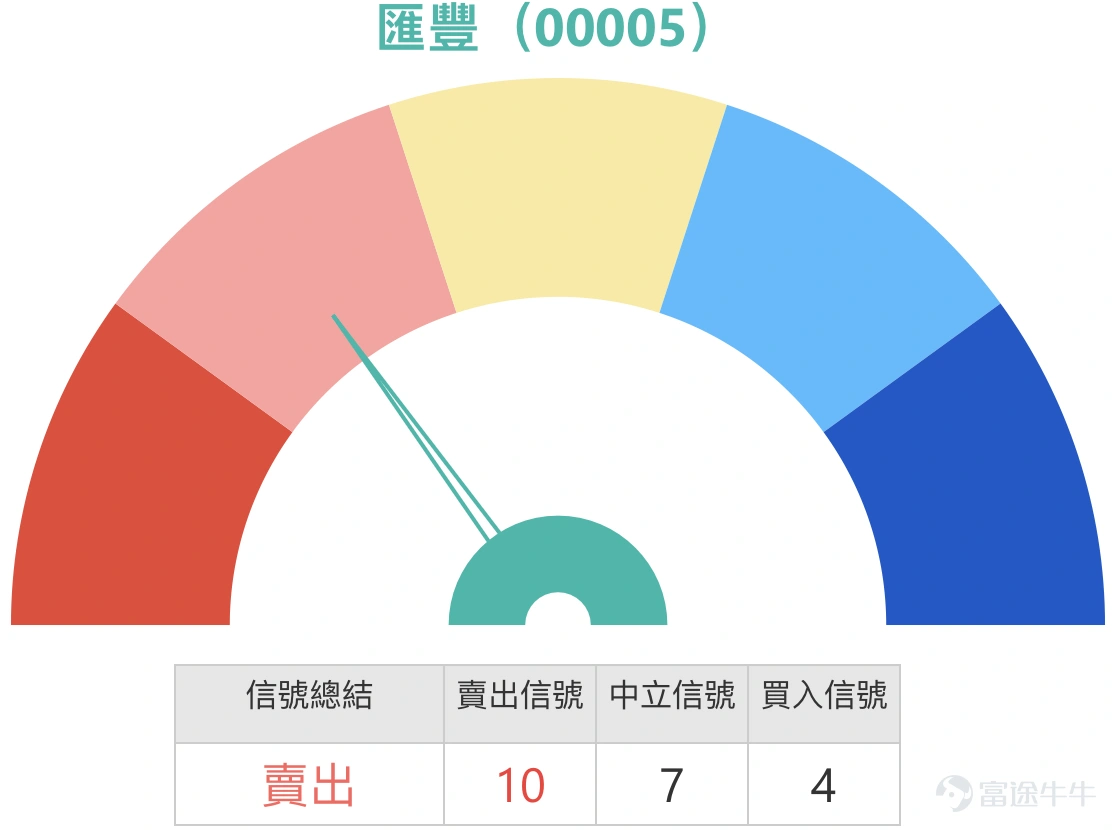
As a representative blue-chip stock in the Hong Kong market, HSBC Holdings showed strong performance last week, with intraday prices touching 130 yuan. However, on January 19, the stock failed to maintain its upward momentum and retreated, closing at 127 yuan, while trading volume contracted, indicating slight weakness in the short term. Despite this, market investors remain optimistic about the stock’s future and are inquiring about potential low-price entry points and monitoring opportunities related to call warrant products.
From a technical signal perspective, the stock's short-term outlook is not optimistic, with a predominant 'sell' signal. There are currently 10 sell signals compared to only 4 buy signals. Regarding the range investors are watching for low-position deployment, analysis shows that the stock's near-term support level is approximately 123.1 yuan, which overlaps significantly with the middle line of the Bollinger Band. If the stock price breaks below this support, it is highly likely to test the next support at around 118.9 yuan. Investors can consider the Bollinger Band middle line position at 123.1 yuan as a key observation point to assess whether there is an opportunity for low-position entry.
In terms of the derivatives market, HSBC Holdings offers a wide range of call warrant products covering various out-of-the-money levels. It is important to note that some products have apparent leverage as high as 15-16 times, seemingly offering significant investment appeal. However, most of these are short-term products expiring by the end of March, carrying considerable risks. Some investors believe they can hold these products for just one or two days, speculating on minor stock price increases. Objectively speaking, however, such strategies carry substantial uncertainty. While gains could be made if the stock rises as expected, in the event of a correction similar to what happened on January 19, short-term call warrants would not only lose value due to the decline in the underlying stock but also suffer from rapid time decay, further amplifying losses.
Short-term derivatives nearing expiration expose investors to relatively higher probabilities of loss in scenarios where the underlying stock remains range-bound or declines. Even if the stock price stays flat without any clear directional movement, investors may still incur losses due to time decay, let alone during periods of stock price drops. Therefore, although high-leverage products may appear attractive, investors are advised to avoid those nearing expiration and prioritize products with longer maturities. Though these products typically offer lower leverage, they effectively reduce the risk of time decay and help avoid unnecessary losses during range-bound or adjustment phases of the underlying stock. $UB-HSBC@EP2606B.P (22223.HK)$$SG#HSBC RP2701C.P (67929.HK)$
Disclaimer: This article does not constitute any investment advice.
This article is for reference only and does not constitute any investment advice. The market data, opinions, and analysis contained herein may change at any time without prior notice. We shall not be liable for any loss or damage arising from reliance on the information in this article. Technical analysis merely indicates whether certain technical conditions are met; a comprehensive evaluation of asset performance should incorporate additional data. Trading decisions should not be based solely on the content of this article. Please note that past performance is not indicative of future results.
Risk Disclaimer: The above content only represents the author's view. It does not represent any position or investment advice of Futu. Futu makes no representation or warranty.Read more

Comments
to post a comment
3
10