
[Warrant Perspective] The support and resistance levels for the Hang Seng Index are clear, with the short-term neutral pattern remaining unchanged
January 19$Hang Seng Index (800000.HK)$
The market trend faced pressure, closing at 26,563.9 points for the day, with a single-day decline of 1.05%. The 5-day volatility was 2.5%, and the trading volume reached 225.689 billion yuan, showing no significant expansion or contraction in liquidity. In terms of technical indicators, the Hang Seng Index RSI is 59, within the neutral range. Multiple oscillation indicators, including RSI, Williams %R, and Stochastic Oscillator, provided neutral signals. Only a few indicators like Bollinger Bands showed a slight bias towards buying, with an overall lack of clear directional guidance.
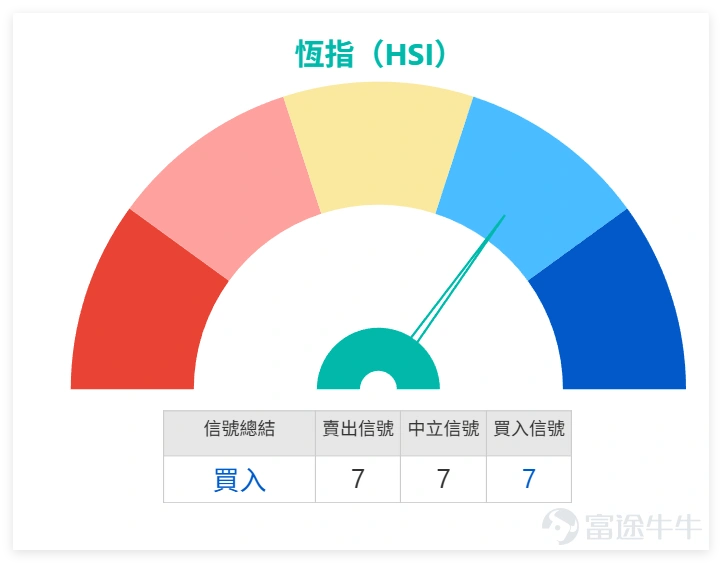
In terms of support and resistance, the Hang Seng Index's short-term support levels are at 26,032 points (Support 1) and 25,543 points (Support 2), while the resistance levels are at 27,015 points (Resistance 1) and 27,585 points (Resistance 2). Currently, the price is trading below the MA10 (26,633.97 points), with the MA30 (26,044.37 points) and MA60 (26,088.85 points) forming a lower support zone, indicating a clear oscillating pattern.
On January 19, only BYD shares among the blue chips recorded gains, while all others fell to varying degrees. Technical patterns showed significant divergence, which can be divided into three main groups:
(1) Oversold Rebound Group: Led by Xiaomi and Meituan
$XIAOMI-W (01810.HK)$ This can be considered an 'oversold target' from the previous day (19th), closing at 36.48 yuan, with a single-day drop of 1.67%. The RSI is only 31, indicating a deeply oversold region. Although the stock price is below all short-term moving averages such as MA10, MA30, and MA60, the technical summary signal suggests a buy with high strength of 11. Multiple indicators show signs of bottoming out after excessive declines, implying a relatively strong expectation for a short-term rebound.
$MEITUAN-W (03690.HK)$ It also weakened in sync, closing at 98.50 yuan, with a decline of 1.50%. The RSI of 44 has entered the oversold zone, and the technical buy signal strength is 8. It remains below all moving averages, and indicators suggest there may be a corrective rebound in the short term. Attention should be paid to whether it can break through the moving average resistance.
(2) Neutral Signal Group: Financials and HKEX Dominated
$CCB (00939.HK)$ 、 $AIA (01299.HK)$ Five stocks including CCB have given neutral signals with relatively stable trends. Among them, CCB had the smallest decline (-0.38%), closing at 7.80 yuan. The stock price is operating above MA10 and MA30 but slightly below MA60, with an RSI of 58 close to neutral. Indicators show no clear direction, making it suitable for observation and tracking.
$HKEX (00388.HK)$ Closing at 431.80 yuan, with a decline of 1.51%, the stock price barely remained above MA10. The RSI of 61 leans towards the strong region but isn't overbought, and the market sentiment is heavily cautious. In the short term, it is likely to fluctuate with the Hang Seng Index.
(3) Bearish Signal Group: HSBC and Alibaba Lead the Decline
$HSBC HOLDINGS (00005.HK)$ The technical signal is the weakest, closing at 127.00 yuan, with a drop of 1.17%. The technical summary signal is sell with a strength of 10, and the RSI of 66 has entered the overbought zone. Although the stock price is firmly above all moving averages, some indicators are showing overbought pressure signals, so caution against a pullback risk is necessary.
$BABA-W (09988.HK)$ Largest decline (-3.49%), closing at 160.40 yuan, with a technical sell signal strength of 8 and an RSI of 61. The stock price is below MA10 and MA30, and overall indicators lean towards selling, indicating that the short-term weak trend will be difficult to reverse.
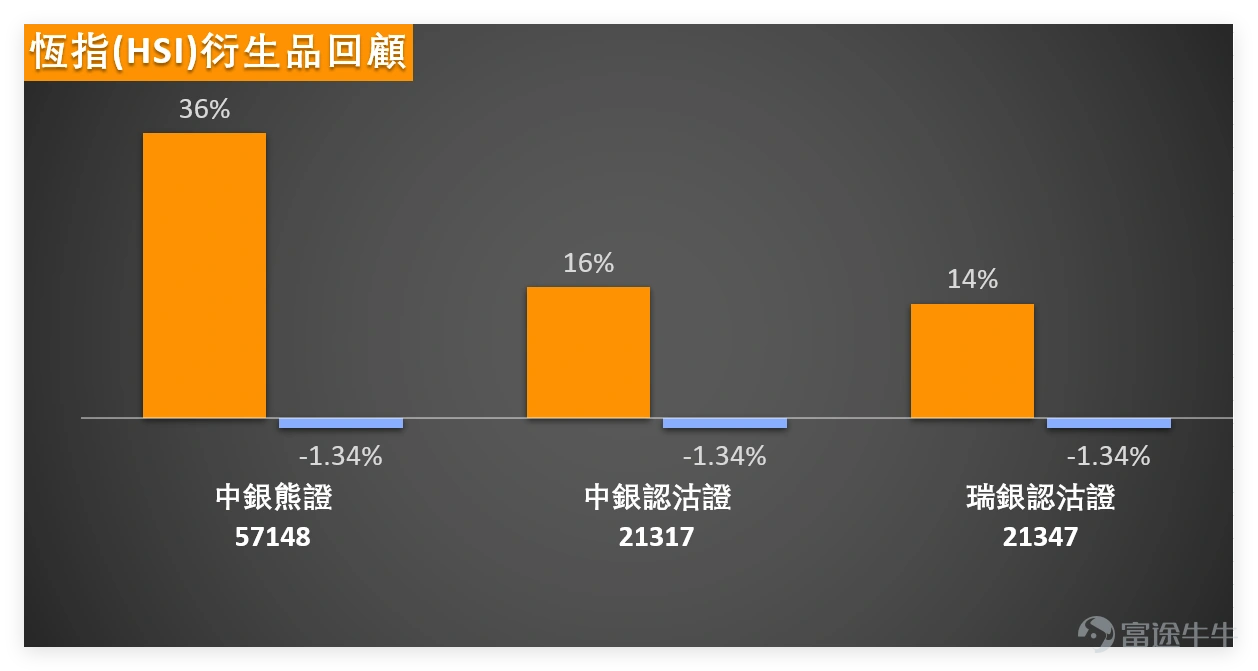
Product Review: Put Warrants and Bear Contracts Yielded Significant Profits
The Hang Seng Index-related CBBCs and bull/bear products recommended on January 15 generated considerable returns two days later. Among them, $BI#HSI RP28033.P (57148.HK)$ the highest increase reached 36%, $BI-HSI @EP2603C.P (21317.HK)$ an increase of 16%, $UB-HSI @EP2603C.P (21347.HK)$ an increase of 14%. Meanwhile, the Hang Seng Index fell by 1.34%. Derivatives perfectly captured the market's downward trend, showcasing the advantage of leverage.
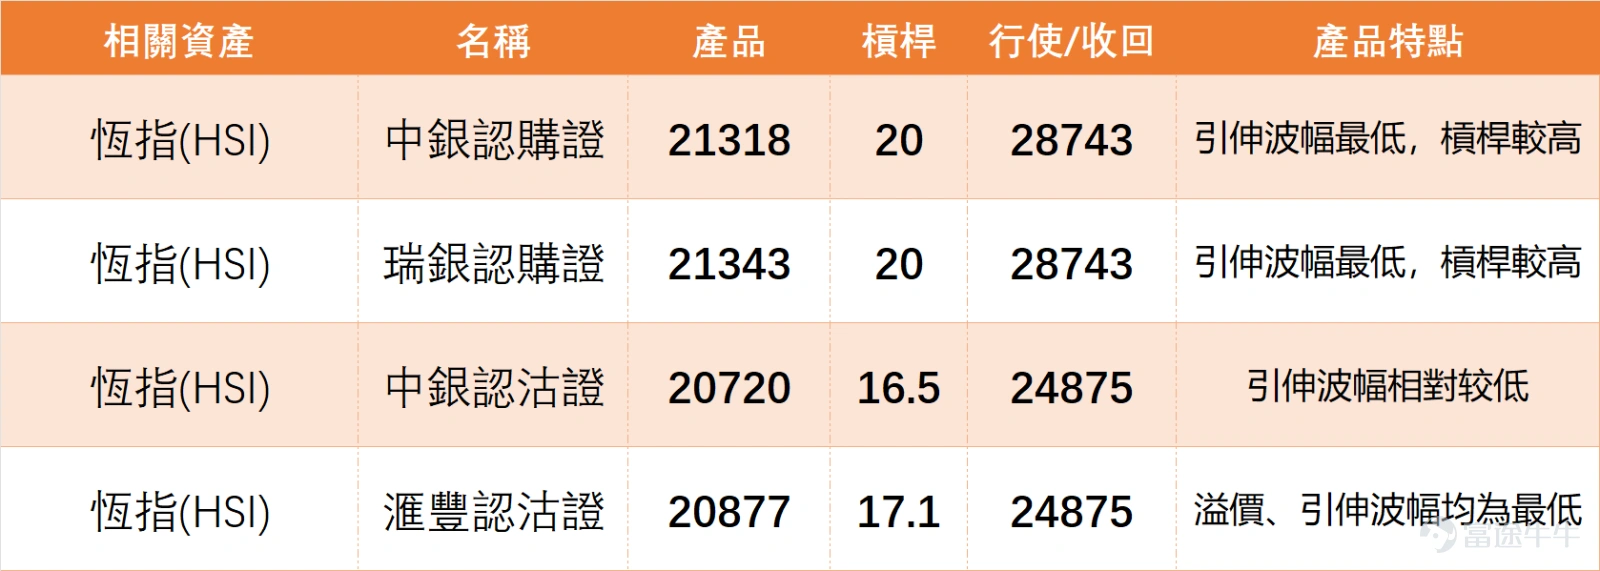
Product Selection: Two Low-Volatility, High-Leverage Call Warrants
In line with the current neutral and volatile trading range of the Hang Seng Index, two high-value-for-money call warrants have been selected, suitable for investors expecting a short-term rebound in the Hang Seng Index:
1. $BI-HSI @EC2603A.C (21318.HK)$ : Leverage of 20x, strike price of 28,743 points; its core advantage is the lowest implied volatility, offering lower fluctuation risk in a volatile market and higher leverage efficiency.
2. $UB-HSI @EC2603A.C (21343.HK)$ : Same strike price (28,743 points) as (21318), also featuring 20x leverage and low implied volatility. This product complements the Bank of China's offering and allows for flexible selection based on market fluctuations.
Risk Warning: CBBCs and bull/bear products carry high leverage, posing higher risks. It is necessary to closely track the underlying stock’s movement and time to expiration to avoid blindly entering the market.
Do you think the oversold signals of Xiaomi and Meituan will quickly lead to a rebound? A. Yes B. No C. Observing. Among today's blue chips, which stock's subsequent technical movement are you most focused on?Feel free to leave comments and share! For more analysis, be sure to follow 'HK Stock Warrants Jenny' for daily updates!
Disclaimer: This article does not constitute any investment advice.
This article is for reference only and does not constitute any investment advice. The market data, opinions, and analysis contained herein may change at any time without prior notice. We shall not be liable for any loss or damage arising from reliance on the information in this article. Technical analysis merely indicates whether certain technical conditions are met; a comprehensive evaluation of asset performance should incorporate additional data. Trading decisions should not be based solely on the content of this article. Please note that past performance is not indicative of future results.
#HongKongStocks #HangSengIndex #RealTimeAnalysis #WarrantsSelection #WarrantsStrategy #DerivativesHedging #HongKongWarrantsJenny # #TechStocks #FinancialStocks #TechnicalAnalysis
Risk Disclaimer: The above content only represents the author's view. It does not represent any position or investment advice of Futu. Futu makes no representation or warranty.Read more
Comment (1)
to post a comment