BOC Consolidated guests on HKEX Podcast: Analyzing Xiaomi's Short-term Trading Opportunities Amid Market Divergence
As of January 19, 2026, the share price movement of Xiaomi Group (01810.HK) has been a focal point for the market. Frequent oversold signals on technical charts combined with significant divergence in market sentiment have created a complex trading landscape. On one hand, after continuous adjustments, the stock price has fallen to a key support area, and several technical indicators are signaling a potential rebound. On the other hand, whether the stock can break free from its 'severely lagging' downtrend still depends on volume support and shifts in market sentiment.
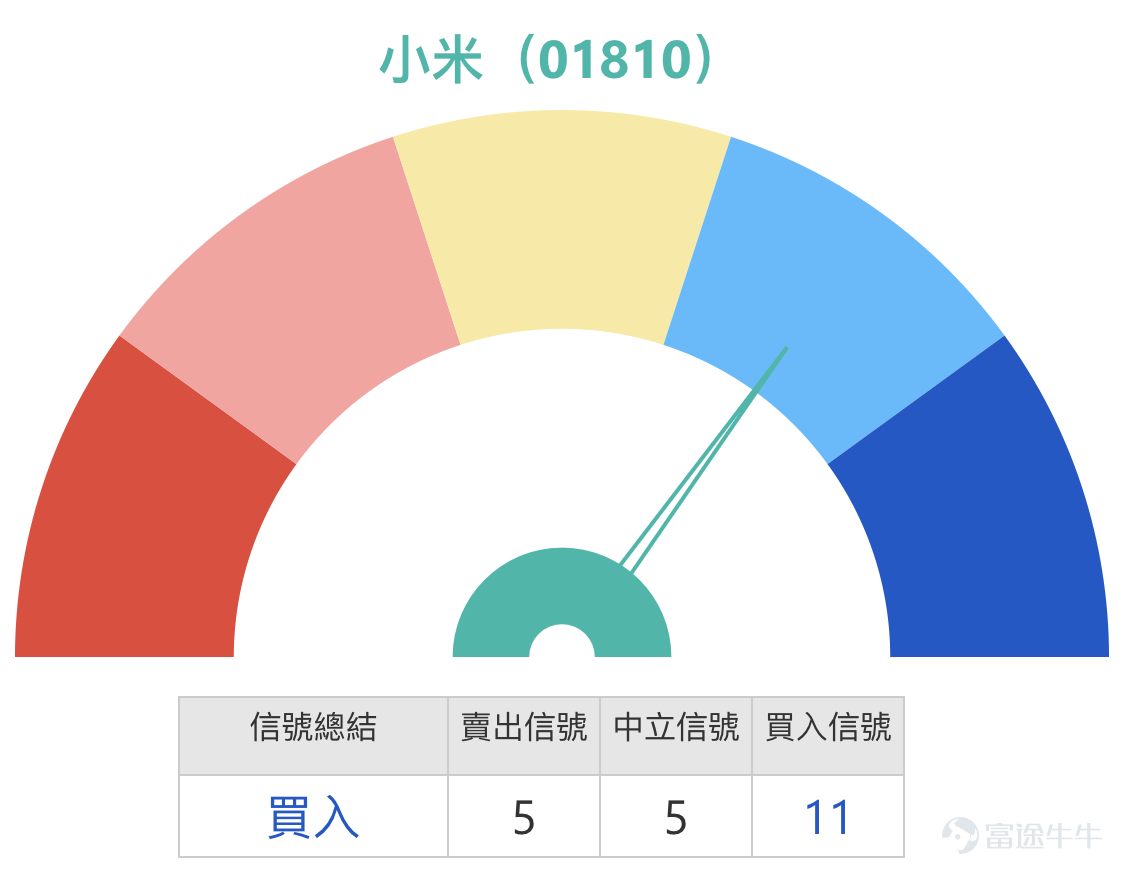
I. Technical Analysis: Deeply Oversold, Key Support Faces Severe Test
From a technical perspective, Xiaomi’s share price has entered an extremely sensitive and critical zone. The current price is hovering around HKD 36.5, which is significantly below the 10-day (HKD 39.8), 30-day (HKD 41.05), and 60-day (HKD 37.86) moving averages. The moving average system shows a bearish alignment, clearly indicating short-term downward pressure. However, extremes often reverse; extreme pessimism can sow the seeds for a technical rebound. Multiple important oscillation indicators have signaled clear oversold conditions: the Williams %R and Stochastic Oscillators both indicate an 'oversold status' and suggest 'buy' signals. More critically, the momentum oscillator has shown a 'bottom divergence, buy' signal, typically a forward-looking technical sign that downside momentum is waning and the stock may form a short-term bottom. Additionally, the Rate of Change indicator suggests 'severely oversold, possible bottom formation.' These frequent oversold signals resonate strongly with host Simon’s observations on the [HKEX Podcast] on January 14th, noting 'the stock has dropped quite a bit' and 'technical signals are mainly showing buys'.
Against this technical backdrop, clear price levels become the focus of the bulls-vs-bears battle. Below, the first crucial line of defense lies at HKD 35.4, which represents a previous area of heavy trading and psychological support. If this level is unfortunately breached, the market may further test the second support at HKD 33.7. Above, the first short-term rebound target and strong resistance level is at HKD 38.4, near the lower Bollinger Band and the low of the previous platform. If effectively broken through, it could challenge the more important resistance zone at HKD 41.3, where multiple medium- and long-term moving averages converge, making it a key watershed for determining whether the trend can reverse.
![$XIAOMI-W (01810.HK)$ As of January 19, 2026, the share price movement of Xiaomi Group (01810.HK) has been a focal point for the market. Frequent oversold signals on technical charts combined with significant divergence in market sentiment have created a complex trading landscape. On one hand, after continuous adjustments, the stock price has fallen to a key support area, and several technical indicators are signaling a potential rebound. On the other hand, whether the stock can break free from its 'severely lagging' downtrend still depends on volume support and shifts in market sentiment. I. Technical Analysis: Deeply Oversold, Key Support Faces Severe Test From a technical perspective, Xiaomi’s share price has entered an extremely sensitive and critical zone. The current price is hovering around HKD 36.5, which is significantly below the 10-day (HKD 39.8), 30-day (HKD 41.05), and 60-day (HKD 37.86) moving averages. The moving average system shows a bearish alignment, clearly indicating short-term downward pressure. However, extremes often reverse; extreme pessimism can sow the seeds for a technical rebound. Multiple important oscillation indicators have signaled clear oversold conditions: the Williams %R and Stochastic Oscillators both indicate an 'oversold status' and suggest 'buy' signals. More critically, the momentum oscillator has shown a 'bottom divergence, buy' signal, typically a forward-looking technical sign that downside momentum is waning and the stock may form a short-term bottom. Additionally, the Rate of Change indicator suggests 'severely oversold, possible bottom formation.' These frequent oversold signals resonate strongly with host Simon’s observations on the [HKEX Podcast] on January 14th, noting 'the stock has dropped quite a bit' and 'technical signals are mainly showing buys'.](https://nnqimage.futunn.com/sns_client_feed/1162342/20260119/web-1768807152952-gZfFsFnekV.png/big?area=1&is_public=true&imageMogr2/ignore-error/1/format/webp)
II. Consolidation of Market Views: Intertwining Pessimistic Realities with Contrarian Positioning Expectations
The current market sentiment towards Xiaomi Group is sharply polarized, a divergence that precisely reflects the typical characteristics of a stock at a turning point.
Pervasive pessimism and the 'lagging' stock price. Pessimistic sentiment is spreading through the market, with Simon from [HKEX Podcast] frankly pointing out that Xiaomi Group’s stock performance has been 'somewhat disappointing for investors,' while acknowledging that 'compared to the broader market, Xiaomi undeniably lags behind.' This perception of being 'severely behind' is the main factor contributing to the continued pressure on the stock price and insufficient investor confidence. The stock has languished at low levels for a prolonged period, with weak upward momentum, serving as a clear indication of the market voting with their feet.
Contrarian positioning and expectations of a 'bottom.' Contrasting with the prevailing pessimism, some capital has begun adopting contrarian thinking and making early moves. As mentioned in [HKEX Podcast], despite the weak stock performance, 'some have already started slowly buying Xiaomi Group's call warrants in the warrant market.' This indicates that certain astute investors are attempting to accumulate chips in the market bottom area while others remain pessimistic. This perspective was corroborated from another angle in an earlier [BOC Guest Appearance] segment (December 16, 2025), where Niki, Director at BOC International, analyzed that the rebound from the low of 36.6 yuan 'should represent a recent bottom,' observing that 'every pullback in Xiaomi Group attracts inflows of bullish funds.' Together, these insights from two core market columns paint a clear picture: mainstream market sentiment remains pessimistic due to the lagging stock price, but professional institutions and some traders, based on technical oversold conditions and 'bottom' judgments, have begun making exploratory left-side positioning. This divergence itself often signals the prelude to a market reversal.
III. Review of Warrant Products and Strategic Value
Reviewing the recent performance of the derivatives market, it is evident that during one-sided market fluctuations, derivative instruments exhibit significant volatility amplification characteristics. Taking the bearish product mentioned on January 15 as an example, against the backdrop of Xiaomi Group’s underlying stock dropping by 3.86% over the following two trading days, related products, thanks to leverage, achieved returns far exceeding the decline in the underlying stock. Specifically, UBS Group bear certificates (69732) $UB#XIAMIRP2812A.P (69732.HK)$ and HSBC bear certificates (69927) $HS#XIAMIRP2807G.P (69927.HK)$ rose significantly by 55% and 52%, respectively; UBS Group put warrants (22136) and HSBC put warrants (22196) also climbed by 27% and 29%, respectively.
![$XIAOMI-W (01810.HK)$ As of January 19, 2026, the share price movement of Xiaomi Group (01810.HK) has been a focal point for the market. Frequent oversold signals on technical charts combined with significant divergence in market sentiment have created a complex trading landscape. On one hand, after continuous adjustments, the stock price has fallen to a key support area, and several technical indicators are signaling a potential rebound. On the other hand, whether the stock can break free from its 'severely lagging' downtrend still depends on volume support and shifts in market sentiment. I. Technical Analysis: Deeply Oversold, Key Support Faces Severe Test From a technical perspective, Xiaomi’s share price has entered an extremely sensitive and critical zone. The current price is hovering around HKD 36.5, which is significantly below the 10-day (HKD 39.8), 30-day (HKD 41.05), and 60-day (HKD 37.86) moving averages. The moving average system shows a bearish alignment, clearly indicating short-term downward pressure. However, extremes often reverse; extreme pessimism can sow the seeds for a technical rebound. Multiple important oscillation indicators have signaled clear oversold conditions: the Williams %R and Stochastic Oscillators both indicate an 'oversold status' and suggest 'buy' signals. More critically, the momentum oscillator has shown a 'bottom divergence, buy' signal, typically a forward-looking technical sign that downside momentum is waning and the stock may form a short-term bottom. Additionally, the Rate of Change indicator suggests 'severely oversold, possible bottom formation.' These frequent oversold signals resonate strongly with host Simon’s observations on the [HKEX Podcast] on January 14th, noting 'the stock has dropped quite a bit' and 'technical signals are mainly showing buys'.](https://nnqimage.futunn.com/sns_client_feed/1162342/20260119/web-1768807230205-TeBdodzYQv.png/big?area=1&is_public=true&imageMogr2/ignore-error/1/format/webp)
IV. Derivative Deployment Strategies under Current Market Conditions
Warrant (Call/Put) Product Analysis:
Investors anticipating an imminent technical rebound may consider call warrants with strike prices set near key resistance levels. For instance, BOC call warrants (22824) and Morley call warrants (24249), both with strike prices around 40 yuan. This price is slightly above the first resistance level of 38.4 yuan but significantly below the second resistance level of 41.3 yuan and the previous consolidation midpoint. This represents a relatively aggressive terms design, suitable for investors expecting not only a bottoming-out and rebound in the stock price but also the capability to quickly reclaim 38.4 yuan and challenge the 40-yuan mark. If the stock price rebounds but meets resistance near 38.4 yuan, the time value of such out-of-the-money warrants will face rapid erosion. Investors who remain bearish on the future outlook might consider put warrants with strike prices near 35.16 yuan, such as UBS Group put warrants (22136). $MSXIAMI@EC2605D.C (24249.HK)$ $UBXIAMI@EP2604A.P (22136.HK)$ and HSBC put warrants (22196). The strike price is very close to the first support level of $35.4, aiming to capture potential accelerated downside moves if the stock price breaks below this key support.
![$XIAOMI-W (01810.HK)$ As of January 19, 2026, the share price movement of Xiaomi Group (01810.HK) has been a focal point for the market. Frequent oversold signals on technical charts combined with significant divergence in market sentiment have created a complex trading landscape. On one hand, after continuous adjustments, the stock price has fallen to a key support area, and several technical indicators are signaling a potential rebound. On the other hand, whether the stock can break free from its 'severely lagging' downtrend still depends on volume support and shifts in market sentiment. I. Technical Analysis: Deeply Oversold, Key Support Faces Severe Test From a technical perspective, Xiaomi’s share price has entered an extremely sensitive and critical zone. The current price is hovering around HKD 36.5, which is significantly below the 10-day (HKD 39.8), 30-day (HKD 41.05), and 60-day (HKD 37.86) moving averages. The moving average system shows a bearish alignment, clearly indicating short-term downward pressure. However, extremes often reverse; extreme pessimism can sow the seeds for a technical rebound. Multiple important oscillation indicators have signaled clear oversold conditions: the Williams %R and Stochastic Oscillators both indicate an 'oversold status' and suggest 'buy' signals. More critically, the momentum oscillator has shown a 'bottom divergence, buy' signal, typically a forward-looking technical sign that downside momentum is waning and the stock may form a short-term bottom. Additionally, the Rate of Change indicator suggests 'severely oversold, possible bottom formation.' These frequent oversold signals resonate strongly with host Simon’s observations on the [HKEX Podcast] on January 14th, noting 'the stock has dropped quite a bit' and 'technical signals are mainly showing buys'.](https://nnqimage.futunn.com/sns_client_feed/1162342/20260119/web-1768807266452-MDBpjAalFy.jpeg/big?area=1&is_public=true&imageMogr2/ignore-error/1/format/webp)
Bull and Bear Certificate Product Analysis:
For example, Societe Generale bull certificates (62507) and J.P. Morgan bull certificates (67515). $JP#XIAMIRC2609F.C (67515.HK)$ The call prices for both are set at $35. This price is slightly below the first support level of $35.4 but significantly higher than the second support level of $33.7, offering a relatively balanced buffer zone. It suits investors who believe the $35.4 support will hold but also want to control costs. For bearish investors, when choosing bear certificates, the call price should be significantly above key technical resistance levels. UBS bear certificates (69732) $UB#XIAMIRP2812A.P (69732.HK)$ and Societe Generale bear certificates (68563) have their call prices set at $40, which is slightly above the first resistance level of $38.4. This design applies to scenarios where the stock price struggles to rebound and falls back within the $38-40 range. However, investors must be aware that if the stock price rebounds strongly and hits $40, the product will be forcibly called back.
![$XIAOMI-W (01810.HK)$ As of January 19, 2026, the share price movement of Xiaomi Group (01810.HK) has been a focal point for the market. Frequent oversold signals on technical charts combined with significant divergence in market sentiment have created a complex trading landscape. On one hand, after continuous adjustments, the stock price has fallen to a key support area, and several technical indicators are signaling a potential rebound. On the other hand, whether the stock can break free from its 'severely lagging' downtrend still depends on volume support and shifts in market sentiment. I. Technical Analysis: Deeply Oversold, Key Support Faces Severe Test From a technical perspective, Xiaomi’s share price has entered an extremely sensitive and critical zone. The current price is hovering around HKD 36.5, which is significantly below the 10-day (HKD 39.8), 30-day (HKD 41.05), and 60-day (HKD 37.86) moving averages. The moving average system shows a bearish alignment, clearly indicating short-term downward pressure. However, extremes often reverse; extreme pessimism can sow the seeds for a technical rebound. Multiple important oscillation indicators have signaled clear oversold conditions: the Williams %R and Stochastic Oscillators both indicate an 'oversold status' and suggest 'buy' signals. More critically, the momentum oscillator has shown a 'bottom divergence, buy' signal, typically a forward-looking technical sign that downside momentum is waning and the stock may form a short-term bottom. Additionally, the Rate of Change indicator suggests 'severely oversold, possible bottom formation.' These frequent oversold signals resonate strongly with host Simon’s observations on the [HKEX Podcast] on January 14th, noting 'the stock has dropped quite a bit' and 'technical signals are mainly showing buys'.](https://nnqimage.futunn.com/sns_client_feed/1162342/20260119/web-1768807282493-ogySAyu1Bj.jpeg/big?area=1&is_public=true&imageMogr2/ignore-error/1/format/webp)
#Learn Warrants and Bull/Bear Certificates with Jenny# Key Analysis: Why is 'Out-of-the-Money Degree' so important?
When trading warrants, the 'out-of-the-money degree' is another core consideration alongside leverage. Deep out-of-the-money warrants (like the call warrant mentioned in the [HK Stocks Podcast] with a strike price of $51.11), while cheap with potentially high leverage, require an enormous rise in the underlying stock to become in-the-money, making their success rate extremely low and time value decay fastest. On the other hand, slightly out-of-the-money or near-the-money warrants (like the call warrant with a strike price of $40) have more reasonable requirements for stock appreciation and better correlation with stock price movements. Simon's reminder to 'not buy products that are too far out-of-the-money' is aimed at avoiding the high risk of deep out-of-the-money warrants turning into 'waste paper'.
V. Interactive Questions
Facing the intense collision between frequent oversold signals on Xiaomi's current technical indicators and market views labeling it as 'severely lagging,' how will your strategy tilt?
1. Are you more inclined to trust leading technical indicator signals, considering a left-side position near the $35.4 support area using Societe Generale bull certificates (62507) with a call price of $35, betting on an oversold rebound?
2. Or would you rather be more cautious, waiting for the stock price to break through the short-term resistance level of $38.4 with significant volume to confirm the rebound before considering right-side follow-up with BOC call warrants (22824) having a strike price of $40?
3. Alternatively, you may agree with the view that the market is weak, considering the rebound as a temporary phenomenon. Are you focusing on the resistance zone near $40 and using UBS Group bear certificate (69732) to capture potential opportunities for another downturn?
Feel free to share your insights and trading logic in the comments section. Derivatives are high-risk investment products, and their prices can rise or fall sharply; investors may lose all of their principal. Before making any investment decisions, be sure to carefully read the relevant listing documents to fully understand the product characteristics and risks (including time value decay, implied volatility changes, and forced recall mechanisms). For more real-time analysis and in-depth interpretation of Hong Kong stocks and derivatives, follow "Hong Kong Warrants Jenny".
This article does not constitute any investment advice.
This article is for reference only and does not constitute any investment advice. The market data, opinions, and analysis contained herein may change at any time without prior notice. We shall not be liable for any loss or damage arising from reliance on the information in this article. Technical analysis merely indicates whether certain technical conditions are met; a comprehensive evaluation of asset performance should incorporate additional data. Trading decisions should not be based solely on the content of this article. Please note that past performance is not indicative of future results.
#Xiaomi Group #01810 #Technical Analysis #Oversold #Support and Resistance Levels #Warrants #Bull and Bear Certificates #Out-of-the-Money Degree #Hong Kong Stock Podcast #Market Divergence
Risk Disclaimer: The above content only represents the author's view. It does not represent any position or investment advice of Futu. Futu makes no representation or warranty.Read more

Comments
to post a comment
1
8