Integrating Hong Kong Stock Podcast Strategy: Derivatives Deployment Approach for SMIC Amid 'Breakout and Overbought' Conditions
$SMIC (00981.HK)$ As of January 16, 2026, the share price of SMIC (00981.HK) closed at HKD 78.55, up 1.55%, reaching a high of HKD 79.7 during the session, marking the third consecutive day of gains with an accumulated increase of 6.8%. The stock price has successfully broken through key recent levels such as HKD 75.4 and HKD 77.5, technically exhibiting a strong 'breakout' pattern. This upward movement has primarily benefited from better-than-expected recovery in the semiconductor sector, robust earnings reports from leading companies, and favorable sector rotation. This article will integrate the latest technical signals, market dynamics, and derivatives data to analyze its short-term trading value and warrant deployment strategies for investors.
Technical Analysis: Strong Breakout Confirmed, Overbought Correction Risk Rises Simultaneously
From the daily chart observation, SMIC has confirmed a short-term upward trend. Not only has the share price stabilized above all major moving averages, but on January 15, it also exhibited a 'breakout' pattern, where the stock price broke out of a narrow consolidation range around HKD 74.5, moving upwards. This is typically a clear signal of strengthening short-term technical momentum. Currently, the 10-day line (HKD 75.79) and the 30-day line (HKD 70.96) are forming a bullish alignment, providing fundamental support for the stock price.
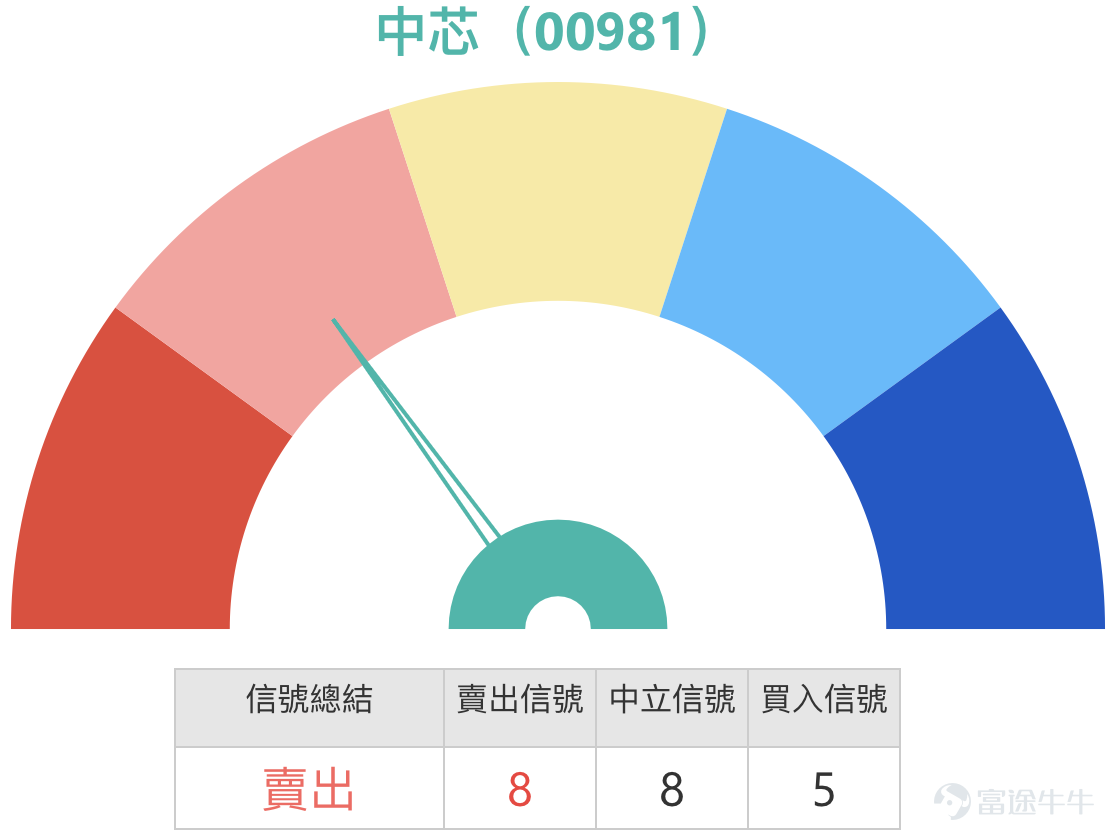
However, the rapid rise has also accumulated significant technical correction risks. Several key indicators have issued strong warnings: the Relative Strength Index (RSI) is as high as 70, clearly entering the overbought region; multiple oscillators also confirm being in an 'overbought state'. More notably, the technical indicator summary shows eight 'sell' signals, indicating that although the trend remains upward, market momentum may be overextended in the short term, and profit-taking pressures are building. This coexistence of 'breakout' and 'overbought' conditions constitutes the core contradiction in current short-term trading.
Therefore, the key trading range around the current price is very clear. Above, the first major resistance level is at 80.8 yuan, which is both a psychological integer threshold and close to the key technical level of 80 yuan. If the market can effectively break through with volume in the future, the next target will be 84.9 yuan. Below, the first support level is at 74.2 yuan, which coincides with the upper boundary of the consolidation range before the recent breakout, now turning into support. If this position fails, the pullback may further test the more critical second support level at 68.4 yuan, which is near the medium-term support of 68 yuan.

Market Dynamics: Industry Recovery and Active Capital Engagement
The strong performance of SMIC recently is embedded in the broader recovery context of the entire semiconductor sector. At the industry level, research firms predict that global 8-inch wafer fab utilization will significantly increase by 2026, potentially entering a new price adjustment cycle, with activity exceeding expectations. Leading company TSMC reported record quarterly net profits and raised its capital expenditure and revenue guidance, reinforcing market optimism for the supply chain. Additionally, long-term drivers from emerging demands such as AI continue to provide valuation support for the sector.
In this environment, market funds are increasingly active in trading SMIC. On January 15, there was a large buy order in the morning session, involving 462,500 shares and approximately 34.87 million yuan, indicating significant institutional participation during the stock’s breakout. Observing sector correlations, from January 14 to 16, stocks like Huahong Semiconductor and SMIC took turns leading gains, driving up Hong Kong-listed semiconductor stocks collectively, with evident fund rotation characteristics.[BOC Guest Commentary] previously noted that developments surrounding localization (such as lithography machine testing) often significantly boost investor enthusiasm for the chip sector, prompting continued inflows into bullish positions. The current market exuberance bears resemblance to that scenario.
Warrant Product Review: Amplified Leverage Effects During High-Volatility Periods
The recent performance of the warrant market provides a vivid example of the capital efficiency of derivatives when tracking highly volatile underlying stocks. For instance, on January 14, 2026, several products mentioned saw returns multiple times higher than their underlying stocks amid a 3.55% rise over two days due to intrinsic leverage attributes. Among them, BOC Bull Certificate (65935) $BI#SMIC RC2612A.C (65935.HK)$ and UBS Group Bull Certificate (66546) $UB#SMIC RC2607L.C (66546.HK)$ surged by 61% and 54%, respectively, while Societe Generale Call Warrant (21038) and BOC Call Warrant (13923) also recorded increases of 25% and 20%, respectively. This data clearly shows that, under correct short-term market direction judgment, using warrant tools can significantly enhance capital efficiency and capture segment gains. Of course, it also means losses can be quickly magnified by leverage if the prediction is wrong.

Advantages of Derivative Products and Current Deployment Strategies
Bullish deployment strategy: If investors believe the industry outlook is strong enough to support the stock price in digesting overbought pressure and challenging higher resistance levels, they may consider call warrants or bull contracts. For example, BOC call warrant (13923). $BI-SMIC@EC2606C.C (13923.HK)$ Strike price at HKD 88.05, offering approximately 4.4x leverage, making it the highest-leveraged call warrant on the recommended list. Societe Generale call warrant (21038). $SG-SMIC@EC2603C.C (21038.HK)$ Strike price at HKD 88.93, with leverage of about 7.5x, and its premium is the lowest among similar products. The strike prices for both products are much higher than the second resistance level at HKD 84.9, making them deep out-of-the-money options suitable for betting on a sustained upward trend. Investors who wish to avoid time decay can focus on bull contracts. UBS bull contract (66546). $UB#SMIC RC2607L.C (66546.HK)$ Recovery price at HKD 70, BOC bull contract (65935) recovery price at HKD 71.3. Both are far below the first support level at HKD 74.2 and maintain a safe distance from the second support level at HKD 68.4, with actual leverage of 7-8x providing higher efficiency.
Bearish or hedging deployment strategy: If investors expect the stock price to face technical pullbacks near the resistance level at HKD 80.8 due to being overbought, they can consider put warrants or bear contracts. BOC put warrant (21097). $BI-SMIC@EP2605A.P (21097.HK)$ UBS put warrant (21404), with strike prices at HKD 68.88 and HKD 68.83 respectively, offers leverage of about 4.3 to 4.5x. Their strike prices closely align with the second support level at HKD 68.4, making them tools for hedging against significant downside risks. Among bearish instruments, bear contracts offer higher leverage. BNP Paribas bear contract (63720) has a recovery price at HKD 82, and HSBC bear contract (63852) has a recovery price at HKD 83, with actual leverage reaching up to 23.3x and 18x respectively. Their recovery prices are only slightly above the first resistance level at HKD 80.8, representing an aggressive deployment aimed at precisely capturing immediate pullbacks after a price surge, but carrying a high risk of forced recovery.


#LearnWarrantsAndBullBearWithJenny# Key Insights: What risks should you consider before investing in structured products?
Investing in structured products such as CBBCs (Callable Bull/Bear Contracts) and warrants, while pursuing capital efficiency, requires clear recognition of their unique risks, which are significantly more than those associated with trading common stocks.
First and foremost is the issuer credit risk. CBBCs and warrants represent unsecured debts of the issuer, and their fulfillment entirely depends on the issuer's creditworthiness.
Secondly, there is leverage risk and the risk of total principal loss, which are the most critical risks. Their price volatility is far greater than that of the underlying stock, potentially bringing high returns but also leading to complete principal loss. For instance, if SMIC’s stock fails to rise above the strike price of HKD 88.05 by the expiration date, the value of the BOC call warrant (13923) could fall to zero. Meanwhile, once SMIC’s share price hits the recovery price of HKD 82 for the BNP Paribas bear contract (63720), regardless of subsequent movements, the bear contract will be forcibly recovered. For common R-type products, investors may not recover any residual value.
Additionally, there are risks such as time decay (warrant value diminishes over time), market liquidity risk (wide bid-ask spreads), and implied volatility changes. Therefore, investors must carefully read the listing documents before trading and fully understand the product features.
In the face of this complex situation with SMIC, where 'technological breakthrough' and 'overbought indicators' coexist, how will your strategy make a choice? Will you believe in industry trends and capital momentum, deploying bullish warrants for the next upward move when the stock price pulls back to the support level near 74.2 yuan; or will you prioritize respecting the warnings from technical indicators, paying attention to Jenny's insights on Hong Kong warrants when the stock price approaches the resistance level at 80.8 yuan, gaining more practical warrant knowledge and market dynamics analysis?
#SMIC #TechnicalAnalysis #SupportAndResistance #Warrants #BullBearCertificates #Semiconductors #LeverageRisk #HongKongStockDeployment #CapitalFlow #RiskManagement
This article does not constitute any investment advice.
This article is for reference only and does not constitute any investment advice. The market data, opinions, and analysis contained herein may change at any time without prior notice. We shall not be liable for any loss or damage arising from reliance on the information in this article. Technical analysis merely indicates whether certain technical conditions are met; a comprehensive evaluation of asset performance should incorporate additional data. Trading decisions should not be based solely on the content of this article. Please note that past performance is not indicative of future results.
Risk Disclaimer: The above content only represents the author's view. It does not represent any position or investment advice of Futu. Futu makes no representation or warranty.Read more

Comments
to post a comment
1
8