

Hong Kong-listed AI 'twin leaders' see active trading! How to position in the AI sector for the Year

January 15th [Hong Kong Stock Podcast] Hang Seng Index, Hua Hong Semiconductor, Ganfeng Lithium, NetEase, Hong Kong Exchange, China Construction Bank
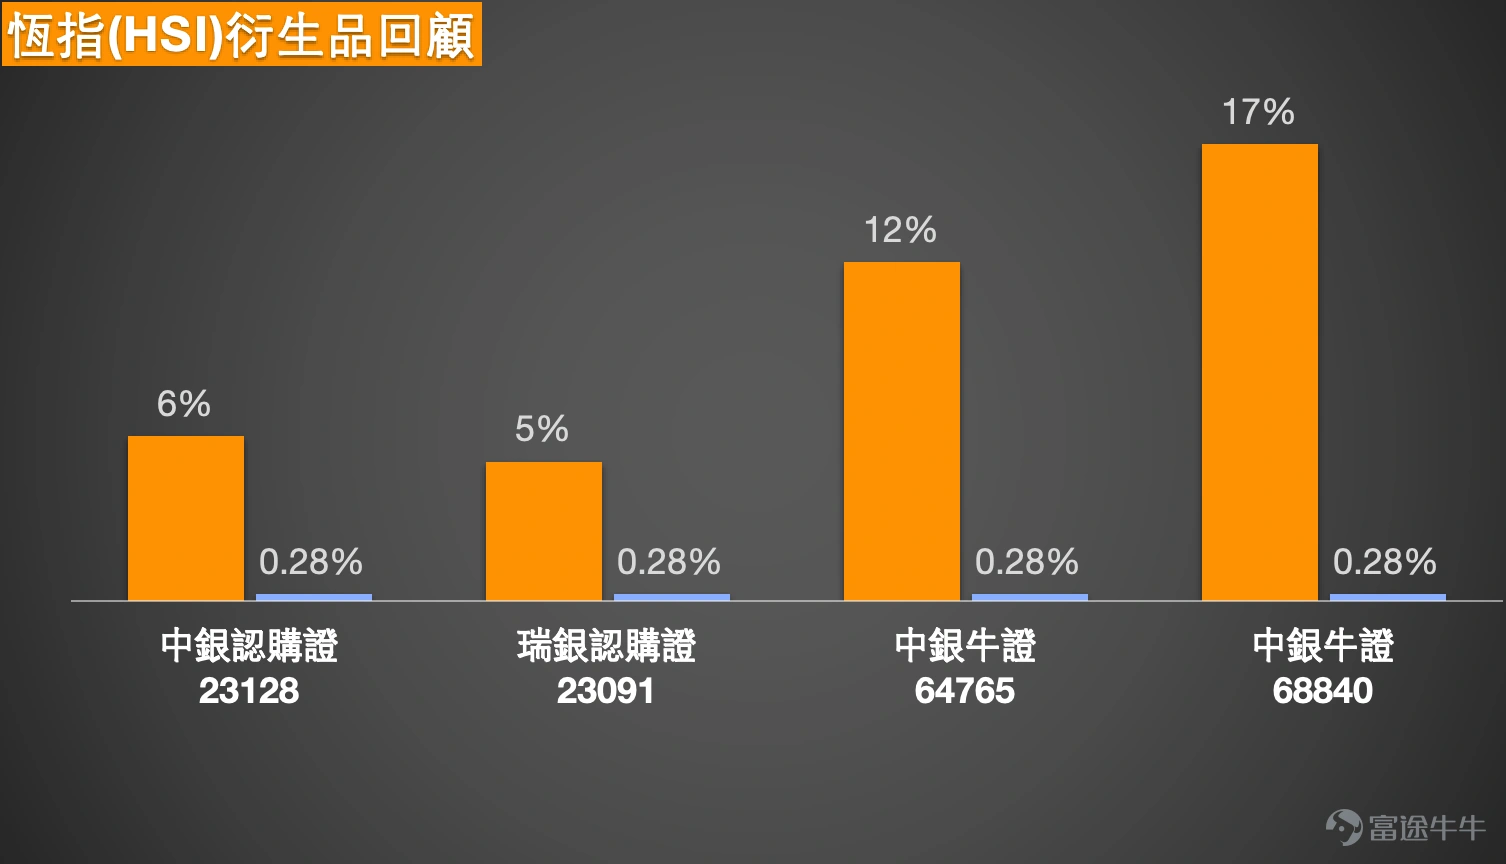
1. Hang Seng Index: Investors expressed that it would not decline, predicting a 500-point rise before falling again, and chose to hold bullish warrants overnight with a stop-loss level at 25,500 points; some bearish investors believe the market has not yet broken out of the sideways trend and will continue with bearish positions tomorrow.
Simon: Hello everyone, let’s review today's (January 15th) Hong Kong stock market performance. Today, we saw the Hang Seng Index briefly test higher levels, surpassing 27,000 points. However, based on the closing price, the index slightly retreated and closed around 26,923 points, which likely disappointed some investors. Nevertheless, those optimistic about the future remain positive, believing that the Hang Seng Index is unlikely to drop significantly from its current level. Looking back over the past few days, the Hang Seng Index has mostly stayed around 26,900 points despite fluctuations, but optimistic investors feel that a rapid decline in the short term is less likely.
Interestingly, there’s another perspective suggesting that the Hang Seng Index might rise a little further before declining. In other words, although optimistic investors are still bullish in the short term, they’re somewhat concerned that the upward momentum may not be sustained, thinking it could first experience a small rally before falling. Hence, even optimistic investors aren’t overly aggressive; on the contrary, bearish investors either think the current trend reflects a consolidation phase, so they expect a potential reversal downward under this sideways movement. Ultimately, it’s normal for the market to have both bulls and bears.
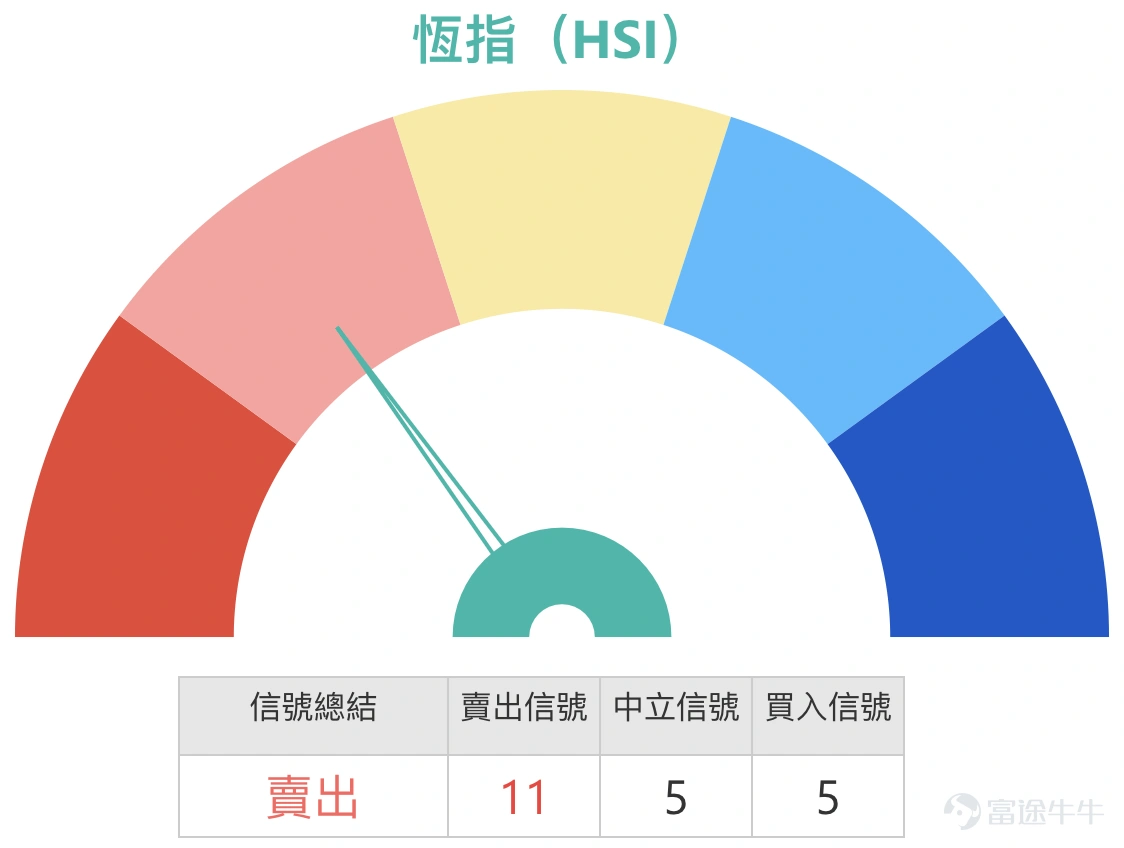
If we look at technical signals, ‘sell’ signals currently dominate. After all, the Hang Seng Index has risen to a relatively high level recently, so overall, from a technical analysis perspective, sell signals outweigh buy signals for now, providing some reference. If we look at support levels, it might go down to around 26,200 points, which is the current support; if it continues to fall, it could reach 25,700 points, though whether it will drop to 25,700 so quickly remains to be seen. But if it does decline, the first test will be whether it can hold above 26,200 points.
Therefore, investors planning to buy bullish warrants should take note because the current support level could be around 25,700 points. Choosing products with stop-loss levels below 25,700 points will be relatively safer. In the market, there are many choices available, such as products linked to 25,700, 25,600, or even 25,500 points, with leverage close to twenty times, and some reaching up to twenty-one times. With so many options, investors need to carefully compare terms like different premiums, leverage, and stop-loss distances to assess their risk tolerance. $BI-HSI @EC2605B.C (23128.HK)$$UB-HSI @EC2605B.C (23091.HK)$$BI#HSI RC2808Z.C (64765.HK)$$BI#HSI RC2808O.C (68840.HK)$
2. Hua Hong Semiconductor (01347.HK): The market has started to heat up around semiconductors again; what’s the next resistance level? Investors are eyeing bearish warrants in the range of HKD 100-105.
Simon: The first stock I want to discuss with everyone is Hua Hong Semiconductor (01347). Let’s first take a look at its price trend. On January 15, Hua Hong Semiconductor performed quite well; it hit an intraday high of HKD 99.95, just shy of breaking through HKD 100, which can be considered a multi-month high. In fact, since mid-December, Hua Hong Semiconductor's share price has maintained an upward trajectory, and the overall uptrend remains intact for now. However, investors should note that, based on the closing price of HKD 99.45, the stock is already close to the upper Bollinger Band (calculated on a daily chart), so this is something to keep in mind.
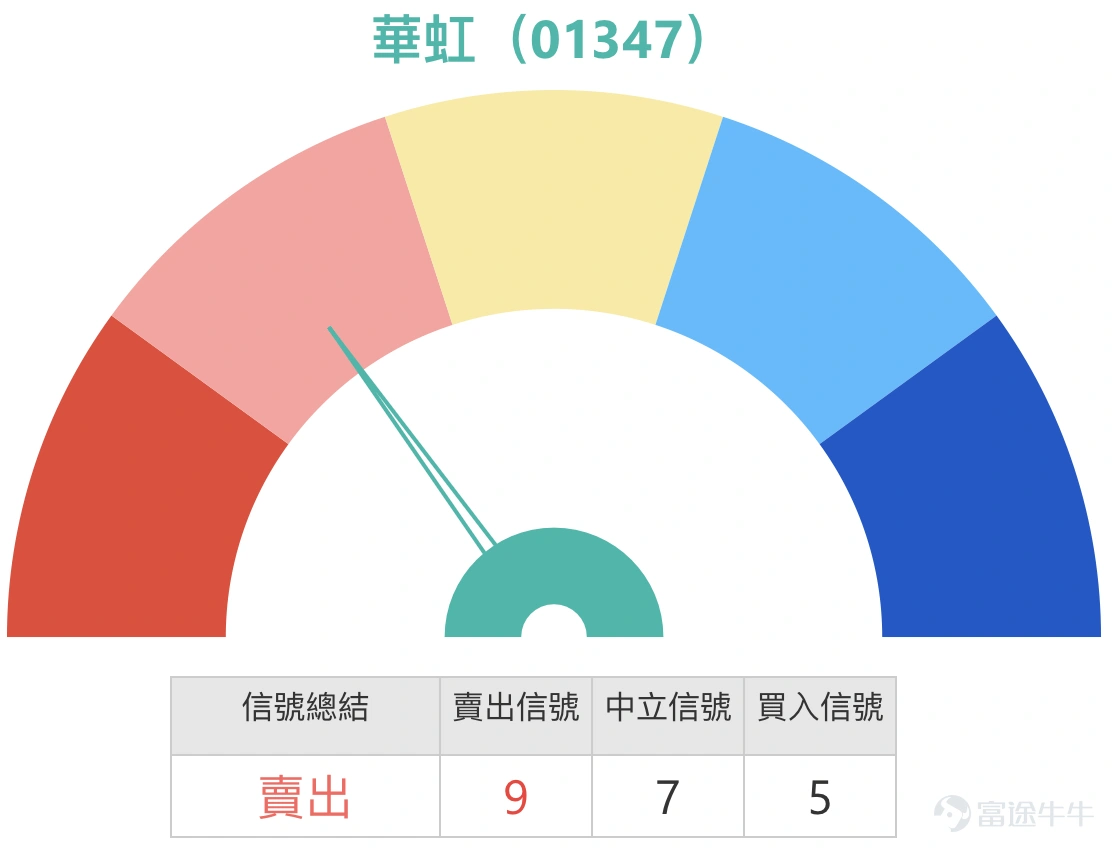
Investors also believe that Hua Hong Semiconductor could continue to rise, so some have asked where the current resistance level might be. At present, the resistance level for Hua Hong Semiconductor appears to be around HKD 105. If it breaks above HKD 105, there may be further upside potential towards HKD 117.7. Therefore, some investors think that the stock price might continue to increase, leading to a so-called bullish momentum chase. Given that the short-selling pressure could be concentrated within the HKD 100-105 range, technically speaking, HKD 105 does act as a resistance level, which I offer for your reference. As mentioned earlier, while Hua Hong Semiconductor has shown good gains recently, from a technical analysis perspective, the signal still leans more toward 'sell,' which is another point for your consideration. $BI#HUAHORC2612A.C (65970.HK)$$BIHUAHO@EC2604B.C (15312.HK)$$GJHUAHO@EC2604A.C (23085.HK)$$UB#HUAHORC2607N.C (65160.HK)$

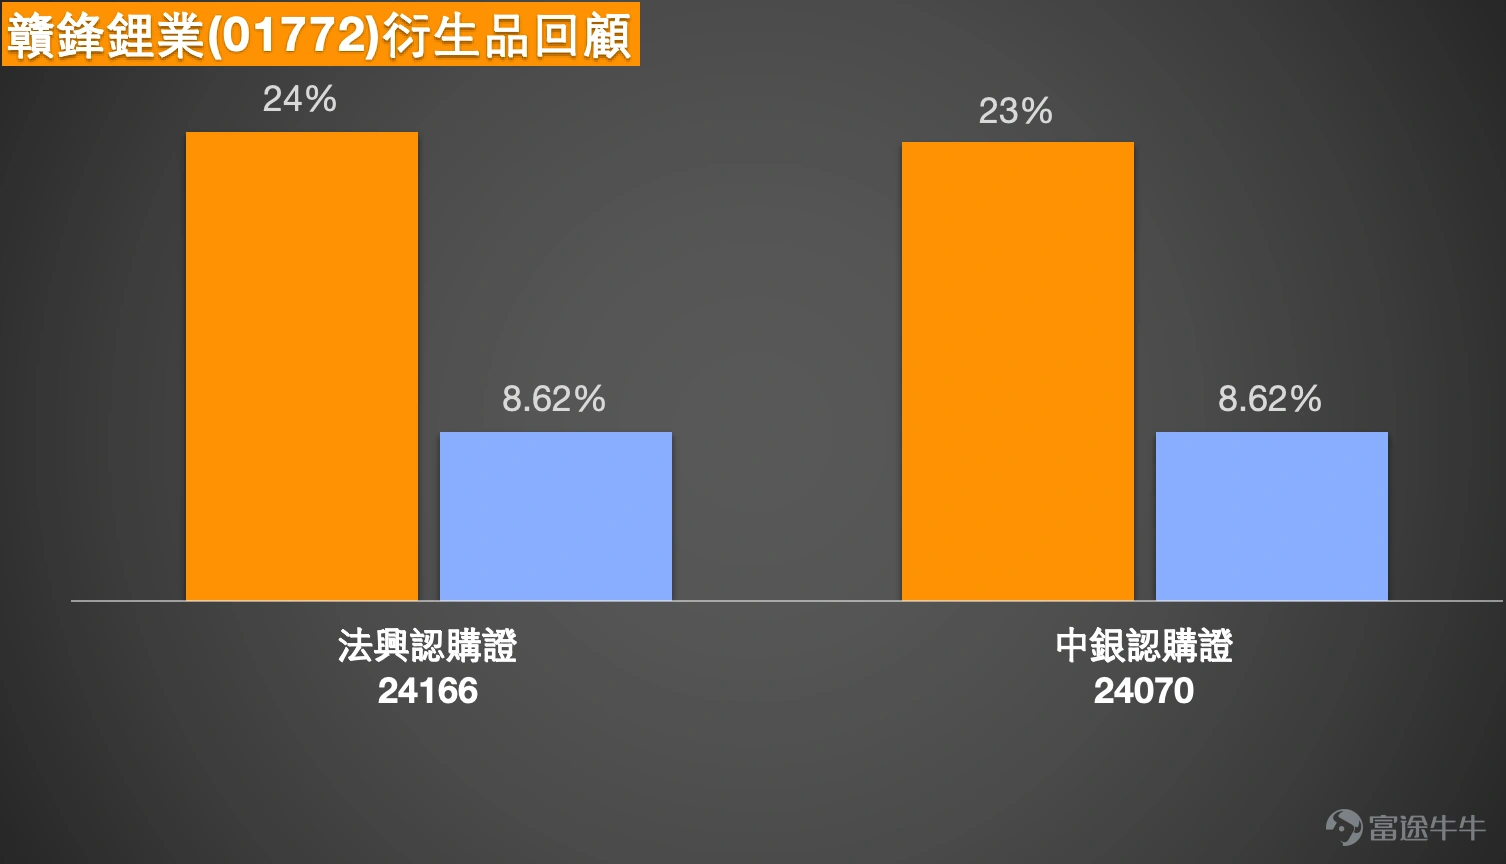
3. Ganfeng Lithium (01772.HK): Is it a good time to buy now? Investors are targeting prices between HKD 70-80, holding call warrants with a strike price of HKD 75.4.
Simon: The next stock I'd like to review with you is 1772 Ganfeng Lithium, and we’ll start by examining its price trend. Ganfeng Lithium also had a strong performance today (January 15), showing some similarities to Hua Hong Semiconductor. Since mid-December or even early December, the stock has been maintaining an upward trend, albeit with noticeable fluctuations or corrections along the way. Overall, however, the stock has stayed on an upward trajectory throughout January. During today's session, the stock briefly reached HKD 67.55, surpassing the upper Bollinger Band, and closed at HKD 66.8, remaining above the upper band.
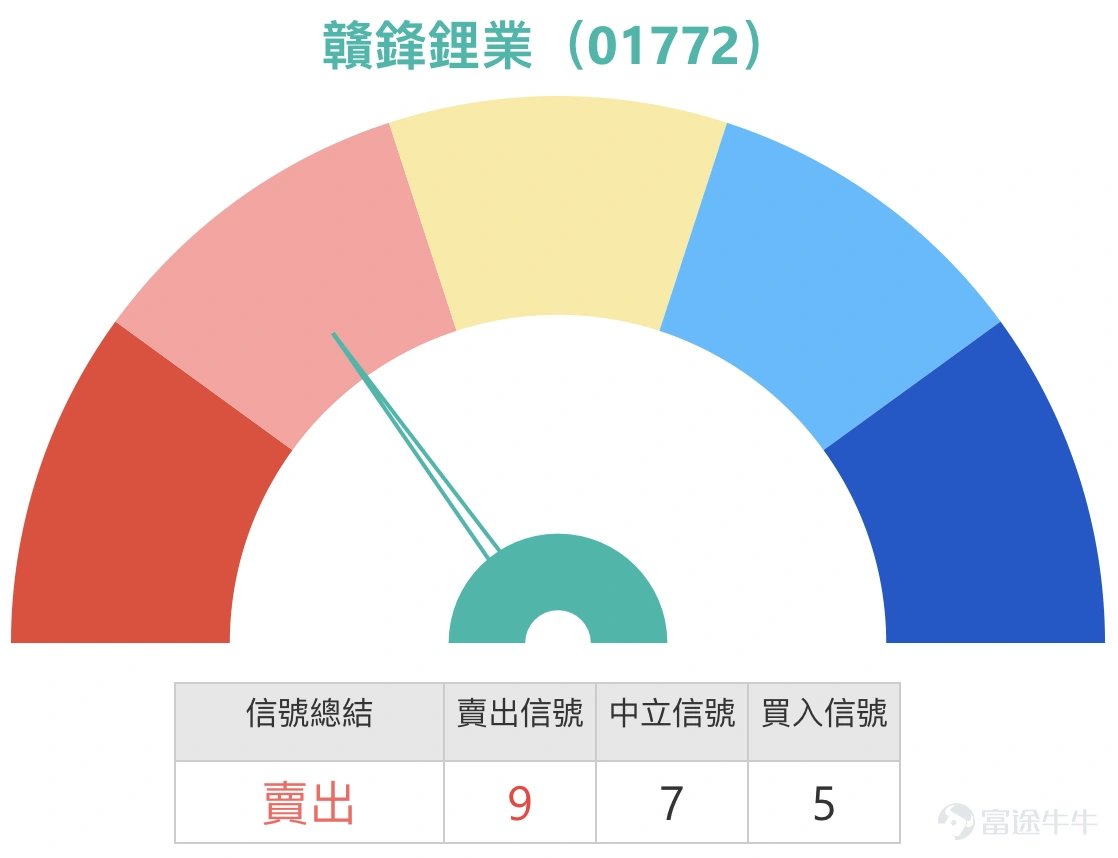
Investors are wondering how the stock will perform after reaching these recent highs. Is it worth considering buying now? To summarize the technical signals, Ganfeng Lithium currently shows a predominant sell signal with 9 sell signals versus 5 buy signals. While the stock’s recent surge has been impressive, given that it has been rising for some time, whether or not to enter now depends on your confidence in this particular stock. Considering the significant rise and the prevailing sell signal, one must wonder if history might repeat itself like it did at the end of December when the stock broke above the upper Bollinger Band but later retreated back to near the middle band. Could we see a similar correction after a technical divergence? Should you wait for that moment to gradually deploy? This decision is left for investors to ponder.
For now, the summary of technical indicators still suggests a sell bias. Additionally, let me provide you with a support level reference: the short-term support is approximately HKD 58.4. If it breaks below that, it could drop to HKD 55.6. HKD 55.6 is roughly the midpoint of the Bollinger Bands (calculated on a daily chart). If you're concerned about potential changes to the band, remember HKD 55.6 as a key reference point. $SGGANFE@EC2607A.C (24166.HK)$$BIGANFE@EC2607A.C (24070.HK)$
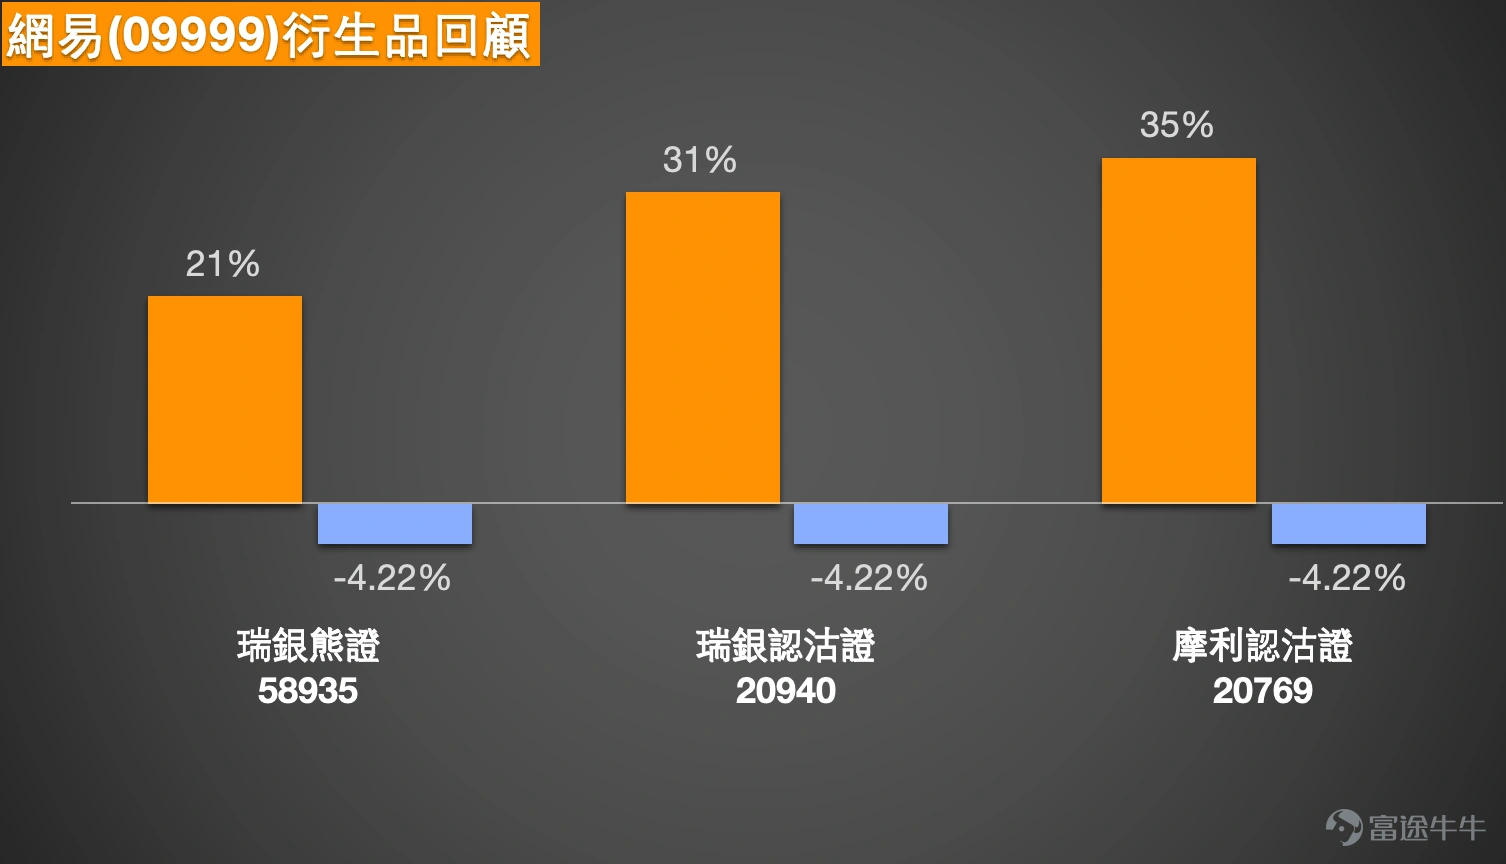
4. NetEase-S (09999.HK): After three consecutive days of decline, will HKD 208 hold as support?
Simon: Let's first review its stock price movement today (January 15). Though NetEase's stock code is easy to remember, its price action has certainly been memorable due to the sharp declines. The drop isn't just limited to today, though the decline was more pronounced. Over the past two days, the stock has already seen significant adjustments from higher levels, touching the upper Bollinger Band but failing to sustain momentum, resulting in a pullback. For two consecutive days, the stock has been on a downward trend. Thus, some investors are asking: after three straight days of losses, where might the support level be and should they rush to buy? This cautious approach—waiting for confirmation of support before taking action—is indeed correct. Sometimes, waiting for the price to stabilize is necessary before making further moves.
Currently, the support level for NetEase is around HKD 206, which aligns with the lower Bollinger Band. If it breaks below HKD 206, the price could retreat into the '100s' with the next support level at approximately HKD 190.7. So for now, the data suggests a support level around HKD 206, which is important to keep in mind. $UB#NTES RP2701A.P (58935.HK)$$UB-NTES@EP2603A.P (20940.HK)$$MS-NTES@EP2603A.P (20769.HK)$
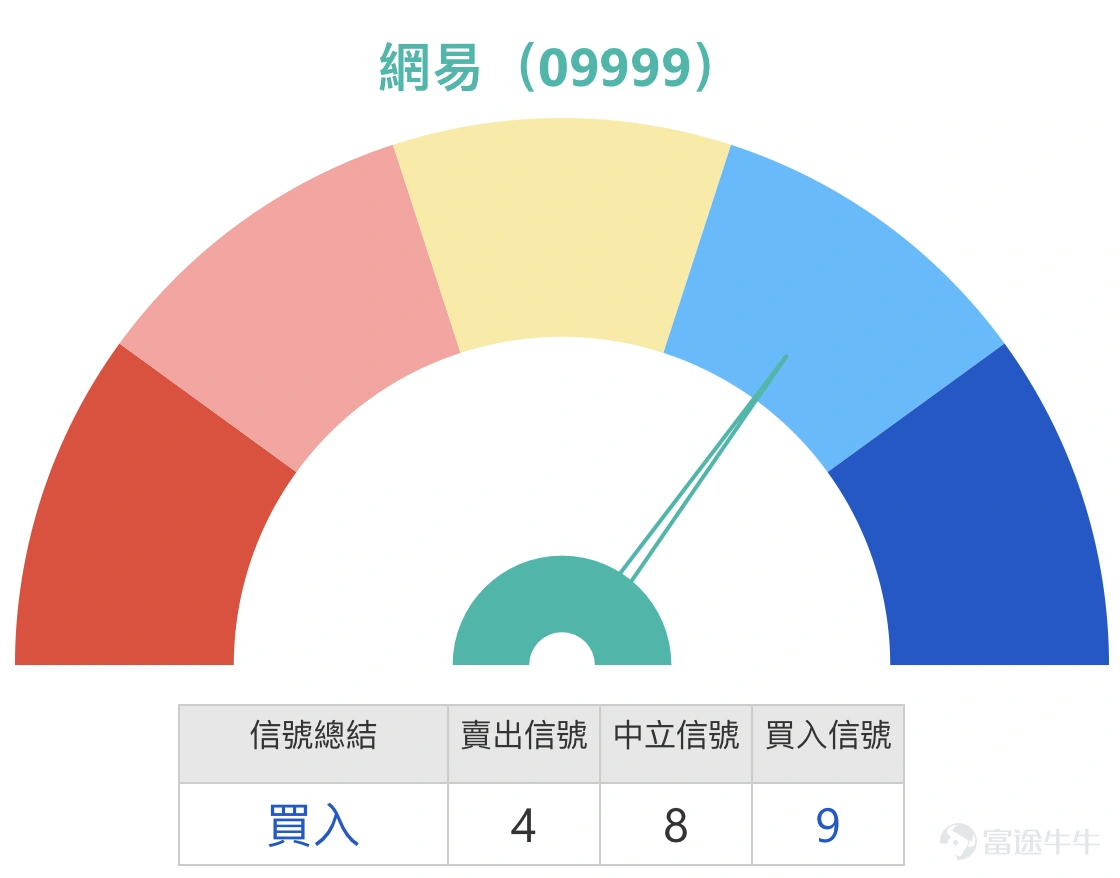
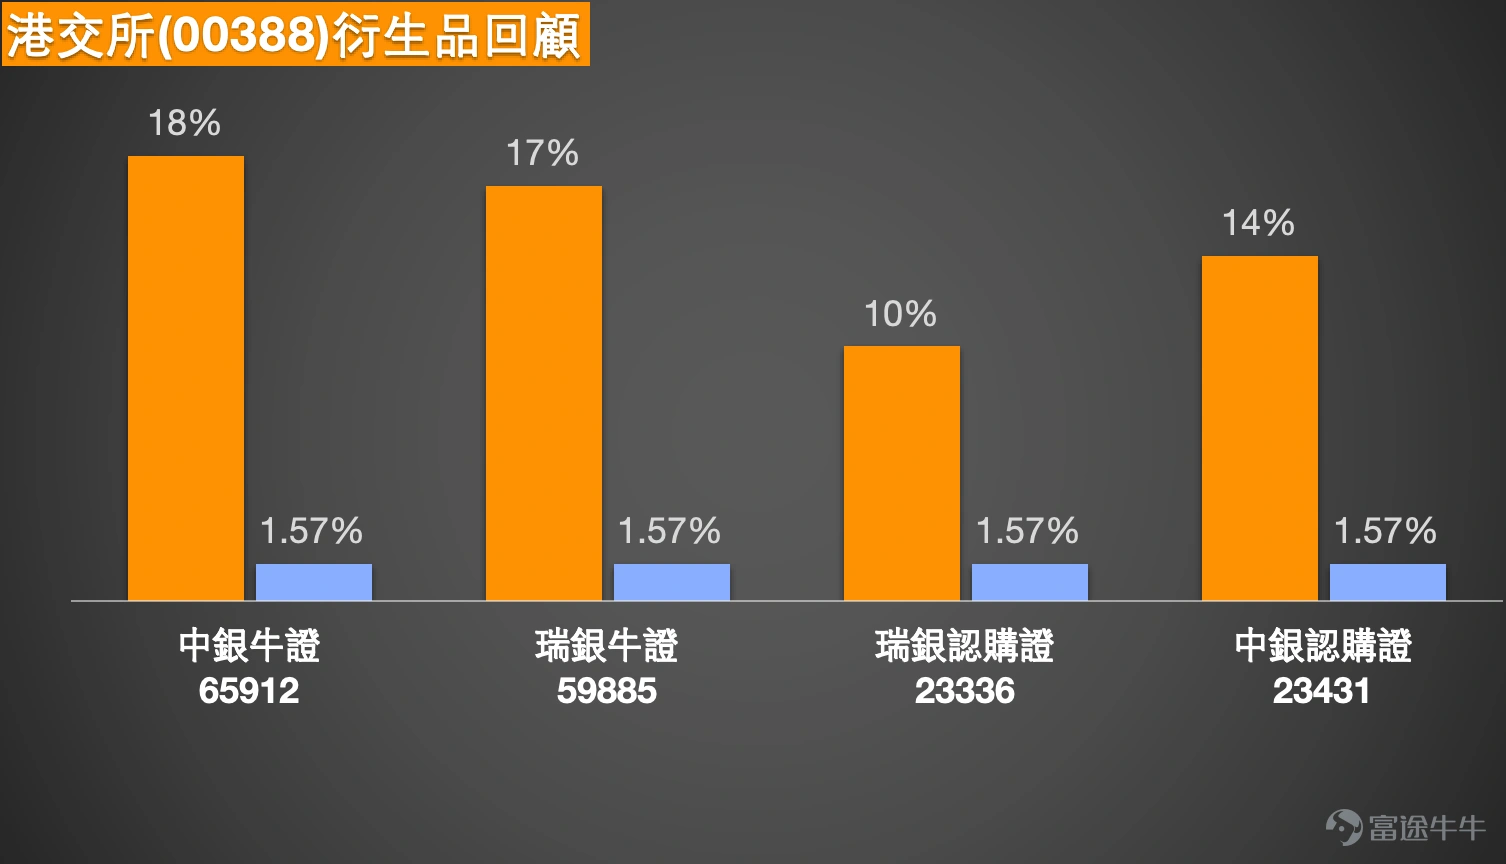
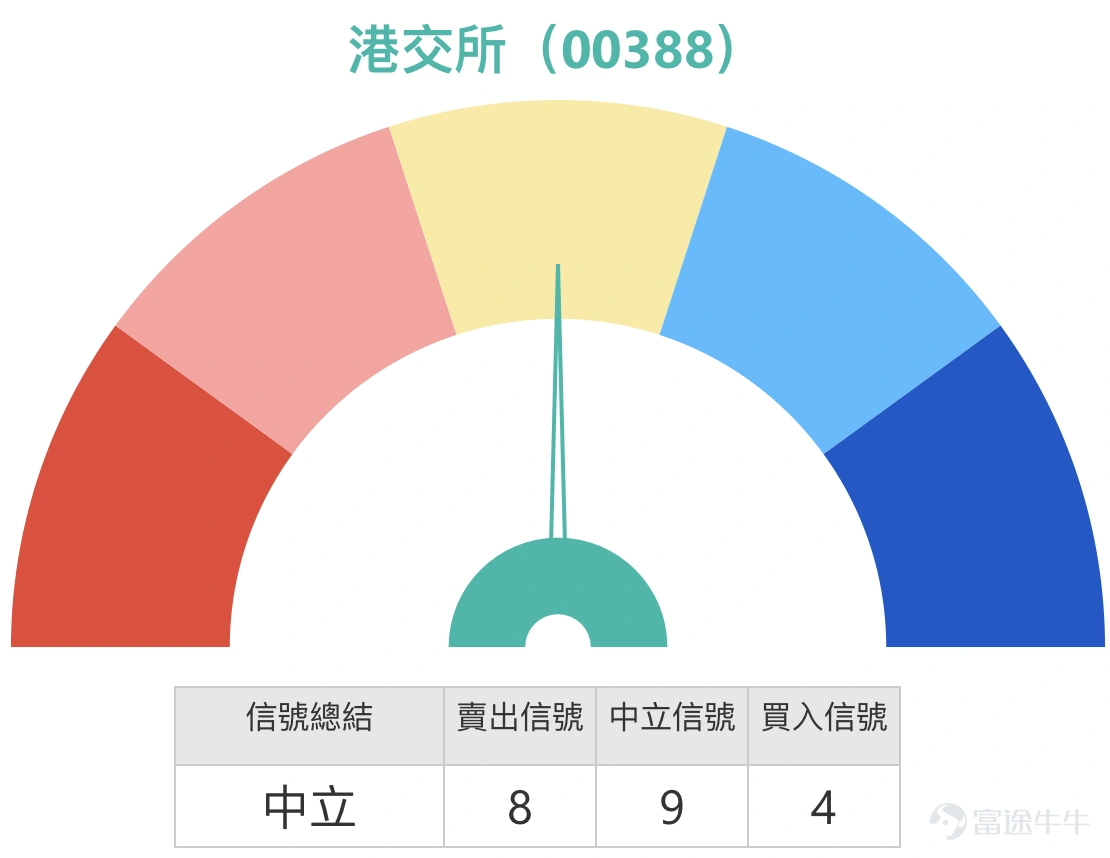
5, Hong Kong Exchange (00388.HK): Investors are asking whether 440 will face significant resistance? In the warrant market, some investors hold bearish certificates with a recovery price of 458.
Simon: The next stock I want to discuss with everyone is the Hong Kong Exchange. Let’s first take a look at its price movement. Today (January 15), the stock showed a slight increase. In fact, since mid-December, the price has been on an upward trend. If we look from mid-October until now, over nearly a month, the stock price has risen by approximately 10%. Although there have been ups and downs during this time, the overall increase is about 10%. The intraday high today reached 439.8, close to 440, but it slightly retreated at the closing, ending at 438.6.
Some investors are asking whether 440 could be a resistance level. For now, the resistance level for the Hong Kong Exchange is actually higher, around 443. This price is slightly above the current top of the Bollinger Band. If it breaks through 443, it may continue rising towards 461. Therefore, if you're focusing on its bearish products, it’s recommended to choose those with a recovery price above 460, because although the current resistance is at 443, if it continues rising, it could reach 461. Hence, choosing a product with a recovery price above 460 would be safer.
In the market, related products with recovery prices of 468, 470, or even within 475 are available. Moreover, their leverage is more than tenfold, with some nearing 13 times, which is quite good. So there's no need to take on the risk of closer recovery prices, especially since there are already sufficient product choices in the market with leverage exceeding tenfold. When selecting products, compare different recovery prices and terms. There are many options in the market, so take your time choosing.
6, China Construction Bank (00939.HK): The price has broken its previous high; what’s the next resistance level? In the warrant market, some investors hold bullish certificates with a recovery price of 5.9.
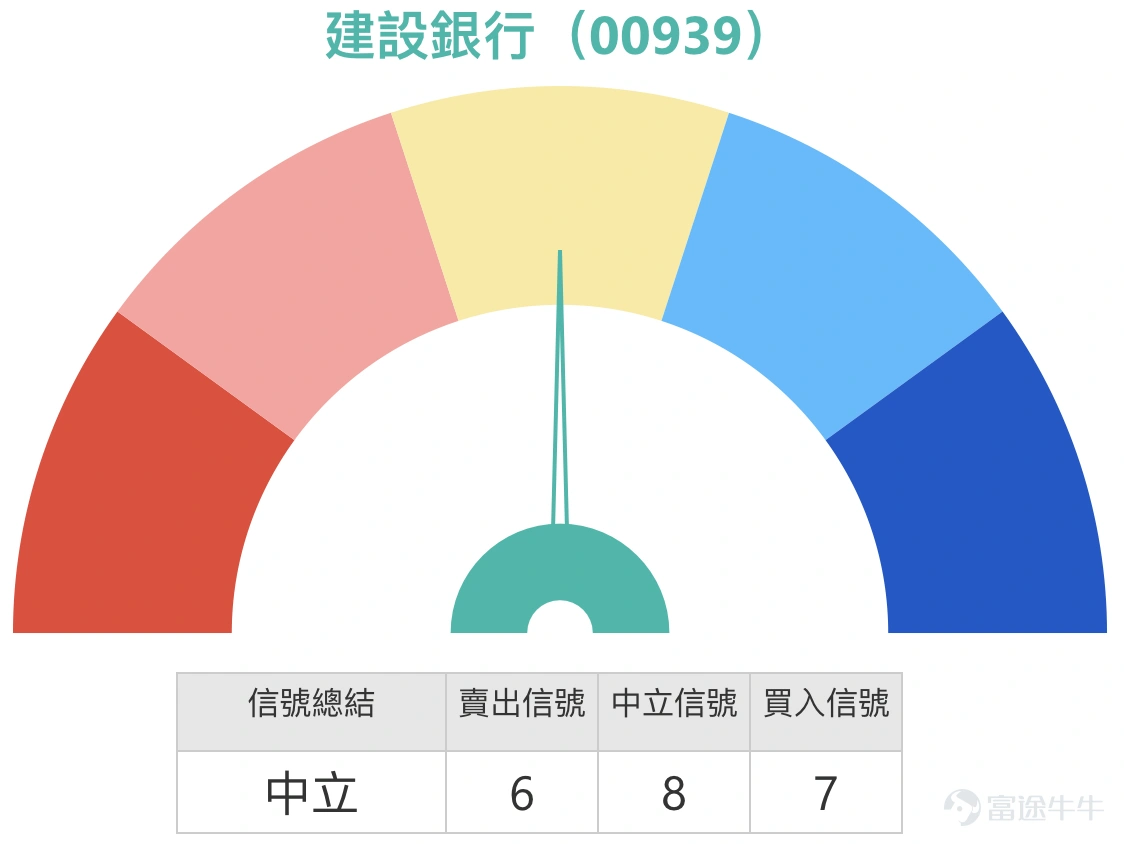
Simon: Let's take a look at its price movement today (January 15). China Construction Bank's intraday price once broke through the top of the Bollinger Band, but the closing price ended around 7.85. Overall, the price still increased. Though it briefly moved above the upper band of the Bollinger channel, the closing price didn’t stay there, settling near 7.85. Investors are wondering, if it continues to rise, where would the next resistance level be? Some investors in the market are continuing to hold its bullish certificates.
Here’s a reference point for resistance: currently, the resistance for CCB is around the 8-yuan mark. After breaking through 8 yuan, it could move towards 8.25 yuan. For investors holding bullish certificates or considering buying them, here's a support level reference to avoid forced recovery of the certificates. The support for CCB is roughly around 7.65 yuan, and if it falls below that, it might drop to 7.45 yuan. So, when choosing bullish certificate products, it’s best to select those with a recovery price below 7.45 yuan.
There are also many bullish products in the market with recovery prices of 7 yuan or in the 6-yuan range. Leverage can go up to nearly 10 times; if you’re more aggressive, products with recovery prices around 7.1 or 7.28 can offer over 10 times leverage; if you prefer to be more conservative, products with a recovery price around 7 yuan provide leverage of about eight times. There are various products available in the market to choose from. It’s also important to pay attention to the premium of the products, as premiums vary significantly between different warrant products. Even though the leverage might seem similar, selecting products with lower premiums can benefit holders. So, in addition to comparing leverage and recovery prices, do check the premium values to find more competitive products. $JP#CCB RC2805C.C (60435.HK)$$UB#CCB RC2708C.C (62178.HK)$$BI-CCB @EC2606A.C (23426.HK)$$UB-CCB @EC2605C.C (23972.HK)$

That concludes today's sharing. Thank you for listening. If you have any questions regarding individual stocks or warrants, feel free to leave us a message. See you again tomorrow at the same time. Goodbye!
Disclaimer: This article does not constitute any investment advice.
This article is for reference only and does not constitute any investment advice. The market data, opinions, and analysis contained herein may change at any time without prior notice. We shall not be liable for any loss or damage arising from reliance on the information in this article. Technical analysis merely indicates whether certain technical conditions are met; a comprehensive evaluation of asset performance should incorporate additional data. Trading decisions should not be based solely on the content of this article. Please note that past performance is not indicative of future results.
Risk Disclaimer: The above content only represents the author's view. It does not represent any position or investment advice of Futu. Futu makes no representation or warranty.Read more

Comments
to post a comment
3
10