
[Warrant Perspective] The trading range of Hang Seng Index remains unchanged, leverage effect of warrant bull certificates becomes evident
January 15$Hang Seng Index (800000.HK)$
The day closed at 26,923.62 points, with a slight drop of 0.28% for the day. The 5-day volatility narrowed to 4.1%, with prices moving around the midpoint of the core range between Support 1 (26,259 points) and Resistance 1 (27,273 points). The technical picture shows a distinct 'tug-of-war' between bulls and bears.
From the perspective of combined technical indicators, there is a high degree of divergence in current market signals:
Trend indicators: MACD signal is buy, Bollinger Bands issue a buy signal, and the Ichimoku Cloud also provides a buy indication, reflecting potential for a rebound in the medium-term trend;
Oscillation indicators: Williams %R and Stochastic Oscillators enter overbought territory and issue sell signals, RSI records 66, at the 'critical point of the strong zone,' and the Psychological Line indicator remains neutral, indicating growing pressure from short-term profit-taking;
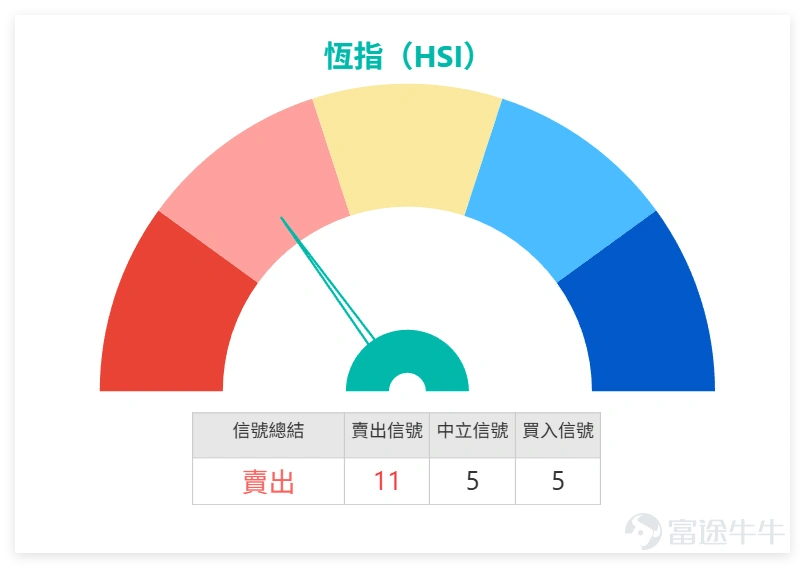
Strength Rating: The overall technical signal is 'sell,' but with an intensity of only 11, which falls into the 'weak sell' category, offering limited guidance for future performance.
Key levels to watch in the coming sessions include:Support below at 26,259 points, which overlaps with the MA30 technical support band (25,992.6 points), if this level holds on a pullback, the logic for upward movement remains intact. Above, 27,273 points acts as strong resistance.A surge in trading volume is needed to confirm the start of a trend reversal.
On January 15, the technical picture of key blue-chip stocks showed clear divergence, $HSBC HOLDINGS (00005.HK)$ 、 $HKEX (00388.HK)$ Stocks that stabilize above the three moving averages but with RSI entering the overbought zone are showing signs of pullback pressure; $CHINA MOBILE (00941.HK)$ RSI is only at 27, nearing the oversold edge, releasing a buy signal from a technical perspective; $SUNNY OPTICAL (02382.HK)$ Single-day leader with a solid close above MA10, indicating sufficient rebound momentum; $BABA-W (09988.HK)$ Although still above the moving averages, some stocks experienced significant single-day declines with a strong sell signal, facing heavy selling pressure. Most other stocks remain within a range bound by entangled moving averages, showing neutral technical signals. The market direction remains to be observed.
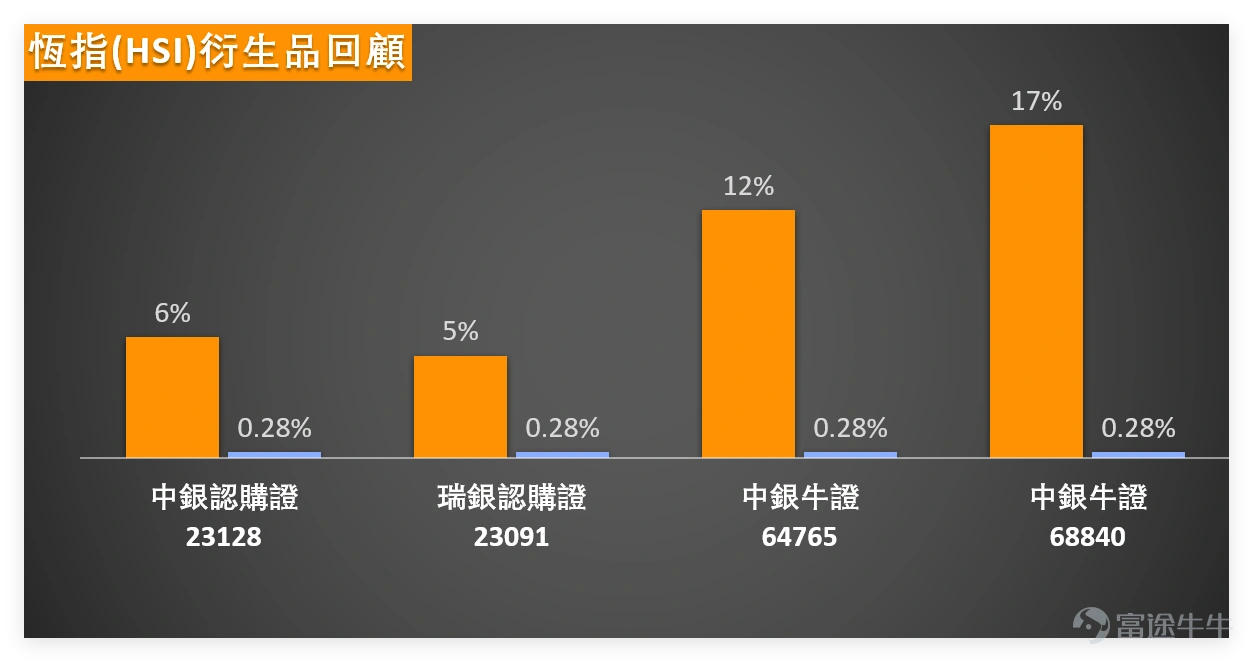
Product Review: Against the backdrop of a modest 0.28% rise in the Hang Seng Index, the tracked Hang Seng Index Warrants and Bull/Bear Contracts on January 13 achieved returns far surpassing those of the underlying stocks due to leverage, fully demonstrating the 'high-risk, high-reward' characteristic of derivatives.
(1) Bull Contracts: Leverage effect prominent, highest return reached 17%
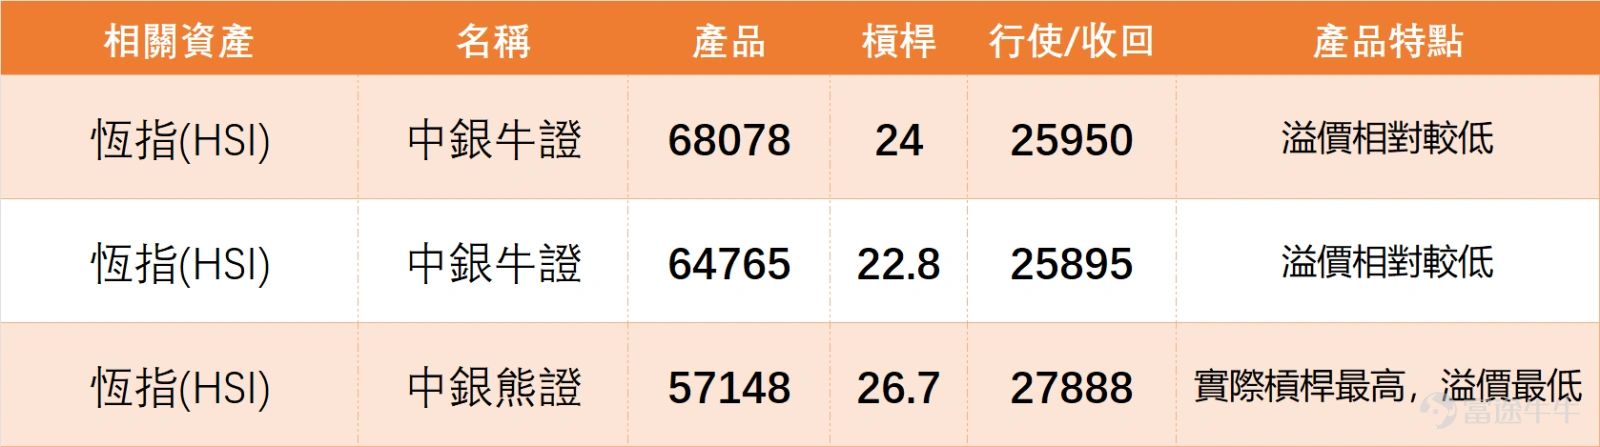
$BI#HSI RC2808O.C (68840.HK)$ : Single-day increase of 17%, making it today's top performer. This product has a recovery price at 25,950 points, close to Hang Seng Support 1 (26,259 points), categorizing it as an 'in-the-money bull contract,' which exhibits higher price elasticity during minor fluctuations in the underlying stock;
$BI#HSI RC2808Z.C (64765.HK)$ : Single-day increase of 12%, with a recovery price at 25,895 points, also qualifying as an in-the-money product with similarly impressive returns.
(2) Subscription warrant products: Stable returns suitable for conservative investors
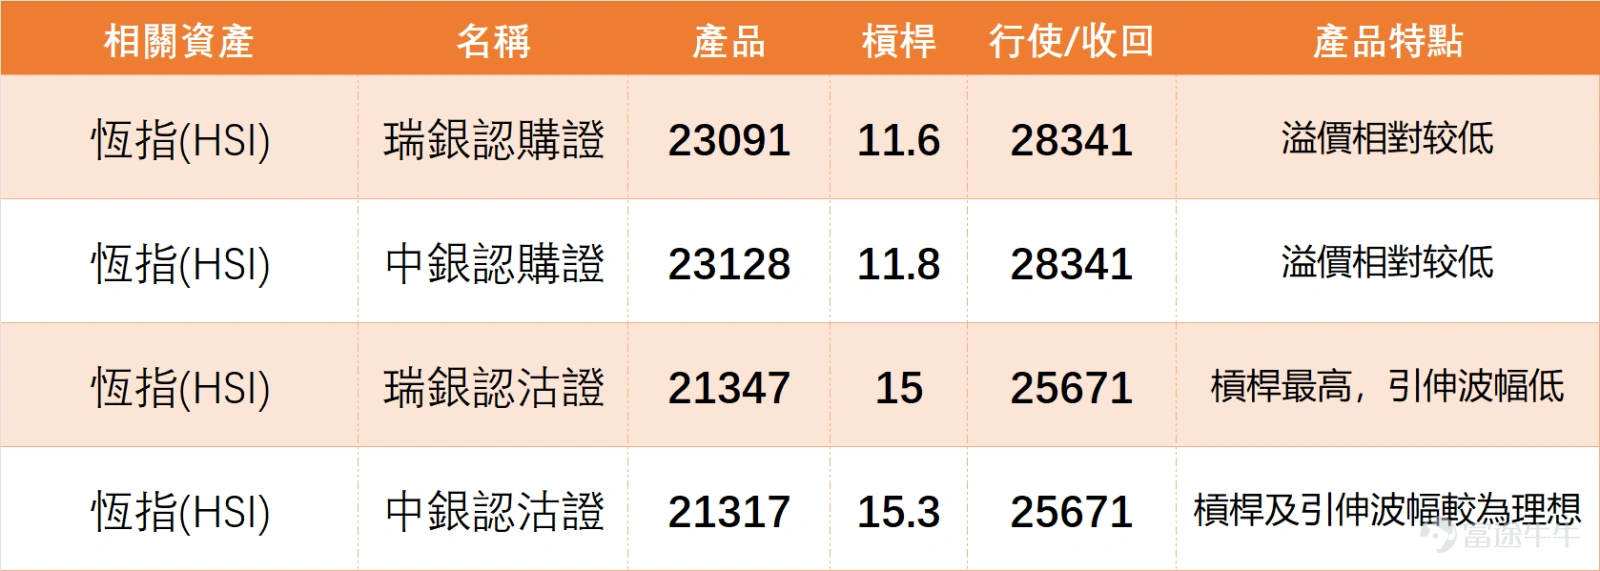
$BI-HSI @EC2605B.C (23128.HK)$ : Single-day increase of 6%, actual leverage 11.8 times, exercise price at 28,341 points, with a high match to Hang Seng Index resistance level 1 (27,273 points);
$UB-HSI @EC2605B.C (23091.HK)$ : Single-day increase of 5%, actual leverage 11.6 times, exercise price also at 28,341 points; both products have low premiums and high cost-performance ratios.
Risk Warning:Warrants and bull/bear contracts are highly leveraged derivatives whose price volatility far exceeds the underlying stocks, and carry risks such as expiration at zero or forced recall. Investors must strictly control their positions and avoid going all-in.
Considering the current 'range-bound fluctuation' technical pattern of the Hang Seng Index, two products matching different trading strategies have been selected from the product pool for investors’ reference:
(1) Target for bullish strategy: $BI-HSI @EC2605B.C (23128.HK)$
Product attributes: Actual leverage 11.8 times, exercise price at 28,341 points, relatively low premium;
Strategy alignment: The current resistance level for the Hang Seng Index is 27,273 points. If the market breaks through this level with higher volume, it may move towards 28,341 points. This product's exercise price has high alignment with the potential target, offering excellent cost-performance.
(2) Target for bearish strategy: $BI#HSI RP28033.P (57148.HK)$
Product attributes: Actual leverage 26.7 times, recall price at 27,888 points, with the lowest premium among similar products;
Strategy alignment: If the Hang Seng Index fails to break through the resistance level at 27,273 points, it will likely retest the support level at 26,259 points. This product offers relatively high actual leverage and exhibits greater profit elasticity when the underlying stock declines.
Do you think the Hang Seng Index will first test the resistance at 27,273 points or retest the support at 26,259 points in the short term? Among blue-chip stocks, are you more optimistic about China Mobile, which is nearing oversold levels, or HSBC Holdings, which is in overbought territory?Feel free to share your unique insights in the comments section. Want to see more analysis? Don't forget to follow 'HK Stock Warrants Jenny' for daily updates!
Disclaimer: This article does not constitute any investment advice.
This article is for reference only and does not constitute any investment advice. The market data, opinions, and analysis contained herein may change at any time without prior notice. We shall not be liable for any loss or damage arising from reliance on the information in this article. Technical analysis merely indicates whether certain technical conditions are met; a comprehensive evaluation of asset performance should incorporate additional data. Trading decisions should not be based solely on the content of this article. Please note that past performance is not indicative of future results.
#Hang Seng Index #Hong Kong Stocks #Real-time Analysis #Warrants Selection #Warrants Strategy #Derivatives Hedging #Hong Kong Stock Warrants Jenny #Tencent Holdings #Financial Technology Sector #Technical Analysis
Risk Disclaimer: The above content only represents the author's view. It does not represent any position or investment advice of Futu. Futu makes no representation or warranty.Read more


Comment (1)
to post a comment
3