Hang Seng Index Afternoon Short-Term Analysis and Warrant Deployment: Long-Short Strategies Around the 27,000-Point Level
The Hang Seng Index is consolidating in a narrow range near the key psychological level of 27,000 points, last trading at 26,969. The intra-day high was temporarily at 27,206 points. Under the current market conditions, technical signals and market sentiment show significant contradictions and博弈, with the index maintaining above major moving averages while facing回调pressure due to short-term overbought conditions.
Technical Analysis: Uptrend Structure Intact, but Short-Term Overbought Signals Emerge
From the perspective of the daily chart structure, the overall technical pattern of the HSI remains positive. Currently, the index is firmly positioned above the 10-day moving average (approximately 26,554 points), the 30-day moving average (approximately 25,990 points), and the 60-day moving average (approximately 26,062 points). According to independent analysis, the 10-day moving average has successfully crossed above the 50-day, 100-day, and 250-day moving averages, forming a standard “bullish alignment,” which is typically regarded as a signal that the technical aspect is entering a mid-term uptrend mode. The rebound structure initiated from the January 2 low of 25,717 points remains robust.
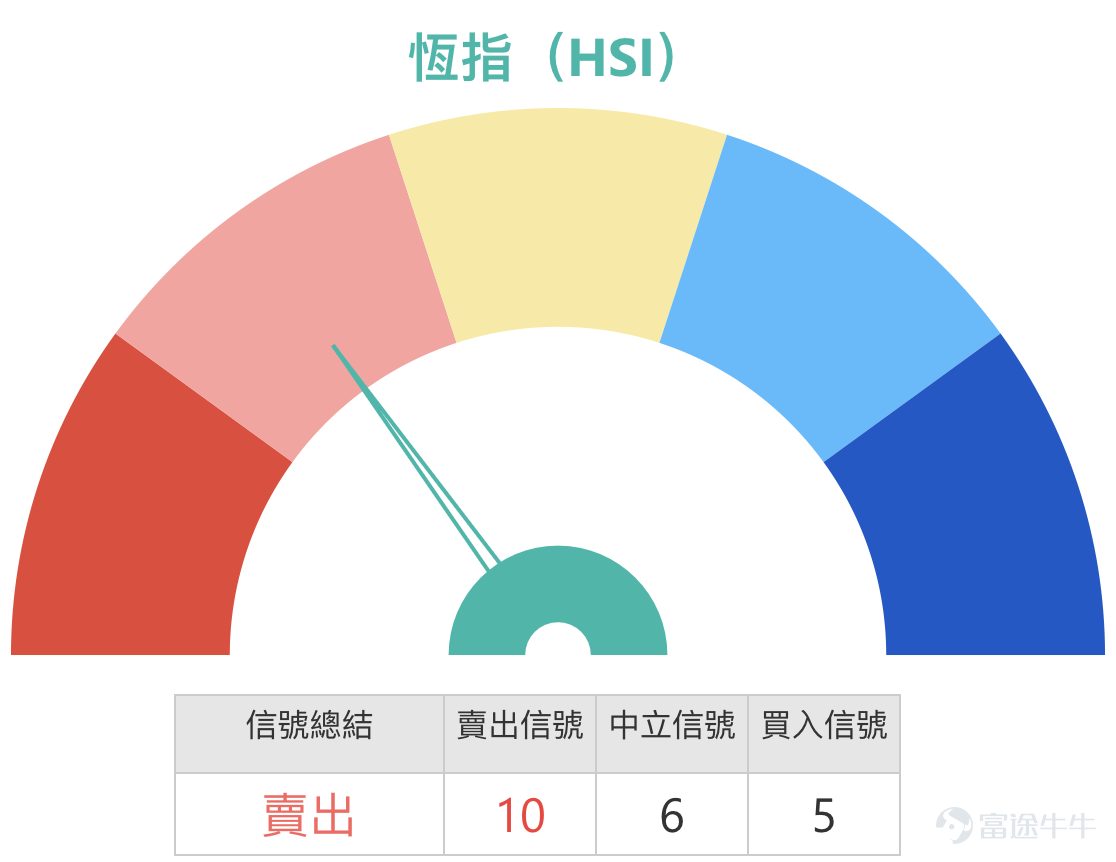
However, short-term oscillation indicators have issued clear warning signals. At present, the technical indicator summary shows 10 “sell” signals, significantly outnumbering buy signals. Specifically, the Relative Strength Index (RSI) is at 66, indicating that the market has entered the “overbought” zone. Meanwhile, prices are approaching the upper band of the Bollinger Bands, further confirming that short-term buying momentum may be overly exhausted. There is an inherent need for the index to consolidate or undergo a technical correction at higher levels before continuing upward. This contradiction between “mid-term positivity and short-term overbought conditions” is precisely the technical root cause of the current heightened divergence between bulls and bears in the market.
Therefore, a clear identification of key levels is crucial. Above, the primary resistance level is at 27,335 points, which is close to the high of 27,188 points in November last year and the market-focused 27,300-point range. If this level is breached, the next key resistance will be seen at 27,872 points, while a more significant technical resistance lies at the October high of 27,381 points. Once 27,381 points are effectively surpassed, it technically indicates that the market may initiate a new round of mid-term upward movement. Below, the first support level is at 26,229 points, near the 10-day moving average, serving as an important defense line for short-term trends. If this level is broken, the correction could deepen towards a stronger support level at 25,760 points.

Market View Consolidation: Cautious Positioning Around 27,000 Points
Recent professional commentary clearly reflects the intense tug-of-war between bulls and bears around the 27,000-point mark. In the January 13 episode of [BOC Guest], Niki, a director at BOC International, pointed out that after the Hang Seng Index surged to 27,143 points, gains narrowed as the index had risen nearly a thousand points within about a week. Some investors chose to take profits on bull contracts or call warrants near the 27,100-point level, and simultaneously bought bearish instruments like bear contracts to lock in gains or prepare for a pullback, leading to an overall flow of funds into bearish positions that day. This explains why cautious sentiment emerged within the market even as the index rose.
By January 14, this tug-of-war became even more nuanced. The Hang Seng Index closed at 26,999.81 points, stopping just shy of the 27,000-point threshold. On [Hong Kong Stocks Podcast], host Simon described the market's divergence: bulls expected the index to continue rising, challenging the 27,200-point level and triggering a 'bear squeeze'; whereas bears believed that since the index failed to hold above 27,000 points, it was time to take profits and exit, or even go short by purchasing bear contracts with a recovery price of 27,200 points overnight. This 'close call' closure left the direction decision hanging for future sessions. Simon emphasized during the show that when deploying bull or bear contracts, investors must understand key support and resistance levels and choose products with sufficient safety margins in their recovery prices to avoid being forcibly recalled due to short-term market fluctuations.
Review of Warrant Products: Leverage Effectiveness and Capital Efficiency Demonstrated
Reviewing the recent performance of warrants, it’s evident that derivatives exhibit significant capital efficiency when market direction is correctly predicted. For instance, on January 12, under the backdrop of a 1.47% rise in the Hang Seng Index over two days, related derivative products achieved substantial amplified returns due to their inherent leverage characteristics. Notably, Societe Generale Bull Certificate (68507) surged by 67%, while BOCOM Bull Certificate (68078)... $BI#HSI RC28083.C (68078.HK)$ rose by 55%, while BOCOM Call Warrant (23128) and UBS Group Call Warrant (23091)... $UB-HSI @EC2605B.C (23091.HK)$ recorded gains of 23% and 20%, respectively.

Advantages of Derivative Products and Current Deployment Strategies
Compared to directly investing in index components or index funds, warrants (call options) and bull/bear contracts offer investors different trading dimensions. Their core advantage lies in providing higher capital efficiency, allowing investors to track index movements with smaller capital, thereby implementing more flexible and precise strategies in range-bound or breakout scenarios. Specifically, bull/bear contracts tend to have a more direct correlation with underlying assets and do not suffer from time decay, making them suitable for short-term trades; whereas warrants offer more diversified strike prices and expiration dates, catering to deployments with specific volatility and time expectations.
Given the Hang Seng Index's current position within critical resistance and support zones, selecting products requires closely aligning their core terms—strike price (for warrants) or recovery price (for bull/bear contracts)—with these key technical levels.
Bullish Strategy Approach: If investors believe that after consolidation, the index will successfully break through the resistance at 27,300 points and move towards the 27,800-point range, they can consider call warrants or bull certificates. For example, BOCOM Call Warrant (23128) and UBS Group Call Warrant (23091), both with exercise prices of 28,341 points, offer approximately 11-12 times leverage. These exercise prices are significantly higher than the current market price and the second resistance level at 27,872 points, making them deep out-of-the-money options characterized by high effective leverage, suitable for aggressive strategies betting on significant index breakthroughs. For investors preferring simpler operations and aiming to avoid time decay, they can focus on bull certificates with stop-loss levels set below key support. For instance, JPMorgan Bull Certificate (69255) and UBS Group Bull Certificate (54214)... $UB#HSI RC2809W.C (54214.HK)$ have stop-loss levels at 26,200 points, providing over 30 times actual leverage. This stop-loss level is below the first support level at 26,229 points and maintains a distance of approximately 440 points from the second support level at 25,760 points, offering a relatively high margin of safety.
Bearish or Hedging Strategy Approach: If the judgment is that the index will be constrained by resistance at 27,300 points and retreat to test support, put warrants or bear certificates can be considered. For instance, BOCOM Put Warrant (21317) and UBS Group Put Warrant (21347)... $UB-HSI @EP2603C.P (21347.HK)$ both have exercise prices of 25,671 points, providing about 15 times leverage. These exercise prices are below the second support level at 25,760 points, so if the index pulls back to this region, these products will demonstrate better leverage effects. For bearish investors, bear certificates are a higher-leverage option. For example, BOCOM Bear Certificate (60080) with a stop-loss level at 27,388 points, close to the first resistance level at 27,335 points; and BOCOM Bear Certificate (54153) with a stop-loss level at 27,338 points, very near the 27,300-point resistance level. Choosing such products implies the investor believes the index cannot effectively break through this resistance zone. However, it’s crucial to note, as reminded in [HK Stock Podcast], if bearish but choosing bear certificates, the stop-loss level should not be too close to the current market price. Considering the risk of the index potentially surging to 27,800 points or even higher, selecting products with stop-loss levels above 27,800 points would be more prudent.


Faced with the Hang Seng Index's hesitation around the 27,000-point mark, how will you decide your strategy? Do you trust the power of the bullish alignment of mid-term moving averages and deploy tools like J.P. Morgan bull contract (69255) when the index pulls back to near the support at 26,229 points? Or do you agree with the validity of short-term overbought signals and use Bank of ** contract (54153) to bet on a pullback as the index approaches the resistance at 27,335 points? When using derivative warrants to capture market opportunities, will you prioritize the capital efficiency brought by high leverage or prefer to leave sufficient 'safety buffer distance' in the product terms?
Follow Jenny’s HK stock warrants updates for more practical warrant knowledge and market analysis.
Disclaimer: This article does not constitute any investment advice.
This article is for reference only and does not constitute any investment advice. The market data, opinions, and analysis contained herein may change at any time without prior notice. We shall not be liable for any loss or damage arising from reliance on the information in this article. Technical analysis merely indicates whether certain technical conditions are met; a comprehensive evaluation of asset performance should incorporate additional data. Trading decisions should not be based solely on the content of this article. Please note that past performance is not indicative of future results.
#HangSengIndex #TechnicalAnalysis #SupportResistanceLevels #Derivatives #BullBearCertificates #HKStocksStrategy #InvestmentTools #CapitalFlow #RiskManagement #ShortTermStrategy
Risk Disclaimer: The above content only represents the author's view. It does not represent any position or investment advice of Futu. Futu makes no representation or warranty.Read more

Comments
to post a comment
3
9