
Hong Kong-listed AI 'twin leaders' see active trading! How to position in the AI sector for the Year
HK Stock Podcast Market Observation: Analyzing Tencent's Support Levels Through Derivatives Positioning
As of January 14, 2026, Tencent (00700) closed at HKD 633, consolidating near recent highs. The market is increasingly divided on its short-term outlook. On one hand, the stock has successfully stabilized above key moving averages, showing resilience; on the other hand, resistance becomes more apparent as it approaches the yearly high. According to the latest data today (January 15), Tencent fell by 1.34%, trading at HKD 624.5.
Technical Analysis: Resistance at Highs, Key Support Levels Under Pressure
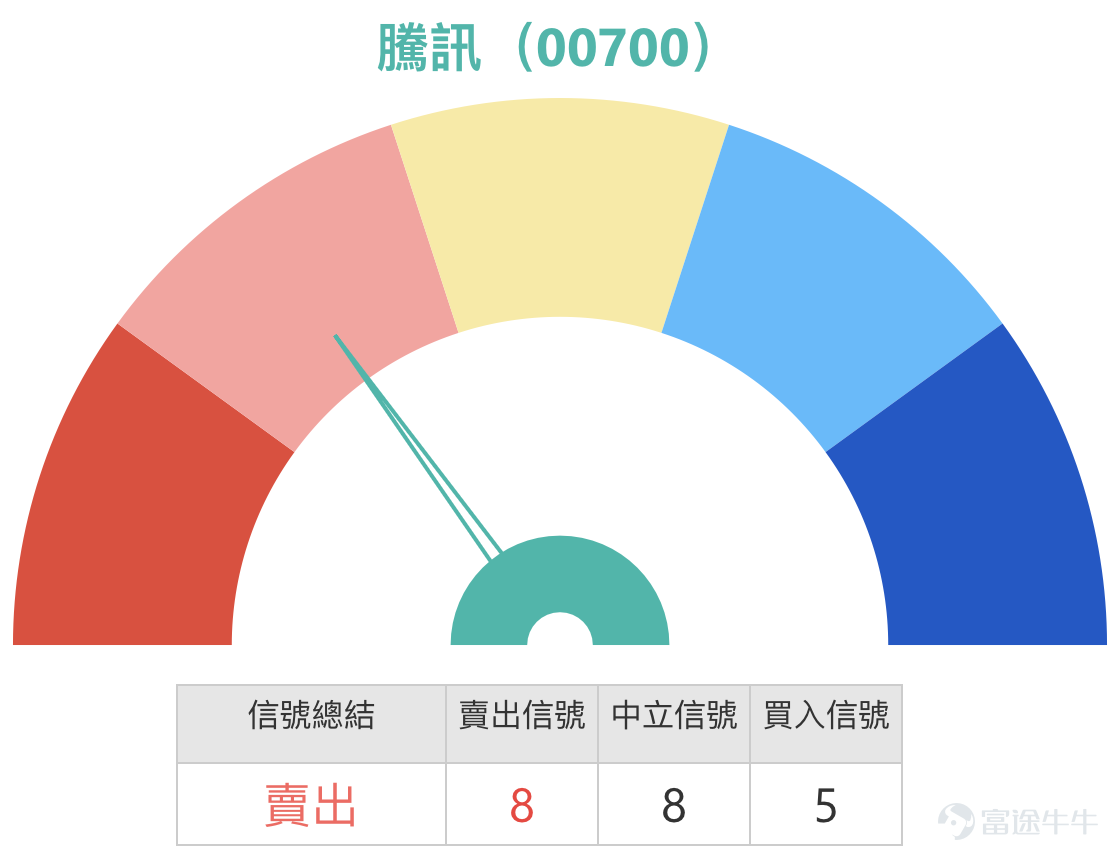
From the daily chart perspective, Tencent’s share price is currently at a critical technical juncture. The closing price of HKD 633 on January 14 is nearing the upper Bollinger Band (approximately HKD 636), indicating overbought pressure in the short term and upward momentum facing challenges. This aligns with the weaker bias shown in technical indicators where 'sell' signals dominate (8 sell vs. 5 buy), confirming Simon’s observation in the recent [HK Stock Podcast] that “Tencent’s trend appears weak.”January 14 [HK Stocks Podcast] Hang Seng Index, Tencent, Xiaomi, Wuxi Bio, Trip.Com, Ali Health
The moving average system provides some support. Currently, the share price remains above the 10-day line (about HKD 621.4) and the 30-day line (about HKD 611.7), suggesting that the framework of the medium-term uptrend remains intact. However, multiple oscillators such as the Williams %R and Stochastic Oscillator indicate an 'overbought condition,' implying that without new positive catalysts, there is a technical need for short-term consolidation or pullback.
Thus, the key price range has become clear. Above, the primary resistance level is at 649 yuan. If it can break through effectively, there is potential to challenge the higher resistance level of 665 yuan within the year. Below, 617 yuan (the bottom of the recent consolidation range and Fibonacci retracement support) forms the first important line of defense. As Simon analyzed in the [HK Stock Podcast], if this position is breached, the adjustment could deepen further to the second support level at 601 yuan. This is also a deeper support area that many technical analysts are watching, consistent with the view mentioned in the podcast: “If Tencent falls further, it might drop to around 618 yuan in the short term, and if it breaks below that, it will likely reach near 601 yuan.”
![$TENCENT (00700.HK)$ As of January 14, 2026, Tencent (00700) closed at HKD 633, consolidating near recent highs. The market is increasingly divided on its short-term outlook. On one hand, the stock has successfully stabilized above key moving averages, showing resilience; on the other hand, resistance becomes more apparent as it approaches the yearly high. According to the latest data today (January 15), Tencent fell by 1.34%, trading at HKD 624.5. Technical Analysis: Resistance at Highs, Key Support Levels Under Pressure From the daily chart perspective, Tencent’s share price is currently at a critical technical juncture. The closing price of HKD 633 on January 14 is nearing the upper Bollinger Band (approximately HKD 636), indicating overbought pressure in the short term and upward momentum facing challenges. This aligns with the weaker bias shown in technical indicators where 'sell' signals dominate (8 sell vs. 5 buy), confirming Simon’s observation in the recent [HK Stock Podcast] that “Tencent’s trend appears weak.”[Share Link: January 14 [HK Stocks Podcast] Hang Seng Index, Tencent, Xiaomi, Wuxi Bio, Trip.Com, Ali Health ] The moving average system provides some support. Currently, the share price remains above the 10-day line (about HKD 621.4) and the 30-day line (about HKD 611.7), suggesting that the framework of the medium-term uptrend remains intact. However, multiple oscillators...](https://nnqimage.futunn.com/sns_client_feed/1162342/20260115/web-1768447593630-GFYb8mWc2R.png/big?area=1&is_public=true&imageMogr2/ignore-error/1/format/webp)
Market View Integration: Long-term Optimism from Major Banks vs. Short-term Caution from Investors
The current market view presents a situation where 'long-term fundamental optimism' coexists with 'short-term technical caution.' Several major banks have recently raised their target prices for Tencent, providing long-term valuation anchors for the stock. For example, Goldman Sachs believes that Tencent's valuation still trades at a discount compared to global peers and has raised its target price to 770 yuan. Meanwhile, Bank of America Securities emphasizes Tencent’s momentum in AI monetization and has increased its target price to 780 yuan. These views are mainly based on confidence in the company's AI-empowered businesses, robust shareholder return policies, and future profit growth potential.
However, on the short-term trading front, investor sentiment tends to be more cautious. The market dynamics disclosed in the [HK Stock Podcast] are very representative: some investors asked about entry points during weaker trends and specifically mentioned that some investors hold bull certificates with a recovery price near 587 yuan. This reflects that some funds are attempting to deploy rebounds at levels far below the current market price, considered safer positions, to prepare for possible adjustments. In the program, Simon explicitly advised: “Investors holding Tencent’s bull certificates should take note—bull certificates below 600 yuan are relatively safe at this juncture. Products priced at 609 yuan or 603 yuan are available in the market, but from a technical analysis perspective, products at 600 yuan or below are safer.” This provides us with direct market references and insights into risk preferences for subsequent derivative analysis.
Review of Warrant Products and Insights: The Leverage Effect in Volatility
A review of recent warrant market performance clearly shows the amplification effect of derivatives during underlying stock volatility. Taking several products mentioned on January 12, 2026, as examples, against the backdrop of the underlying stock rising approximately 1.61% over the next two days, related derivatives recorded more significant gains due to leverage. Among them, UBS Group Bull Certificate (63637) $UB#TENCTRC2606F.C (63637.HK)$ rose by 27%, HSBC Call Warrant (23657) rose by 16%, and BOC Bull Certificate (65930) $BI#TENCTRC2612A.C (65930.HK)$ also rose by 19%. This performance vividly illustrates that under correct market direction judgment, using warrants and bull/bear certificates can enhance capital efficiency. Investors should note that this also means losses will be amplified if the market moves contrary to expectations.
![$TENCENT (00700.HK)$ As of January 14, 2026, Tencent (00700) closed at HKD 633, consolidating near recent highs. The market is increasingly divided on its short-term outlook. On one hand, the stock has successfully stabilized above key moving averages, showing resilience; on the other hand, resistance becomes more apparent as it approaches the yearly high. According to the latest data today (January 15), Tencent fell by 1.34%, trading at HKD 624.5. Technical Analysis: Resistance at Highs, Key Support Levels Under Pressure From the daily chart perspective, Tencent’s share price is currently at a critical technical juncture. The closing price of HKD 633 on January 14 is nearing the upper Bollinger Band (approximately HKD 636), indicating overbought pressure in the short term and upward momentum facing challenges. This aligns with the weaker bias shown in technical indicators where 'sell' signals dominate (8 sell vs. 5 buy), confirming Simon’s observation in the recent [HK Stock Podcast] that “Tencent’s trend appears weak.”[Share Link: January 14 [HK Stocks Podcast] Hang Seng Index, Tencent, Xiaomi, Wuxi Bio, Trip.Com, Ali Health ] The moving average system provides some support. Currently, the share price remains above the 10-day line (about HKD 621.4) and the 30-day line (about HKD 611.7), suggesting that the framework of the medium-term uptrend remains intact. However, multiple oscillators...](https://nnqimage.futunn.com/sns_client_feed/1162342/20260115/web-1768447627114-DHrWs0f3Mz.png/big?area=1&is_public=true&imageMogr2/ignore-error/1/format/webp)
Analysis of Derivative Product Advantages and Current Deployment Strategies
Given Tencent's current stock price is at a key technical position, deploying derivatives requires closely integrating product terms with the underlying stock’s support/resistance levels while referencing discussions on safety margins in the [HK Stock Podcast].
Bullish strategy: If investors believe that the stock price can stabilize and rebound at a key support level, they may consider out-of-the-money call warrants with moderate leverage. For instance, JPMorgan's call warrant (22767) has a strike price of 758.88 HKD and provides approximately 9.8x leverage. This strike price is significantly higher than the current stock price, making it deep out-of-the-money, which typically offers higher leverage compared to similar products, ideal for investors betting on a substantial rebound. Another option is BNP Paribas call warrant (23260), with a strike price of 759 HKD and about 10.2x leverage, offering relatively stable implied volatility, balancing leverage and volatility cost. Investors who wish to avoid time decay and prefer simpler operations can consider bull contracts with stop-loss levels set below key support. For example, Bank of China’s bull contract (65930) has a stop-loss level at 590 HKD and provides around 11.8x leverage. Its stop-loss level is not only below the technical analysis key support of 601 HKD but also aligns with the principle discussed in the podcast that “products at or below 600 HKD are safer,” providing a safety buffer. Another UBS bull contract (68232) with a stop-loss level at 584 HKD offers the lowest premium and higher actual leverage, suitable for those seeking greater capital efficiency.
![$TENCENT (00700.HK)$ As of January 14, 2026, Tencent (00700) closed at HKD 633, consolidating near recent highs. The market is increasingly divided on its short-term outlook. On one hand, the stock has successfully stabilized above key moving averages, showing resilience; on the other hand, resistance becomes more apparent as it approaches the yearly high. According to the latest data today (January 15), Tencent fell by 1.34%, trading at HKD 624.5. Technical Analysis: Resistance at Highs, Key Support Levels Under Pressure From the daily chart perspective, Tencent’s share price is currently at a critical technical juncture. The closing price of HKD 633 on January 14 is nearing the upper Bollinger Band (approximately HKD 636), indicating overbought pressure in the short term and upward momentum facing challenges. This aligns with the weaker bias shown in technical indicators where 'sell' signals dominate (8 sell vs. 5 buy), confirming Simon’s observation in the recent [HK Stock Podcast] that “Tencent’s trend appears weak.”[Share Link: January 14 [HK Stocks Podcast] Hang Seng Index, Tencent, Xiaomi, Wuxi Bio, Trip.Com, Ali Health ] The moving average system provides some support. Currently, the share price remains above the 10-day line (about HKD 621.4) and the 30-day line (about HKD 611.7), suggesting that the framework of the medium-term uptrend remains intact. However, multiple oscillators...](https://nnqimage.futunn.com/sns_client_feed/1162342/20260115/web-1768447670229-3gHi8o4VGX.jpeg/big?area=1&is_public=true&imageMogr2/ignore-error/1/format/webp)
Bearish or hedging strategy: If you expect the stock price to retreat after encountering resistance, consider put warrants or bear contracts. UBS put warrant (21340) has a strike price of 544.88 HKD and offers approximately 13x leverage with relatively low premium, reducing costs if the market moves against your position. Bank of China put warrant (24406) $BITENCT@EP2606B.P (24406.HK)$ has a strike price of 556.38 HKD, with both the lowest premium and implied volatility among similar products, making it an attractive choice for investors focused on minimizing costs. Among bearish instruments, bear contracts are often used by short-term traders due to their high leverage characteristics. Morgan Stanley bear contract (55281) $MS#TENCTRP2808D.P (55281.HK)$ has a stop-loss level at 658 HKD, offering approximately 24.3x actual leverage, the highest on the list. Its stop-loss level closely tracks the second resistance level of the underlying stock at 665 HKD, making it ideal for capturing short-term opportunities when the stock encounters resistance near this level.
![$TENCENT (00700.HK)$ As of January 14, 2026, Tencent (00700) closed at HKD 633, consolidating near recent highs. The market is increasingly divided on its short-term outlook. On one hand, the stock has successfully stabilized above key moving averages, showing resilience; on the other hand, resistance becomes more apparent as it approaches the yearly high. According to the latest data today (January 15), Tencent fell by 1.34%, trading at HKD 624.5. Technical Analysis: Resistance at Highs, Key Support Levels Under Pressure From the daily chart perspective, Tencent’s share price is currently at a critical technical juncture. The closing price of HKD 633 on January 14 is nearing the upper Bollinger Band (approximately HKD 636), indicating overbought pressure in the short term and upward momentum facing challenges. This aligns with the weaker bias shown in technical indicators where 'sell' signals dominate (8 sell vs. 5 buy), confirming Simon’s observation in the recent [HK Stock Podcast] that “Tencent’s trend appears weak.”[Share Link: January 14 [HK Stocks Podcast] Hang Seng Index, Tencent, Xiaomi, Wuxi Bio, Trip.Com, Ali Health ] The moving average system provides some support. Currently, the share price remains above the 10-day line (about HKD 621.4) and the 30-day line (about HKD 611.7), suggesting that the framework of the medium-term uptrend remains intact. However, multiple oscillators...](https://nnqimage.futunn.com/sns_client_feed/1162342/20260115/web-1768447679825-cEC2dgL8D8.jpeg/big?area=1&is_public=true&imageMogr2/ignore-error/1/format/webp)
#Learn CWarrants and Bull/Bear Contracts with Jenny# Key Insights: What are the conditions for issuing CWarrants on individual stocks? $Hang Seng Index (800000.HK)$$Hang Seng TECH Index (800700.HK)$$Hang Seng China Enterprises Index (800100.HK)$
Many investors might wonder why companies like Tencent have such a wide range of CWarrant products available for trading. This relates to the role of issuers. CWarrants are derivative warrants independently issued by financial institutions such as investment banks, whose value is linked to the performance of the underlying asset (e.g., Tencent stock), though they are not issued by Tencent itself.
In the Hong Kong market, whether an individual stock will have numerous CWarrant products mainly depends on whether it meets the requirements of both issuers and regulators: First, the underlying stock must be a highly liquid blue-chip or large index component stock to ensure sufficient market depth for hedging and pricing. As a core component of the Hang Seng Index, Tencent has a massive daily average trading volume, fully meeting this criterion. Second, the stock needs adequate market attention and volatility to attract investors to trade its derivatives, allowing issuers to gain liquidity returns through bid-ask spreads. Third, issuers decide which strike prices and expiration dates to offer based on market demand and their own risk management capabilities. For example, the JPMorgan call warrant (22767) and UBS put warrant (21340) mentioned in this article were issued by JPMorgan and UBS respectively. Based on their expectations of Tencent’s movement and investor demand, they designed various terms of products for the market to choose from.
Interactive Questions and Summary
In the current market environment, which strategy would you prefer? Would you follow the insights from [HK Stock Podcast] and deploy technical rebounds near the key support level of 601 HKD using products like Bank of China bull contract (65930) with a stop-loss level at 590 HKD? Or would you wait for the stock price to confirm a breakout above the 649 HKD resistance before following the trend? Alternatively, do you think the correction is not over yet and are considering deploying bearish instruments like Morgan Stanley bear contract (55281)?
Regardless of the chosen instrument, always remember: Derivative products are not meant for long-term holding. Their high leverage amplifies potential gains, but equally magnifies risks. Before trading, carefully read the listing documents, fully understand all terms including expiration date, strike/stop-loss levels, and leverage ratios, and make prudent decisions based on your own risk tolerance.
#Tencent #TechnicalAnalysis #SupportResistanceLevels #Derivatives #BullBearCertificates #ShortTermDeployment #HKStocks #MarketStrategy #RiskManagement
Disclaimer: This article does not constitute any investment advice.
This article is for reference only and does not constitute any investment advice. The market data, opinions, and analysis contained herein may change at any time without prior notice. We shall not be liable for any loss or damage arising from reliance on the information in this article. Technical analysis merely indicates whether certain technical conditions are met; a comprehensive evaluation of asset performance should incorporate additional data. Trading decisions should not be based solely on the content of this article. Please note that past performance is not indicative of future results.
Risk Disclaimer: The above content only represents the author's view. It does not represent any position or investment advice of Futu. Futu makes no representation or warranty.Read more

Comments
to post a comment
1
1