
Hong Kong-listed AI 'twin leaders' see active trading! How to position in the AI sector for the Year
Technical Analysis of Chinese Concept Stocks (January 15): Alibaba/Baidu/Bilibili/Futu/PDD Holdings/Tencent Music/NetEase/JD.com/Tencent/Meituan/Kuaishou/Xiaomi
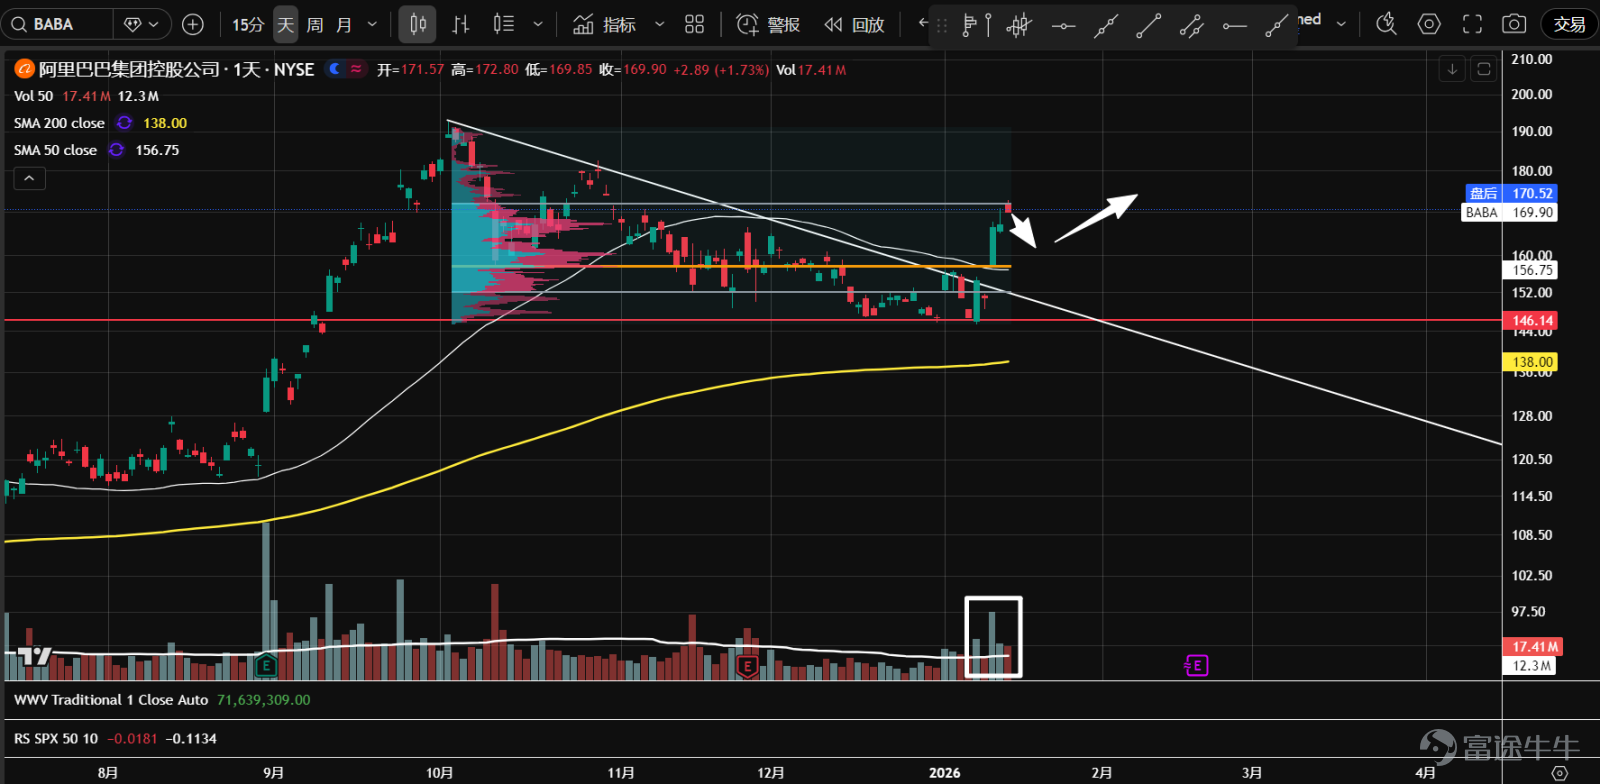
1、 $Alibaba (BABA.US)$After being supported by the narrow range consolidation around 146 for several weeks, it broke through the angle position with high volume, entering a bullish price-volume cycle. Currently resisted at the upper boundary of the value zone, watch for buying opportunities during a pullback with shrinking volume.

2、 $Baidu (BIDU.US)$After three months of sideways consolidation, it broke out this month with an ascending triangle on high volume, currently temporarily resisted near the previous high of 150.5. Within a bullish price-volume cycle, wait for opportunities to buy on dips.

3、 $Bilibili (BILI.US)$ After retesting and stabilizing around 24.35 in December last year, it rebounded with heavy volume, quickly breaking through the resistance near the previous high of 32. The rapid rise on continued high volume indicates no clear entry point at the moment; watch for any pullback on reduced volume.

4、 $Futu Holdings Ltd (FUTU.US)$ Continued sideways consolidation has formed a P-shaped volume distribution, with increased divergence between buyers and sellers at higher levels. Currently, the stock price is near the Volume Control Point (orange line), showing no clear direction. Overall trading volume is gradually declining, entering a bullish price-volume cycle, suggesting a possible accumulation phase.

5、 $PDD Holdings (PDD.US)$ Since 2024, it has been trading within a large consolidation range. The recent attempt to break through the 123-axis level failed, leading to a sharp decline on heavy volume, indicating expanded supply and significantly underperforming the China Concepts Stock Index. The technical outlook is extremely weak; observation is recommended.

6、 $Tencent Music (TME.US)$ The persistent weak trend found temporary support at the 38.2% retracement level of the previous rally, but trading volume did not expand significantly, indicating insufficient demand. Until a breakout above the new downtrend line occurs, bottom-fishing is not advised.

7、 $NetEase (NTES.US)$ Continued range-bound consolidation saw the recent rebound halted at the upper boundary of the value zone, retreating to the Volume Control Point (orange line). The direction remains unclear. With overall volume low and the bottom gradually rising, it suggests the possibility of an accumulation phase.

8、 $JD.com (JD.US)$ After breaking below the key support around 30 on heavy volume in November, instead of plunging further, the stock has been consolidating in a narrow range. A minor rebound recently faced resistance at the lower boundary of the previous value area on increased volume, leaving the direction uncertain. Monitor the price-volume behavior around 30.

9、 $TENCENT (00700.HK)$ Since December, the stock stabilized around the 600 support level on reduced volume. A wave of heavy-volume rebound followed in January, showing signs of strength, then entered a bullish price-volume cycle. Recently, upward movement was resisted at the upper boundary of the value zone, but candlesticks closed near highs, suggesting bulls may be absorbing floating shares.

10、 $MEITUAN-W (03690.HK)$ Since September last year, the stock entered a sideways consolidation and formed a b-shaped volume distribution, reflecting increased buyer-seller divergence at lower levels. It is currently oscillating with heavy volume near the Volume Control Point (orange line), with an unclear direction; observation is recommended.

11、 $KUAISHOU-W (01024.HK)$ After a volume-decline retest of support around 62.6, the stock entered a stage of heavy-volume upward movement, forming a bullish price-volume cycle. Currently, it faces resistance near 82 with signs of supply emerging, which could lead to a short-term pullback; look for opportunities to buy on dips.

12、 $XIAOMI-W (01810.HK)$ Since the downward trend began in September last year, panic selling occurred around the axis level of 36.9. After a natural rebound, it is now undergoing a second test, with trading volumes significantly shrinking compared to the sharp drop in November, possibly indicating stabilization ahead.

$S&P 500 Index (.SPX.US)$ $SPDR S&P 500 ETF (SPY.US)$ $NASDAQ 100 Index (.NDX.US)$ $Invesco QQQ Trust (QQQ.US)$ $Dow Jones Industrial Average (.DJI.US)$ $State Street® SPDR® Dow Jones Industrial Average® ETF Trust (DIA.US)$ $Russell 2000 Index (.RUT.US)$ $iShares Russell 2000 ETF (IWM.US)$ $Hang Seng Index (800000.HK)$ $Hang Seng TECH Index (800700.HK)$ $Hang Seng TECH Index ETF (03032.HK)$ $KraneShares CSI China Internet ETF (KWEB.US)$ $Direxion Daily FTSE China Bull 3X Shares ETF (YINN.US)$ $Direxion Daily FTSE China Bear 3X Shares ETF (YANG.US)$ $Invesco China Technology ETF (CQQQ.US)$
Risk Disclaimer: The above content only represents the author's view. It does not represent any position or investment advice of Futu. Futu makes no representation or warranty.Read more


Comments (2)
to post a comment
13
2