
Hong Kong-listed AI 'twin leaders' see active trading! How to position in the AI sector for the Year
January 14, 2026 HK stocks

📈 Trend Analysis
1. Current Position:
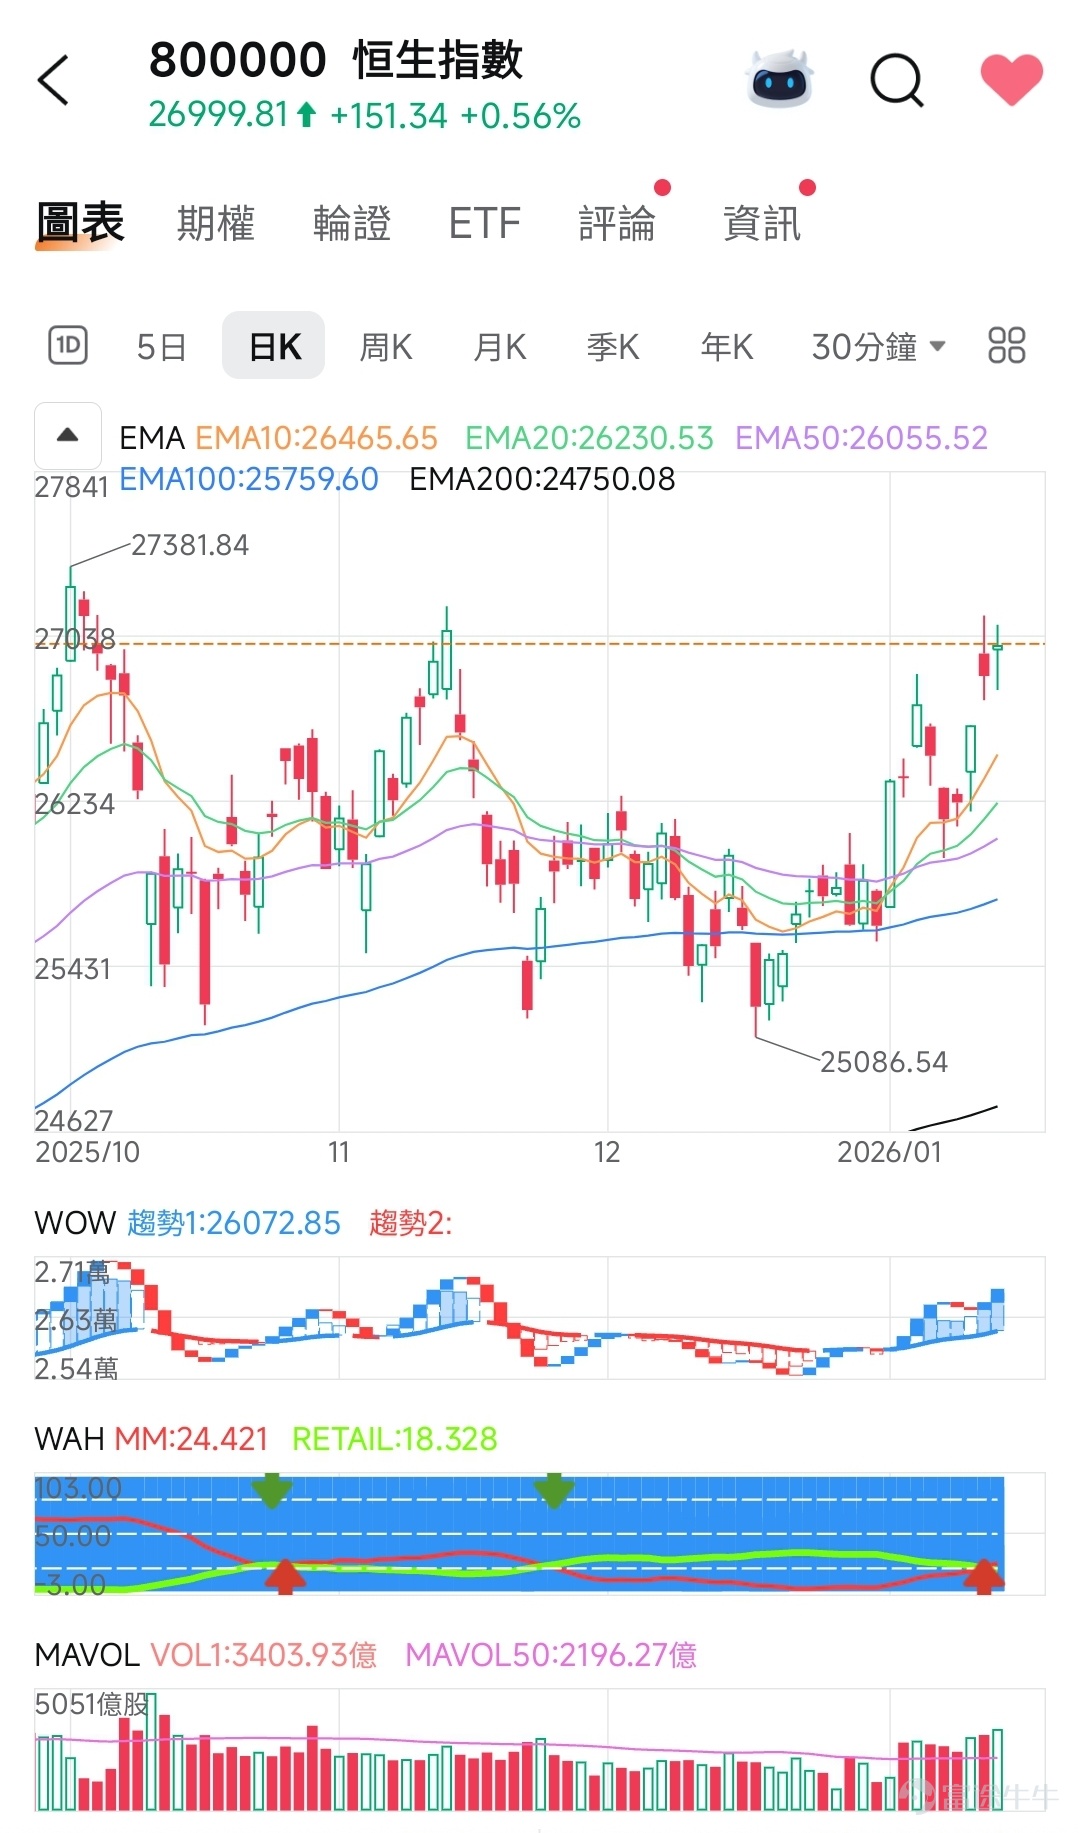
The Hang Seng Index is currently at 26,999.81, above the short-term moving averages (EMA10, EMA20, EMA50), and these moving averages show a bullish alignment (EMA10 > EMA20 > EMA50), indicating a strong short-term trend.
2. Support and Resistance:
· Support: EMA50 (approximately 26,055) and the recent low of 26,234 in the chart form the first support zone.
$CSOP HANG SENG INDEX DAILY (2X)LEVERAGED PRODUCT (07200.HK)$$CSOP Hang Seng TECH Index Daily (2x) Leveraged Product (07226.HK)$$CSOP HSCEI Covered Call Active ETF (02802.HK)$
· Resistance: Key levels to watch are 27,381 (high point in the chart) and 27,841 (recent high area).
$CSOP HANG SENG INDEX DAILY (-2X) INVERSE PRODUCT (07500.HK)$$CSOP Hang Seng TECH Index Daily (-2x) Inverse Product (07552.HK)$
3. Trading Volume:
The Moving Average Volume (MAVOL) shows 340.393 billion, higher than the 50-day average volume of 219.627 billion, indicating that the current upward movement is supported by strong momentum.
---
🔍 WOW and WAH Analysis
· WOW (Trend Momentum Indicator):
Trend 1 stands at 26,072.85, below the current index, showing that the index has broken through this trend line, with a short-term upward trend. Trend 2 does not display a value, possibly because a clear second trend line has not yet formed.
· WAH (Market Sentiment/Capital Flow Indicator):
· MM (Major Investors): 24.421
· RETAIL (Retail Investors): 18.328
Both values are positive, indicating net inflows from both major and retail investors, with the major investor figure being higher, suggesting stronger participation by major investors and a more optimistic outlook for the future.
---
📊 Future Direction Forecast
· Short-term (Daily K-Line):
If the index can stabilize above 27,000 and break through 27,381, it may have the opportunity to challenge 27,841 or even higher levels.
If it breaks below EMA20 (26,230), it may pull back to around 26,055 (EMA50) to find support.
· Medium-term (Weekly K/Monthly K):
The Monthly K and Quarterly K moving averages remain in a bullish alignment (with EMA100 and EMA200 trending upward). The medium- to long-term trend is still biased towards bullishness, but be mindful of potential profit-taking pressure at higher levels.
· Key Observation Points:
1. Trading Volume: Whether it remains consistently above the average volume to sustain upward momentum.
2. WOW Trend 2: If a second trend line appears subsequently, it can provide further insight into the strength of the trend.
3. WAH Capital Flow: If major investor values remain consistently higher than retail investors, the upward structure will be more stable.
---
✅ Conclusion
The Hang Seng Index is currently in a short-term bullish pattern with momentum to challenge higher resistance levels. It is recommended to monitor whether 27,381 is broken and consider 26,230–26,055 as an important support zone. If capital flows (WAH) and trading volumes continue to cooperate, there is still room for upward movement in the future.
Risk Disclaimer: The above content only represents the author's view. It does not represent any position or investment advice of Futu. Futu makes no representation or warranty.Read more

Comments
to post a comment
6