
Hong Kong-listed AI 'twin leaders' see active trading! How to position in the AI sector for the Year
Short-term Analysis of Alibaba: Surge in Capital Boosts Stock Price, Technical Indicators and Key Levels Guide Future Direction
$BABA-W (09988.HK)$ Short-term Analysis of Alibaba: Surge in Capital Boosts Stock Price, Technical Indicators and Key Levels Guide Future Direction
Alibaba (09988) stock showed strong performance, rising 5.4% to HKD 168.6, with a total daily turnover of up to HKD 36.5 billion, becoming the core driving force for the Hang Seng Index to surpass the 27,000-point mark. The signal of strong capital inflow was very clear, as Alibaba recorded nearly HKD 6.4 billion in net active buying in just the morning session. The buy-to-sell ratio among major investors was as high as 77 to 23, indicating a significant concentration of fund inflows. Several large trades were also executed during the day, concentrated around the HKD 168 price level, involving more than HKD 223 million, further confirming the active participation of institutional investors.
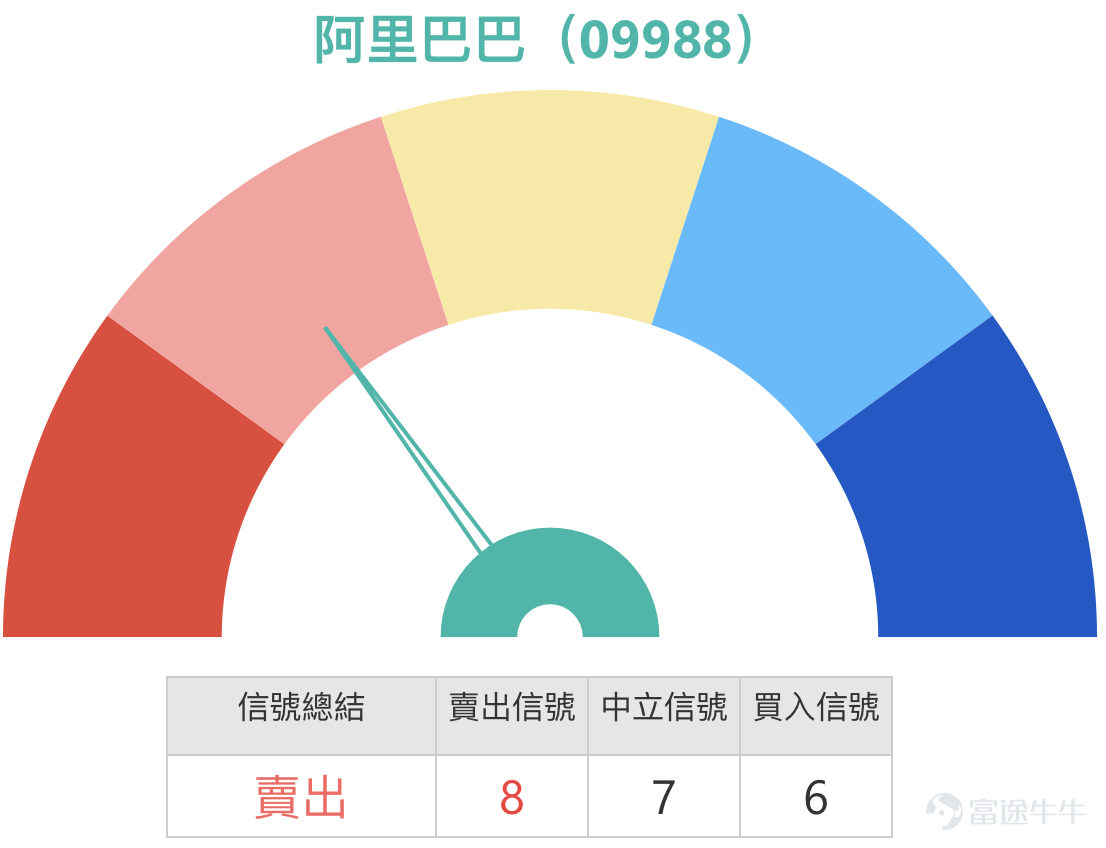
From a technical chart perspective, Alibaba's short-term trend structure has been significantly strengthened. The stock price has successfully stabilized above all key moving averages, with the 10-day, 30-day, and 60-day lines at HKD 151.29, HKD 150.19, and HKD 155.07 respectively, forming a standard bullish alignment pattern. Notably, during the recent rally, the stock exhibited a 'Golden Cross,' an important mid-term bullish technical formation where the short-term moving average crosses above the long-term moving average, typically interpreted as a confirmation signal of an upward trend. However, after the rapid rise, some short-term oscillation indicators have signaled that the market is overheating. The current Relative Strength Index (RSI) is 67, which has not entered the extreme overbought zone, but the Williams %R and Stochastic Oscillator already indicate 'overbought' or 'sell' signals, corresponding with the technical summary's 'sell' signal (strength 8). This suggests that the stock may face short-term profit-taking pressures when challenging key resistance levels.
Support and Resistance Level Analysis: Focus on the Critical Breakthrough at HKD 175.6
According to technical analysis data, combined with the current direction of market capital flow, the key trading range for Alibaba’s stock in the short term has become quite clear, providing explicit coordinates for the deployment of derivative instruments.
On the upside, the primary resistance target is at 175.6 yuan. If it can effectively break through and stabilize above this level, the next target will be 185.2 yuan, aligning with market analysts' views of challenging last year's high of 186.2 yuan. On the downside, the first key support is located at 155.7 yuan, near the 10-day moving average. A more critical medium-term support lies at 151.4 yuan, which not only coincides with the 30-day line but is also considered by technical analysts as an ideal reference point for increasing positions. This support zone is crucial for bull and bear certificate investors, serving as a core basis to assess the safety margin of product recovery prices.

Market View Integration: Earnings Expectations Meet AI Aspirations
The market's interpretation of Alibaba's recent surge centers around its immediate business progress and long-term strategic value. On one hand, there is focus on the resilience of its core e-commerce business. Reports highlight that its 'Taobao Flash Purchase' segment showed strong growth last quarter, and the company has set a clear goal of increasing investment by 2026 to capture market share. On the other hand, as a tech leader, Alibaba’s investments in artificial intelligence (AI), chips, and cloud services continue to draw market attention, with its diversified business concepts offering rich potential for stock price appreciation. Analysts note that current market optimism toward AI-related ventures partly offsets concerns over short-term earnings volatility. This blend of fundamental strength and growth narrative makes Alibaba one of the stocks viewed as having significant short-term speculative value among professional analyses.
Review of Derivative Instruments: Leverage Effect Highlighted Amid Significant Volatility
When the underlying stock experiences significant price movement driven by large-scale capital inflows, the capital efficiency advantage of derivative instruments becomes highly apparent. Looking back at several products mentioned on January 12, 2026, in the following two trading sessions, Alibaba’s stock rose cumulatively by 9.07%, while the price increases of related derivatives were magnified several times over.
Specifically, call warrants performed exceptionally well: UBS Group call warrant (15566) $UBALIBA@EC2603A.C (15566.HK)$ and Bank of China Call Warrant (20577) $BIALIBA@EC2604B.C (20577.HK)$ Prices surged by 84% and 79%, respectively. Bull certificates also saw strong gains: Societe Generale bull certificate (56523) and HSBC bull certificate (56592) recorded rises of 71% and 63%, respectively. This clearly demonstrates that when the underlying stock shows a definitive one-sided trend, both warrants and bull/bear certificates may amplify stock fluctuations by several times, providing investors with an efficient way to participate in market opportunities.

Deployment Strategy for Derivatives Under Current Market Conditions: Focused on Key Price Levels
Given the stock price is poised before a key resistance level and there is short-term divergence in the market, investors can deploy products closely linked to key support/resistance levels based on their expectations. The core advantage of derivatives lies in their leverage effect, allowing investors to establish positions aligned with the direction of the underlying stock's movement using smaller initial capital, thus responding more flexibly to market changes and managing capital efficiency.
If optimistic about capital trends and breakout momentum, consider call warrants with strike prices close to resistance levels or bull certificates with recovery prices below strong support.
For investors who believe that market momentum will push the stock price above the resistance level at 175.6 yuan, they can pay attention to products with strike prices set near this area. For example, HSBC call warrants (14334) $HSALIBA@EC2604A.C (14334.HK)$ and UBS Group call warrants (15566) $UBALIBA@EC2603A.C (15566.HK)$ have strike prices set at 170 yuan and 170.1 yuan respectively, offering approximately 6.9x and 7x actual leverage. These are slightly out-of-the-money warrants, suitable for speculating on a breakout above the first resistance level. Meanwhile, HSBC bull contracts (69921) $HS#ALIBARC2607W.C (69921.HK)$ and UBS Group bull contracts (69758) $UB#ALIBARC2608N.C (69758.HK)$ have stop-loss levels set at 146 yuan, providing about 6.7x and 6.5x actual leverage. This stop-loss level is far below the second support level of 151.4 yuan, offering over a 10% safety buffer to guard against the risk of forced liquidation during normal technical pullbacks, making them suitable for investors optimistic about medium- to long-term trends.

If you expect the stock price to face resistance and pull back, you can focus on high-leverage put warrants or bear contracts.
For investors who believe that the current price is near strong resistance and may consolidate in the short term, bearish instruments can be used to hedge risks or capture correction opportunities. HSBC put warrants (21080) and UBS Group put warrants (21355) $UBALIBA@EP2603J.P (21355.HK)$ have strike prices around 149.8 yuan, offering approximately 7.6x and 7.9x actual leverage. Meanwhile, HSBC bear contracts (60155) $HS#ALIBARP2712F.P (60155.HK)$ and J.P. Morgan bear contracts (63556) $JP#ALIBARP2809F.P (63556.HK)$ have stop-loss levels set at 177.5 yuan and 178 yuan respectively, offering more than 16x actual leverage. The stop-loss levels of these two bear contracts are slightly above the current first resistance level of 175.6 yuan, leaving minimal buffer space. Therefore, they are only suitable for very short-term scenarios where investors firmly believe the stock price will reverse immediately below the resistance level. Investors should be highly alert to the risk of forced liquidation.

In summary, driven by the influx of substantial capital and positive market sentiment, Alibaba's stock price has approached a key resistance level. Do you think its share price will break through the resistance at 175.6 yuan with the current strong momentum and move towards higher targets? Or will it consolidate near this crucial technical level, first retracing to test the support zones at 155.7 yuan or even 151.4 yuan? In terms of strategy, at this pivotal decision point, would you prefer to use high-leverage bear warrants to bet on a short-term pullback, or opt for bull warrants with a higher margin of safety to follow the potential medium-term trend?
For analysis of Hong Kong stock warrants and bull/bear contracts, I’m Jenny. See you again next time.
#Alibaba #TechnicalAnalysis #SupportResistanceLevels #CapitalFlow #Warrants #BullBearCertificates #HongKongStockDeployment #AI #GoldenCross #RiskManagement
This article does not constitute any investment advice
This article is for reference only and does not constitute any investment advice. The market data, opinions, and analyses contained herein may change at any time without prior notice. We assume no responsibility for any loss or damage resulting from reliance on the information provided in this article. Technical analysis only indicates whether certain technical conditions are met. A comprehensive evaluation of asset performance should be conducted by integrating additional data. Trading decisions should not be made solely based on this article. Please note that past performance is not indicative of future results. $Hang Seng TECH Index (800700.HK)$$Hang Seng China Enterprises Index (800100.HK)$$Hang Seng Index (800000.HK)$
Risk Disclaimer: The above content only represents the author's view. It does not represent any position or investment advice of Futu. Futu makes no representation or warranty.Read more

Comments
to post a comment
3
7