
Hong Kong-listed AI 'twin leaders' see active trading! How to position in the AI sector for the Year
Baidu Group Short-Term Analysis: AI Value Reassessed, Can Stock Price Break Through Technical Resistance?
$BIDU-SW (09888.HK)$ As of January 13, 2026, after experiencing an earlier price increase, Baidu Group's (09888) stock price is currently at HKD 142.8, reflecting a 1.38% adjustment. Despite this, the technical trend shows that the medium- to long-term structure remains solid. The stock price has stabilized above all major moving averages, with the 10-day (MA10), 30-day (MA30), and 60-day (MA60) lines at HKD 140.45, HKD 126.37, and HKD 122.35 respectively, forming a bullish alignment that provides strong support for the stock.
The recent changes in technical patterns are particularly noteworthy. According to publicly available technical analysis data, Baidu's stock chart has recently shown a typical bullish pattern. Specifically, a 'Head and Shoulders Bottom' upward breakout pattern has been observed by the market. This is an important bottom reversal signal, which usually indicates that after breaking through its neckline resistance, the stock price may enter a sustained upward trend.
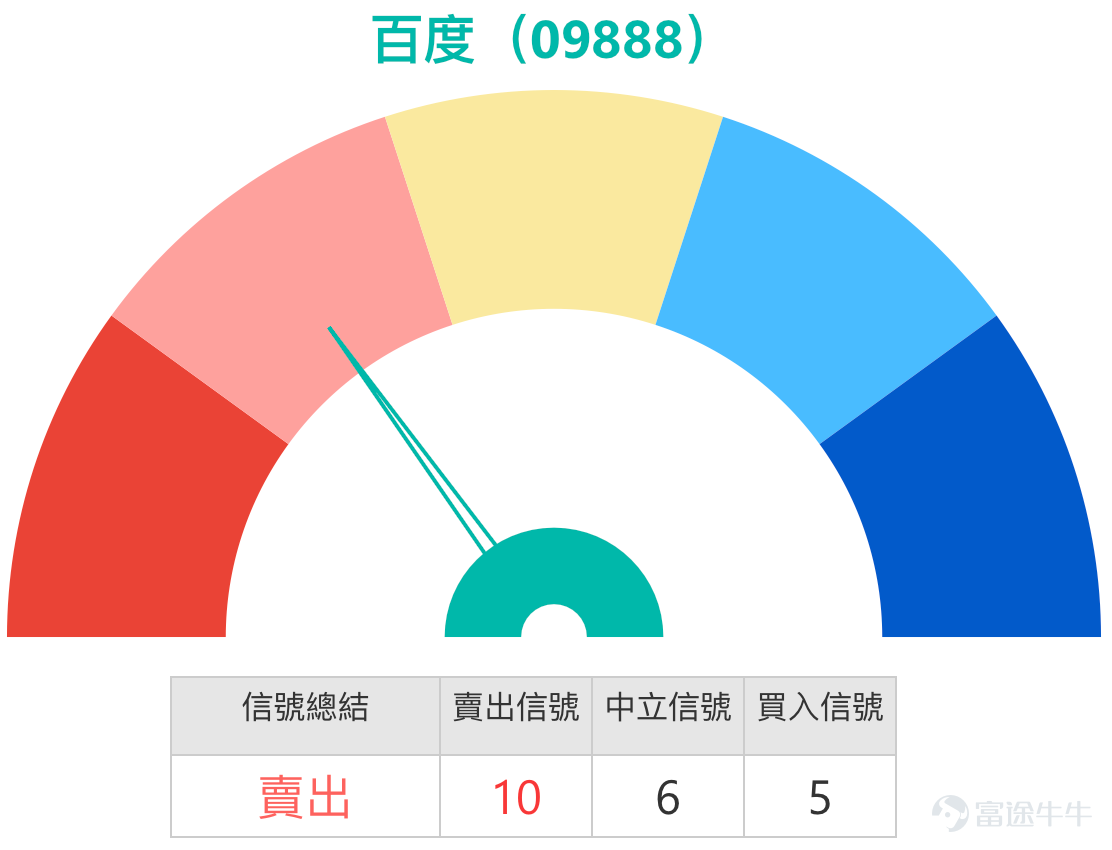
However, following the rapid rise, short-term technical indicators show conflicting signals, suggesting the market may enter a consolidation phase. Multiple trend indicators like the Ichimoku Cloud and MACD signal “buy,” but some oscillation indicators have issued warnings. Currently, the Relative Strength Index (RSI) is at 68, approaching overbought territory, while the Williams %R and Stochastic Oscillator both suggest “overbought” or “sell” signals. This also aligns with the system’s technical indicator summary signal of “sell” (signal strength 10), indicating that after the rapid rally, short-term profit-taking pressure and technical correction needs coexist.
Support and Resistance Analysis: Focus on Key Breakthrough at HKD 149.7
According to the latest technical analysis data and combining market perspectives, the key price range for Baidu's stock in the short term has become very clear, consistent with Simon's recent commentary on [Hong Kong Stock Podcast].
On the upside resistance, the primary level undoubtedly lies at HKD 149.7. This is not only a key resistance level indicated by technical analysis but also closely aligns with the resistance level of HKD 148.8 mentioned by Simon in the program. Investors should focus on whether the stock price can successfully break through and stabilize above this level. If this barrier is effectively overcome, the next target will be HKD 160.7, which represents the secondary resistance level in this technical analysis.
On the downside support, the first crucial line of defense is located at HKD 133.1. This position is close to the 10-day moving average and falls within a critical retracement area of recent gains, indicating strong potential for support. Should this support fail, the stock price may further decline to test the more significant support zone at HKD 124.7.

Market View Summary: AI Business Drives Valuation Reassessment
Baidu's recent strong performance has been primarily driven by market expectations for a revaluation of its artificial intelligence (AI) business. Several major firms have recently raised their target prices, optimistic about the long-term potential of Baidu’s AI-related operations.
JPMorgan upgraded Baidu’s rating from 'Neutral' to 'Overweight' and significantly increased its target price by 76% to HKD 185. The core logic of the report focuses on the expectation that revenue growth from Baidu Cloud will accelerate to approximately 61% by 2026, driven by surging sales of Baidu’s self-designed Kunlun chips. The firm believes that Baidu Cloud and its AI business are set to become the group's main growth engine and value driver.
Tianfeng Securities’ report provides a more detailed perspective, noting that Baidu’s short-term revenue might face some pressure due to AI upgrades. However, the firm emphasizes that Baidu’s operational resilience amid a complex macro environment, along with the steady development of its ‘Wenxin Yiyan’ AI initiatives, reflects its long-term value. Therefore, it maintains a 'Buy' rating. Similarly, BOC International believes that despite the ongoing transition in traditional advertising, Baidu still holds opportunities for long-term valuation increase under its AI transformation, raising its target price to HKD 143.
Derivatives Review: Leverage Effect Stands Out in Trending Markets
When the underlying stock shows clear trending behavior, derivatives can be used more efficiently to capture price movements. Reviewing several products mentioned on January 8, 2026, over the following two trading days (up to January 10), Baidu's underlying stock rose cumulatively by 3.14%, while related derivative products demonstrated their leverage characteristics prominently.
Specifically, call warrants performed impressively: Moli Call Warrant (21055) and Huatai Call Warrant (20727) saw price increases of 28% and 17%, respectively, over two days. Bull contracts also recorded notable gains: UBS Group Bull Contract (66510) and JPMorgan Bull Contract (64563) achieved rises of 23% and 22%, respectively. This data clearly illustrates that when the underlying stock exhibits a clear one-sided trend, both CBBCs and bull/bear contracts may experience price changes several times greater than those of the underlying stock, offering investors opportunities for higher efficiency deployment.

Derivatives Deployment Strategy under Current Market Conditions
If you are bullish on the underlying stock breaking through resistance, consider focusing on high-leverage call warrants or bull contracts.
Investors who believe that the AI value revaluation logic will drive the stock price to break through the resistance level of 149.7 yuan can pay attention to the following products.
* CITIC Call Warrant (23747): This product has an exercise price of 149.98 yuan, which is close to the current price, offering approximately 6.9 times actual leverage. Its main feature is the lowest premium among similar products, while implied volatility and leverage levels are relatively ideal. A lower premium means investment costs are closer to the intrinsic value of the product, reducing additional costs caused by market sentiment fluctuations.
* Morgan Call Warrant (24096) $MSBAIDU@EC2604B.C (24096.HK)$ : This product has an exercise price of 148.98 yuan, providing approximately 5.3 times actual leverage. Its features include leverage and implied volatility at a relatively ideal level, making it suitable for investors optimistic about a clearer upward trend in the underlying stock.
* UBS Group Bull Certificate (66510) and JPMorgan Bull Certificate (64563) $JP#BAIDURC2703E.C (64563.HK)$ : The forced recovery prices of these two bull certificates are set at 126 yuan and 125 yuan respectively, providing approximately 6.9 times and 6.3 times actual leverage. The price movement of bull certificates usually closely follows the underlying stock, and there is no time decay, making them suitable for capturing short-term trends. However, extreme caution is required as once the underlying stock price touches the recovery price, the bull certificate will be immediately forced to recover, potentially resulting in total investment loss.

If expecting the underlying stock to undergo a pullback and consolidation, one can focus on put warrants or bear contracts.
For investors concerned about high RSI and technical pressure in the short term, bearish tools can be used to hedge risks or capture pullback opportunities.
* Bank of China Put Warrant (24326) $BIBAIDU@EP2607B.P (24326.HK)$ and UBS Group Put Warrant (24276): These two products have an exercise price of 131.7 yuan, offering approximately 3 times actual leverage. Their feature is higher leverage compared to similar put warrants, with relatively low premiums. Unlike bull/bear certificates, put warrants do not have a forced recovery mechanism.
* Societe Generale Bear Certificate (53254) and UBS Group Bear Certificate (53206) $UB#BAIDURP2712E.P (53206.HK)$The recovery prices for both bear contracts are set at HK$155, offering actual leverage of up to approximately 10.6 times. Among them, the Societe Generale bear contract (53254) stands out for its highest actual leverage and relatively lower premium; while the UBS Group bear contract (53206) is characterized by having the lowest premium. These products are suitable for investors with a higher risk tolerance who believe that the stock price will encounter resistance at the current level and subsequently decline.

Against the backdrop of optimistic expectations for the revaluation of Baidu's AI business and short-term technical indicator divergence, do you think Baidu's share price will first consolidate power to break through the key resistance at HK$149.7, or will it first pull back to the support level near HK$133.1? In terms of deployment strategy, would you prefer to use high-leverage bull-bear contracts to capture potential breakout movements, or choose put warrants without recovery risk to address short-term fluctuations?
For analysis of Hong Kong stock warrants and bull/bear contracts, I’m Jenny. See you again next time.
#Baidu Group #Technical Analysis #Support and Resistance Levels #Artificial Intelligence #Warrants #Bull and Bear Certificates #Derivatives #Kunlun Core #Hong Kong Stock Deployment #Risk Management
This article does not constitute any investment advice
This article is for reference only and does not constitute any investment advice. The market data, opinions, and analysis contained herein may change at any time without prior notice. We shall not be liable for any loss or damage arising from reliance on the information in this article. Technical analysis merely indicates whether certain technical conditions are met; a comprehensive evaluation of asset performance should incorporate additional data. Trading decisions should not be based solely on the content of this article. Please note that past performance is not indicative of future results.
Risk Disclaimer: The above content only represents the author's view. It does not represent any position or investment advice of Futu. Futu makes no representation or warranty.Read more

Comments
to post a comment
1
2