
Waller's new policy measures are in the works! How should investors respond?
Technical Analysis of 11 Major US Stock Sectors (January 13): Real Estate/Finance/Technology/Communications/Discretionary Consumption/Industrials/Raw Materials/Energy/Staple Consumption/Healthcare/Utilities
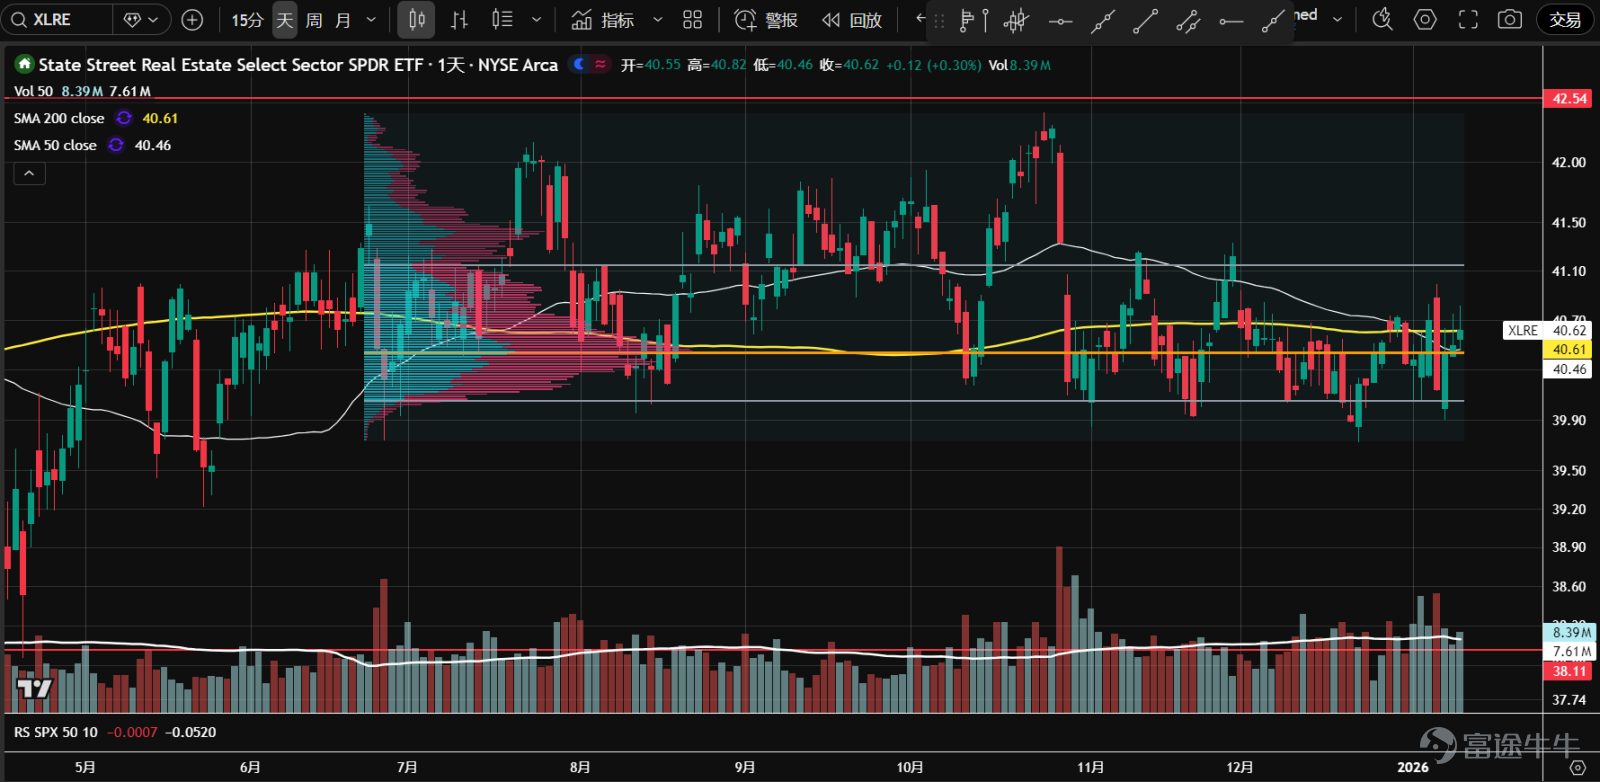
1. Real Estate $Real Estate Select Sector Spdr Fund (The) (XLRE.US)$ Multiple false downside breakouts, currently continuing to fluctuate within the consolidation range. Overall trading volume is not low, and the divergence between bulls and bears remains significant. The stock price is near the volume control point (orange line), with an unclear direction; it is recommended to stay on the sidelines.

2、 $Financial Select Sector SPDR Fund (XLF.US)$ After months of sideways movement, it broke through the consolidation range, with relative strength outperforming the S&P 500, entering a new upward channel, forming a bullish price-volume cycle. Yesterday, it gapped down at the open but found support at the lower channel boundary, with slightly increased volume, potentially continuing to rise along the channel.

3、 $The Technology Select Sector SPDR® Fund (XLK.US)$ Moving towards the apex of a triangular structure, overall trading volume has been relatively low since the end of November, with the bottom gradually rising, indicating a possible accumulation zone. Extremely narrow range-bound trading over the past three weeks, with moderate increase in trading volume, suggests an impending breakout; upward breakout seems more likely with a favorable risk-reward ratio.

4、 $The Communication Services Select Sector SPDR® Fund (XLC.US)$ Recently challenging the historical resistance around 118 but failed to break through due to insufficient demand; a large-volume bearish candle appeared, but no follow-through decline occurred. Currently, narrow-range oscillation near the volume control point (orange line); observe whether floating profits are being absorbed.

5、 $Consumer Discretionary Select Sector SPDR Fund (XLY.US)$ After a false breakout in mid-December, it returned within the range, showing a large bearish candle and bullish candle at the 50-day moving average and low-volume node, indicating bulls entering. The stock price is now breaking out upwards with bull-driven price-volume cycles, presenting opportunities for buying on dips.

6、 $Industrial Select Sector SPDR Fund (XLI.US)$ After breaking through the upper boundary of the consolidation zone at 156 in late December, a low-volume pullback confirmed extremely weak supply, followed by another surge in volume driving the uptrend. This is a textbook breakout pattern with a bull-driven price-volume cycle; an uptrend is now established.

7、 $Materials Select Sector SPDR ETF (XLB.US)$ After consolidating sideways for over half a year, it broke through resistance with strong volume early this month, quickly retested 46, and continued higher to new highs. A valid breakout, now in an uptrend.

8、 $Energy Select Sector SPDR Fund (XLE.US)$ Near the apex position, a surge in volume pushed through a one-and-a-half-year consolidation zone; then retraced on reduced volume, bouncing back near the upper edge of the value area. Future focus will be on whether it can hold above resistance and open up further upside space.

9、 $Consumer Staples Select Sector SPDR Fund (XLP.US)$ Near the pivot at 77 and the lower edge of the value zone, there was initially heavy-volume selling, followed by a sharp rebound on increased volume, lifting the bottom. The stock price is currently approaching the volume control point (orange line), facing significant floating supply pressure; watch if it stabilizes here.

10、 $The Health Care Select Sector SPDR® Fund (XLV.US)$ Since December, it has been stuck in a sideways consolidation and moved toward the apex position; during the consolidation, overall trading volume declined, suggesting possible accumulation. Recently, it broke out upwards with strong volume, retested without violating the uptrend line, and formed a small hammer candle. A long position could be considered, with a favorable risk-reward ratio.

11、 $Utilities Select Sector SPDR Fund (XLU.US)$ In a downtrend since October last year, it stabilized with high volume near the yearly line recently. The stock price has been consolidating sideways for a month, forming a b-shaped volume distribution, with increasing divergence between buyers and sellers. Currently near the volume control point (orange line), direction remains unclear; observation is recommended.

$S&P 500 Index (.SPX.US)$ $SPDR S&P 500 ETF (SPY.US)$ $NASDAQ 100 Index (.NDX.US)$ $Invesco QQQ Trust (QQQ.US)$ $Dow Jones Industrial Average (.DJI.US)$ $State Street® SPDR® Dow Jones Industrial Average® ETF Trust (DIA.US)$ $Russell 2000 Index (.RUT.US)$ $iShares Russell 2000 ETF (IWM.US)$ $USD (USDindex.FX)$ $U.S. 10-Year Treasury Notes Yield (US10Y.BD)$ $XAU/USD (XAUUSD.CFD)$
Risk Disclaimer: The above content only represents the author's view. It does not represent any position or investment advice of Futu. Futu makes no representation or warranty.Read more


Comments
to post a comment
9
4